1584
Optimal excitation location for magnetic resonance elastography of the supraspinatus muscle1Department of Radiological Science, Graduate School of Human Health Science, Tokyo Metropolitan Unversity, Arakawa, Japan, 2Health Research Institute, National Institute of Advanced Industrial Science and Technology, Tsukuba, Japan, 3Department of Mechanical Engineering, Tokyo Denki University, Adachi, Japan, 4Department of Judo Neurophysiotherapy, Graduate School of Medicine and Pharmaceutical Sciences, University of Toyama, Toyama, Japan, 5Department of System Emotional Science, Graduate School of Medicine and Pharmaceutical Sciences, University of Toyama, Toyama, Japan
Synopsis
It is difficult to palpate the supraspinatus muscle since it is difficult to determine their anatomic location superficially. Magnetic resonance elastography (MRE) can measure tissue stiffness quantitatively only if vibrations reach these tissues. To vibrate the tissues efficiently, it is necessary to determine the best excitation location. We investigated the excitation location suitable for MRE of the supraspinatus muscle. When the excitation location was placed on the trapezius muscle, the wave images represented clear wave propagation compared with those on the head of humerus. Therefore, optimal excitation location may be the trapezius muscle in the MRE of the supraspinatus muscle.
PURPOSE
Shoulder injuries are significant problems among throwing athletes (those who play baseball, volleyball, tennis, etc.). In particular, rotator cuff injuries often occur; they usually occur first at the supraspinatus muscle.1 Therefore, evaluation of stiffness of the supraspinatus muscle would help the diagnosis of rotator cuff tears and evaluation of its treatment.
Palpation is the standard clinical tools to diagnose abnormal stiffness changes in the soft tissues. However, it is difficult to palpate the supraspinatus muscle since it is difficult to determine their anatomic location superficially. Magnetic resonance elastography (MRE) uses harmonic mechanical excitation to measure tissue stiffness.2 Tissue displacements due to vibrations are encoded into an MR phase image (wave image) by using bipolar gradient lobes (motion-encoding gradient: MEG). Recorded wave images are converted into the shear stiffness value. MRE allows measurement of mechanical properties of both superficial and deep tissues only if vibrations reach these tissues. In order for vibrations to reach the tissues, it is necessary to determine the best excitation position, which can vibrate these tissues efficiently.
The purpose of this study was to determine the excitation location suitable for the MRE of the supraspinatus muscle. We investigated effects of changes in excitation locations (positions of vibration pad) on wave images.
METHODS
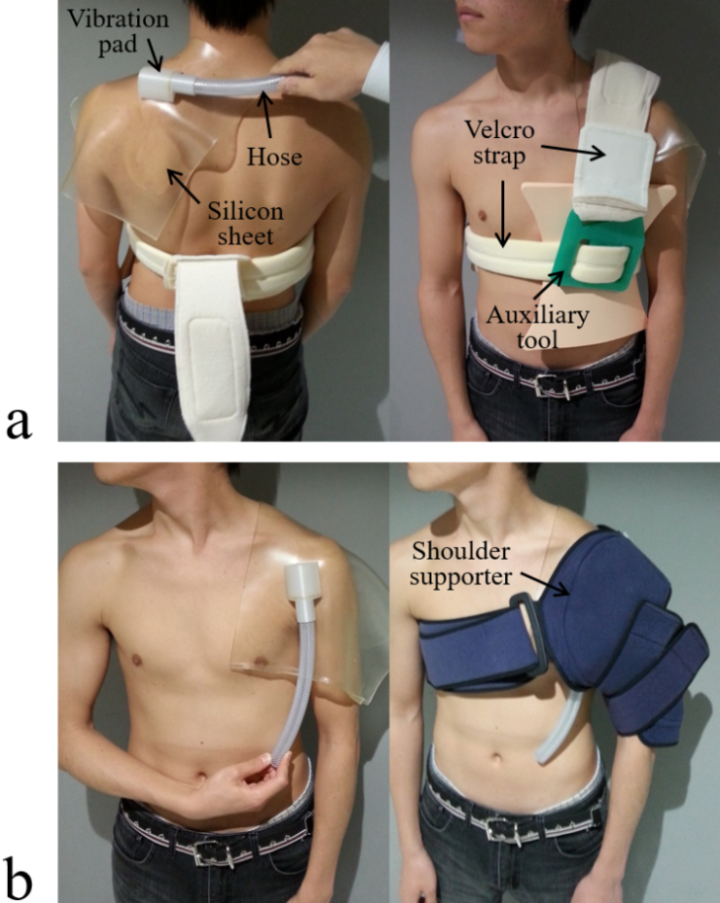
All MRE experiments were performed on a clinical MR imager (Achieva 3.0T; Philips Healthcare, Best, The Netherlands) using a shoulder coil with subjects in the supine position. In this study, 6 healthy volunteers underwent MRE. A power amplifier (XTi 1000; Crown, IN USA) and a pneumatic pressure generator (Subwoofer TIT320C-4 12”; Dayton Audio, OH, USA) were used to supply vibrations to a vibration pad. The vibration pad was designed using a three-dimensional (3D) printer (3Dtouch; 3D System, SC, USA) in order to adapt to individual shoulder shapes. Figure 1 shows a setup of the vibration pad for MRE. The vibration pad was placed on the trapezius muscle (a proximal side of the supraspinatus muscle) (Fig. 1a) or the head of humerus (a distal side of the supraspinatus muscle) (Fig. 1b). MRE acquisitions were performed with a gradient-echo type multi-echo MR sequence, and axial images of the supraspinatus muscle were obtained. In this sequence, bipolar readout gradient lobes achieved a similar function to MEG.3 The wave images were recorded with the following parameters: 256×256 acquisition matrix, 4 number of averages, 2 SENSE reduction factor, 20° flip angle, 170 mm2 field of view, 5 mm slice thickness, AP readout direction (MEG direction), 2.3 ms 1st TE, 5 ms δTE, 20 ms repetition time, and 40 s total acquisition time (4 phase offsets). The stiffness was calculated using the following equation μ = ρ (f. λ)2, where ρ is the muscle density (≒1 g/cm3), f is the frequency and λ is the wavelength.RESULTS
When the vibration pad was placed on the trapezius muscle, the wave images represented clear wave propagation (Fig. 2). However, when the vibration pad was placed on the head of humerus, wave propagation was unclear (Fig. 3). Furthermore, when the vibration pad was placed on the head of humerus, the amplitudes decreased by about 40 % compared with those on the trapezius muscle (Fig. 4). Therefore, the stiffness was calculated when the vibration pad was placed on the trapezius muscle because of clear wave propagation. The stiffness value (n = 6) was 8.42 ± 1.55 (mean ± SD) kPa.DISCUSSION
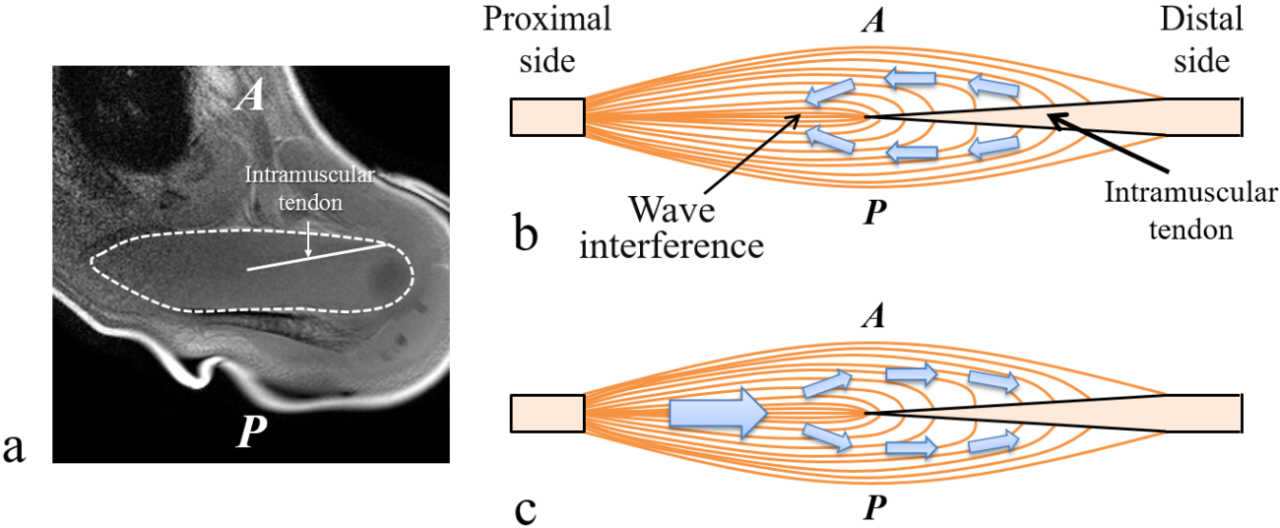
When the vibration pad was placed on the head of the humerus, wave propagation was unclear and the amplitudes were low. There might be 2 reasons for these results. First, the distal supraspinatus muscle is surrounded by some bones (e.g., clavicle). If these bones function as vibration sources, the waves might be propagated to the supraspinatus muscle from multiple directions to interfere within the supraspinatus muscle. Second, two waves along the intramuscular tendon within the supraspinatus muscle might interfere with each other (Fig. 5). Previous studies have reported that propagating wave in the distal side of the supraspinatus muscle was divided into two separate waves in the anterior and posterior portions of the supraspinatus muscle due to the intramuscular tendon.4 Therefore, when the waves were propagated from the distal side of the supraspinatus muscle, two separate waves might interfere with each other (Fig. 5b). When the vibration pad was placed on the trapezius muscle, effects of these wave interferences might be small (Fig. 5c).CONCLUSIONS
Our results demonstrated that the excitation location should be placed on the trapezius muscle (a proximal side of the supraspinatus muscle) in the MRE of the supraspinatus muscle.Acknowledgements
No acknowledgement found.References
1. Matsuki K, Watanabe A, Ochiai S, et al. Quantitative evaluation of fatty degeneration of the supraspinatus and infraspinatus muscles using T2 mapping. J Shoulder Elbow Surg 2014;23(5):636-641.
2. Muthupillai R, Lomas DJ, Rossman PJ, et al. Magnetic resonance elastography by direct visualization of propagating acoustic strain waves. Science 1995;269(5232):1854-1857.
3. Numano T, Mizuhara K, Hata J, et al. A simple method for MR elastography: a gradient-echo type multi-echo sequence. Magn Reson Imaging 2015;33(1):31-37.
4. Ito D, Numano T, Mizuhara K, et al. A new technique for MR elastography of the supraspinatus muscle: a gradient-echo type multi-echo sequence. Magn Reson Imaging 2016;34(8):1181-1188.
Figures