1580
Whole-body MRI in facioscapulohumeral muscular dystrophy: Preliminary results1Center for Genetic Muscle Disorders, Kennedy Krieger Institute, Baltimore, MD, United States, 2Neurology, The Johns Hopkins University School of Medicine, Baltimore, MD, United States, 3Siemens Healthcare, Baltimore, MD, United States, 4Radiology and Imaging, Hospital for Special Surgery, New York, NY, United States, 5Radiology and Radiological Science, The Johns Hopkins University School of Medicine, Baltimore, MD, United States, 6Sidney Kimmel Comprehensive Cancer Center, The Johns Hopkins University School of Medicine, Baltimore, MD, United States
Synopsis
Facioscapulohumeral muscular dystrophy (FSHD) is a hereditary disorder that causes progressive muscle wasting. Whole-body MRI (WBMRI) was used to scan 24 adults with genetically-confirmed type 1 FSHD. Muscles were scored for fat infiltration and edema-like changes. Fat infiltration scores were compared to muscle strength and function measurements. Our analysis reveals a distinctive pattern of muscle involvement and sparing in FSHD. Averaged fat infiltration scores for muscle groups in the legs were statistically significantly associated with quantitative muscle strength and 10-meter walk time. We conclude that WBMRI offers a promising disease biomarker in FSHD and other muscular dystrophies.
Purpose
Facioscapulohumeral muscular dystrophy (FSHD) is an autosomal dominant disorder (1:20,000) that causes progressive skeletal muscle weakness in the face, shoulder girdle, and limbs1. Despite significant advances in our understanding of the pathophysiology of disease, the absence of disease-specific biomarkers of muscle disease continues to be a major barrier to translational research in FSHD. Multiple groups have investigated the utility of localized MRI in assessing disease severity in clinical trials and observational studies of muscular dystrophy. To explore the utility of whole-body MRI (WBMRI) as a potential outcome measure for FSHD, we examined adults with FSHD using a multiparametric, continuous table movement (CTM), non-contrast WBMRI protocol.Methods
Individuals with genetically-confirmed type 1 FSHD were invited to participate in a single center, cross-sectional study. WBMRI was performed in 24 subjects using a 3T scanner (MAGNETOM Tim Trio, Siemens Healthcare, Erlangen, Germany). A CTM protocol was used to obtain axial whole-body T1-weighted (T1W) fat-saturated images (TR/TE = 150/3.69ms, FOV = 50x50cm2, matrix size = 320x161, TI = 220ms, slice thickness = 5mm), and short tau inversion recovery (STIR) T2-weighted images (TR/TE = 1200/86ms, FOV = 50x50cm2, matrix size = 256x256, TI = 240ms, slice thickness = 4-6mm)2. Quantitative strength measurements and timed function testing were performed. T1W images were scored for fat infiltration using a semi-quantitative scoring system (ranging from 0-5)3. STIR images were assessed for the presence of edema-like changes within muscle. The frequency, severity, and symmetry of muscle involvement were calculated. The associations between fat infiltration scores and clinical measurements were examined using multivariable linear regression models. Significance was set at p<0.05.Results
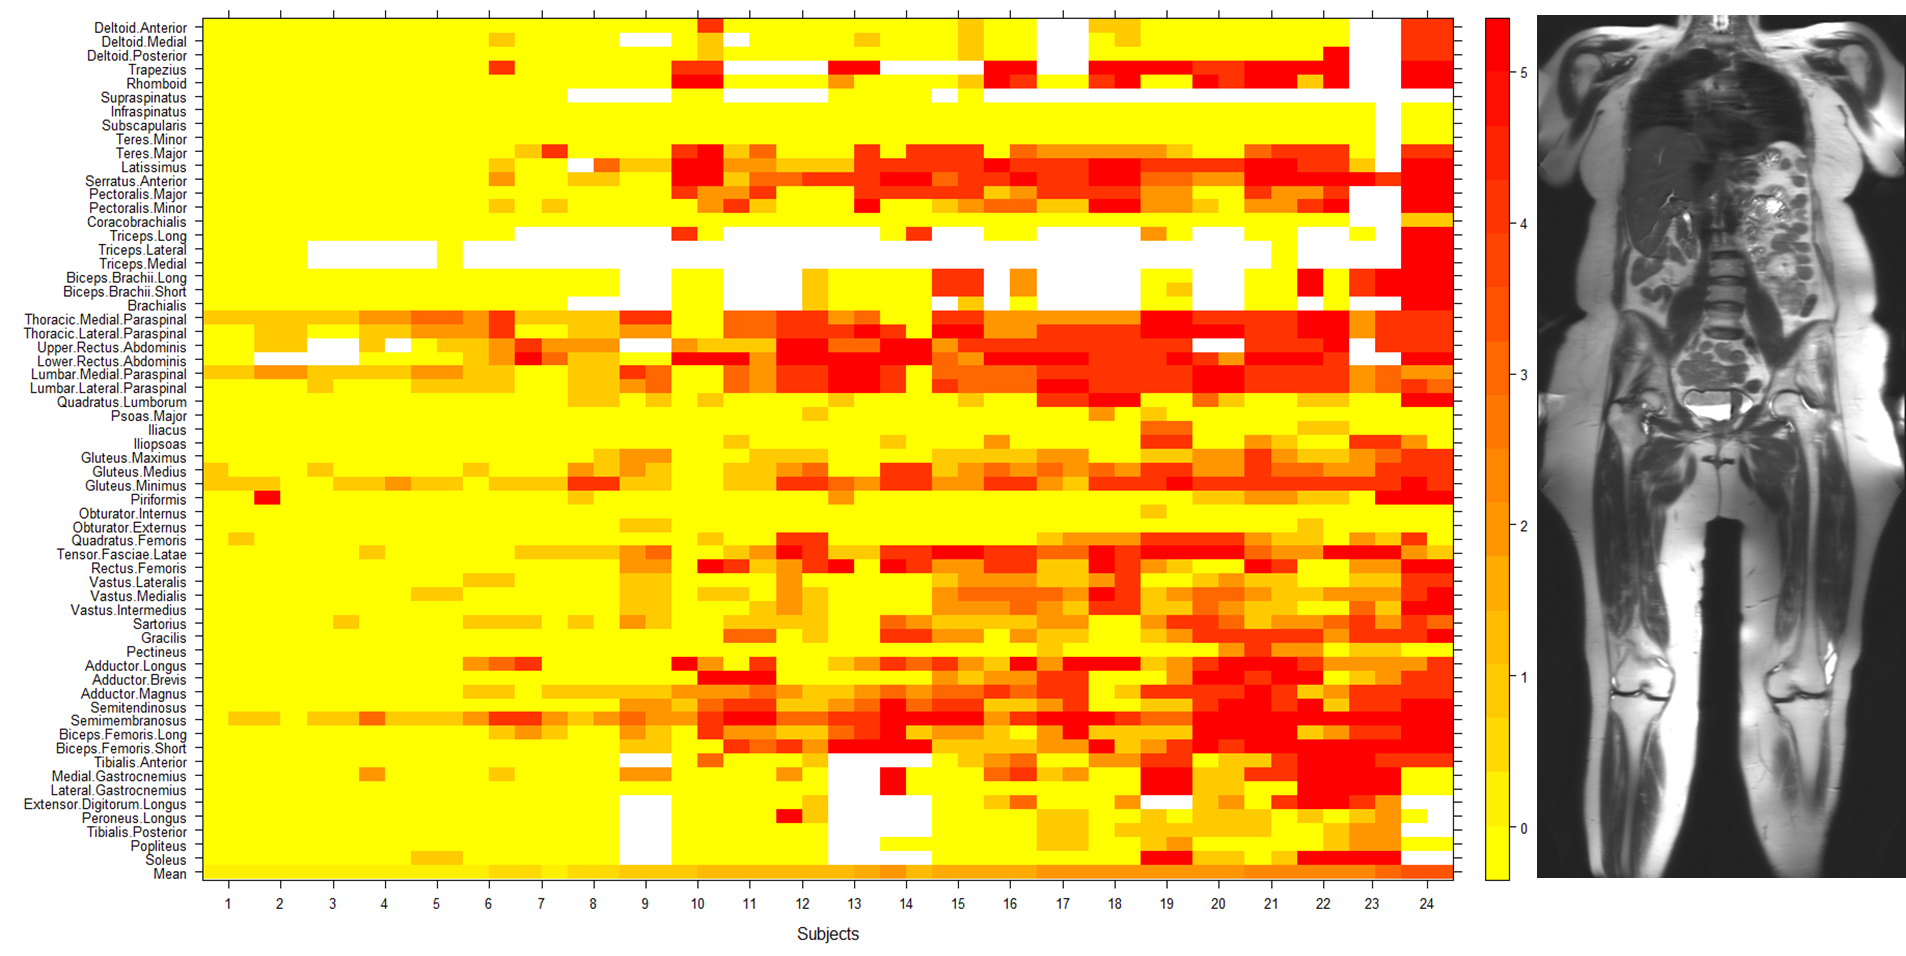
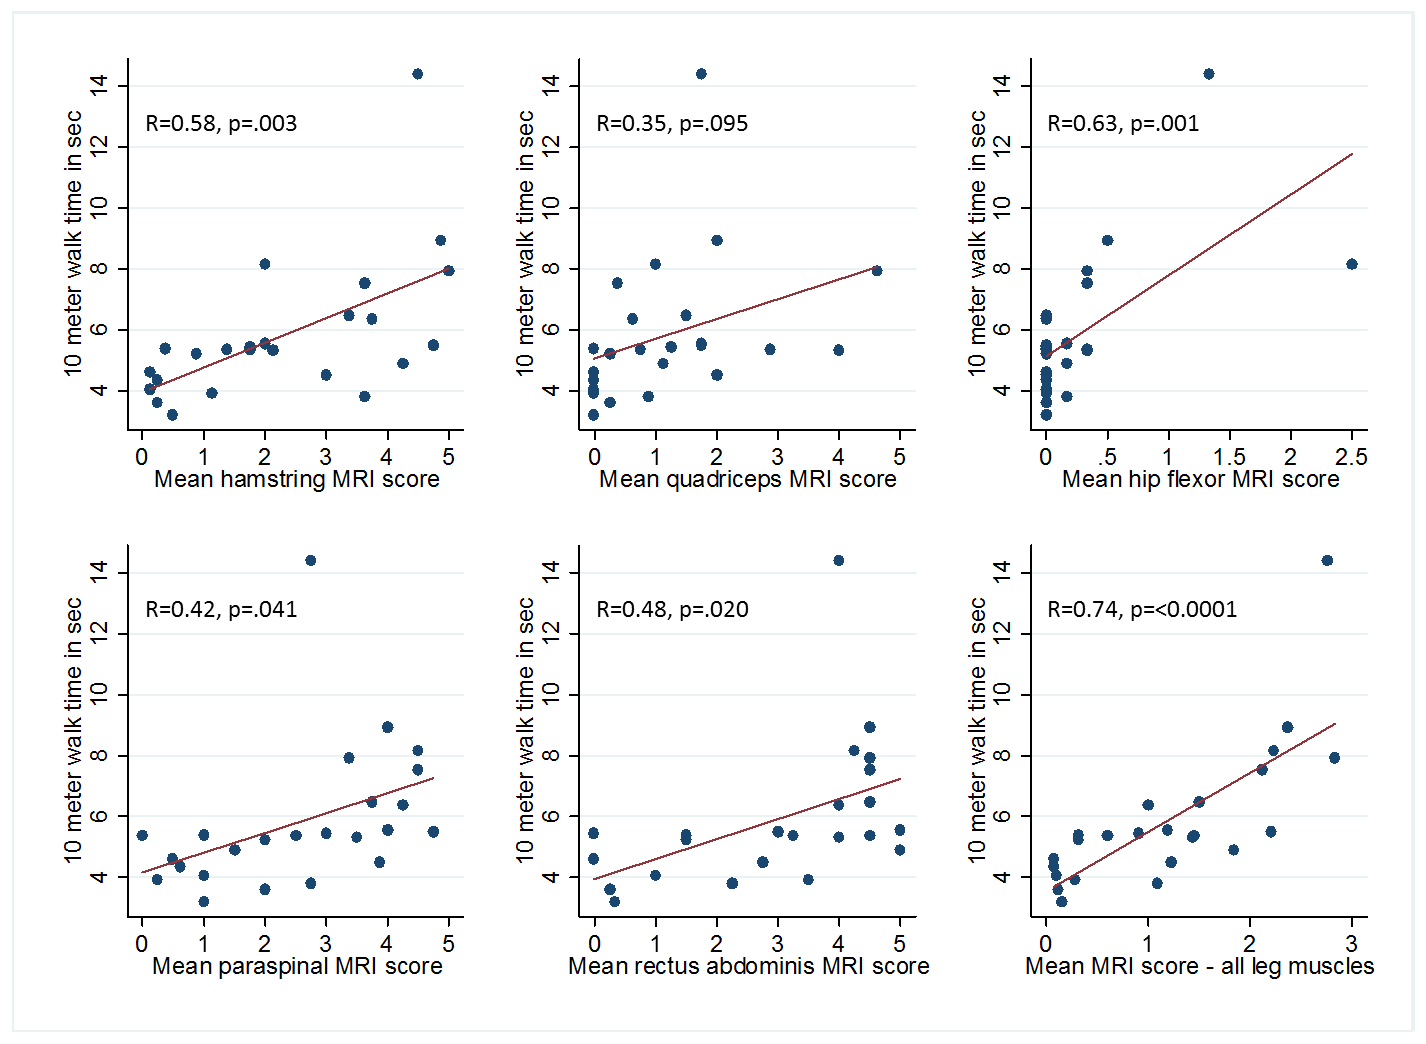
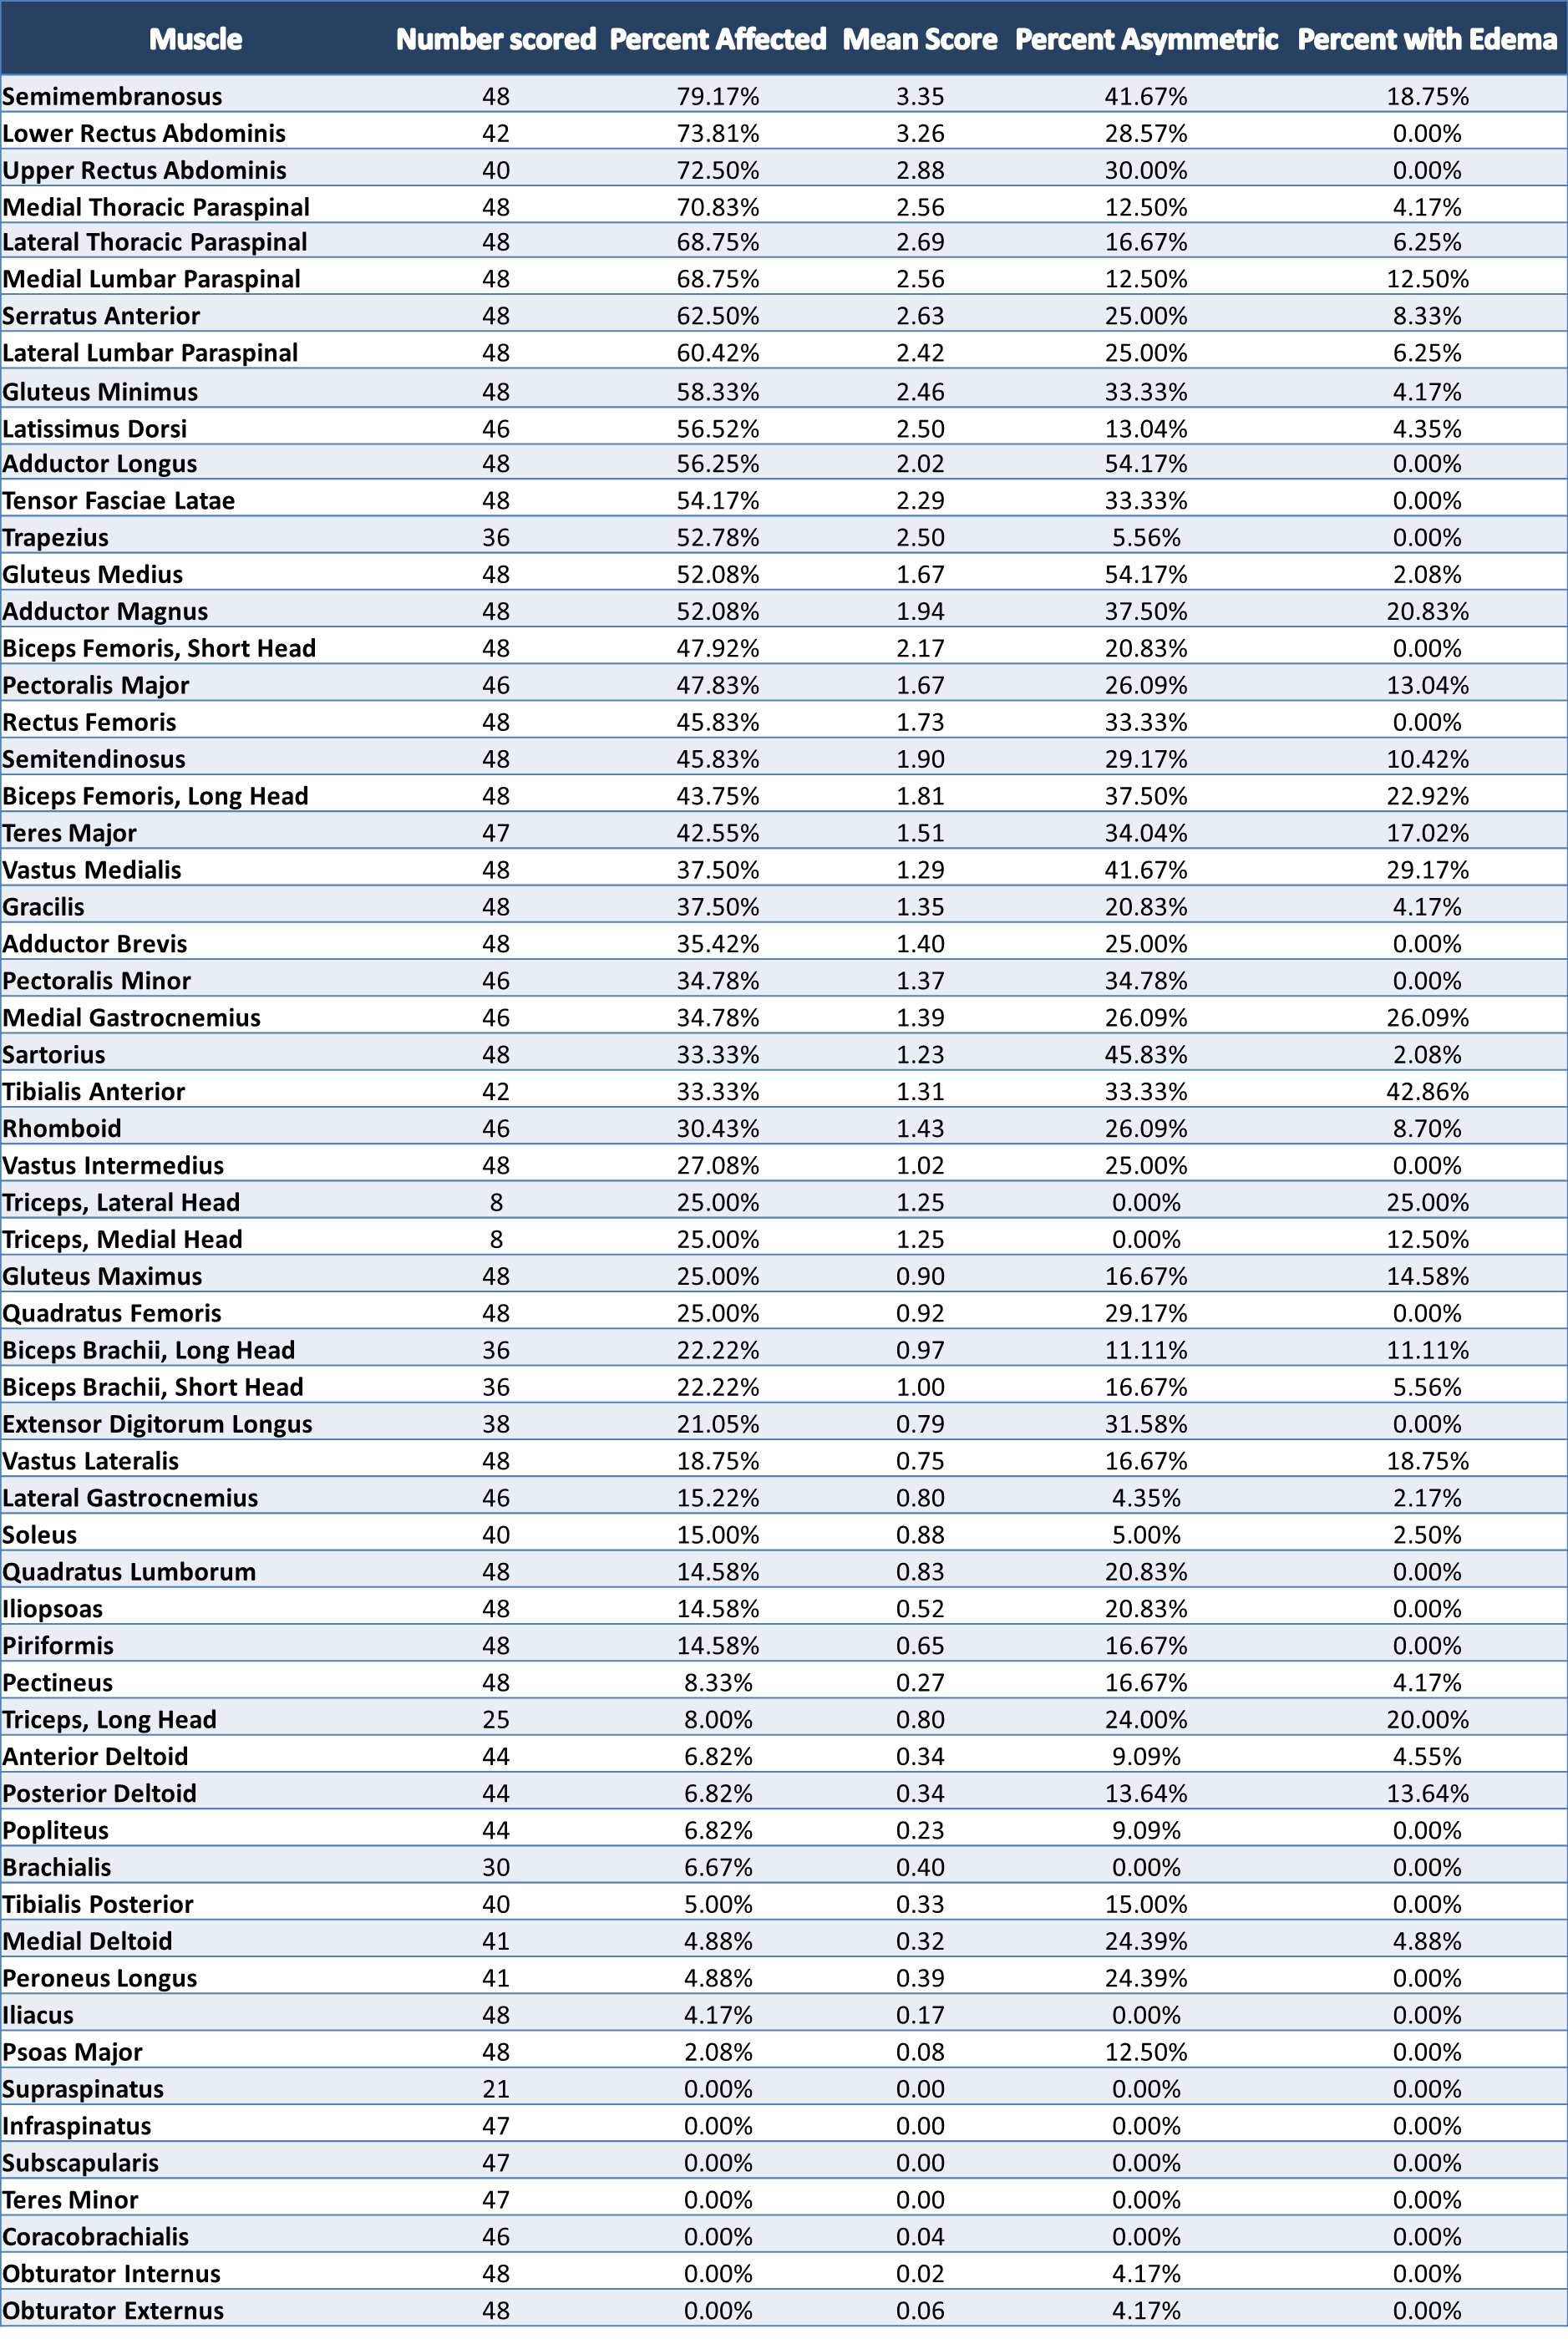
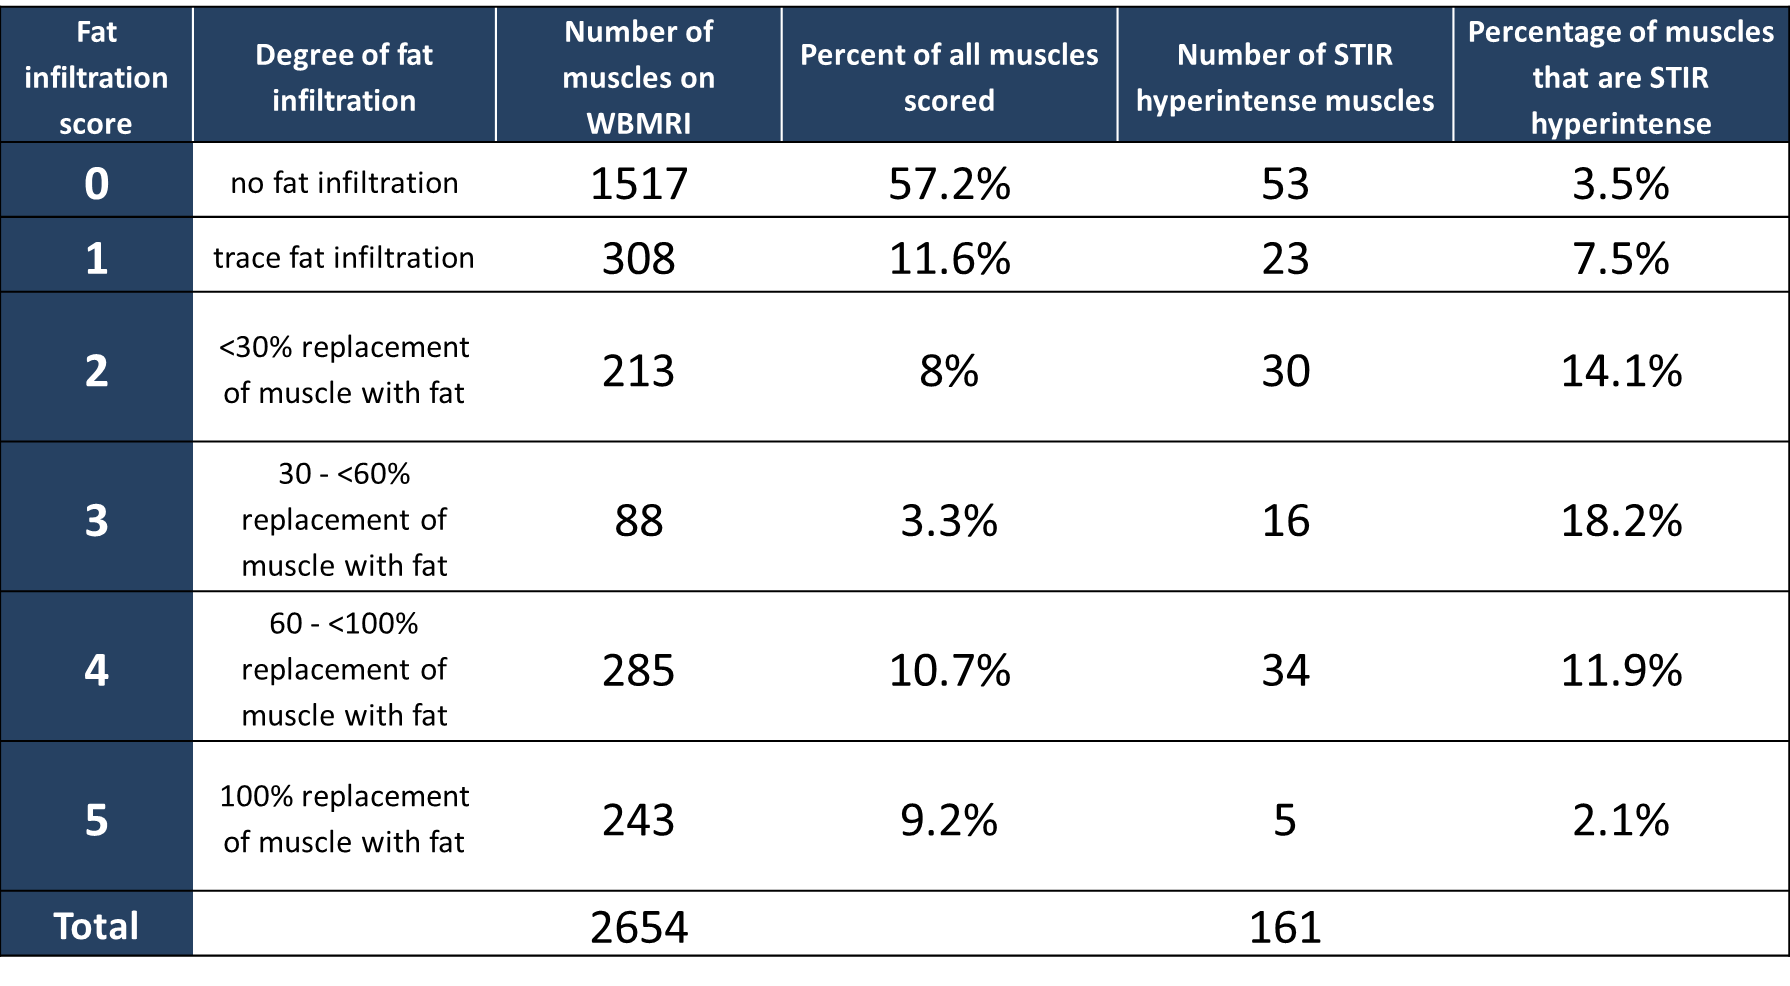
Twenty-four participants (11 male, 13 female) were enrolled in the study. 89 to 118 muscles were scored in each participant, and between 1.7% and 78.6% of muscles were affected within individual participants. The semimembranosus and muscles of the trunk were among the most frequently affected, while the supraspinatus, infraspinatus, subscapularis, teres minor, coracobrachialis, obturator internus, and obturator externus were usually spared. In the study, 294 of 1327 muscle pairs (22.2%) were asymmetrically affected. Only a minority of muscles in each participant were hyperintense on STIR imaging. STIR hyperintensity was most commonly observed in muscles with intermediate levels of fat infiltration (scores of 2 or 3) and was less commonly seen in muscles with the lowest or highest fat infiltration scores. In the hamstring muscles, muscle strength is relatively well-preserved for mean fat infiltration scores <2. As mean fat infiltration scores increased (>2), each one-point increase was associated with a 10.9lb decline in knee flexion strength (p=0.001). Multivariable regression models showed a statistically significant association between the 10-meter walk time and fat infiltration scores in the hip flexors and hamstrings. A one-point increase in mean fat infiltration score in the hip flexors was associated with a 2.4 second increase in the 10-meter walk time (p=0.003). Similarly, each one-point increase in the mean hamstrings fat infiltration score was associated with a 0.8 second increase in the 10-meter walk time (p=0.029).Discussion
We have demonstrated that WBMRI can detect muscle involvement before loss of strength is clinically discernible. Using “global” imaging, we were able to examine the distribution of disease in anatomic regions that are commonly affected in FSHD – such as the shoulder girdle and the trunk – but are rarely imaged in their entirety and cannot be assessed easily using clinical strength testing. Moreover, we detected early fat infiltration in muscles of participants who had positive genetic testing but were asymptomatic. The findings of this study support prior reports of an active phase of inflammatory muscle disease characterized by edema-like changes on fluid-sensitive MRI that is followed by rapid fat replacement in FSHD4. Semi-quantitative MRI scores were statistically significantly associated with both muscle strength and timed function tests in this study, suggesting that imaging can be used to monitor disease progression and predict changes in muscle function. Fully quantitative methods could further improve the sensitivity of WBMRI to smaller changes in fat infiltration. Longitudinal studies are also needed to evaluate the radiographic progression of disease in FSHD and to determine appropriate radiographic endpoints for translational studies and clinical trials.Acknowledgements
MRI technicians: Hugh Wall, Cynthia Maranto, Cynthia Schultz
Funding sources:
Siemens Medical: JHU2012 NR86-01-JA
NIH Grants: 5P30CA006973 (IRAT), R01 CA190299, U01CA140204, 5 K23 NS091379-02, KL2TR001077
The FSH Society Irene Lai research grant: FSHS-82011-02
The American Academy of Neurology Foundation Clinical Research Training Fellowship
The authors also acknowledge the generous contribution of the participants who volunteered for this study.
References
1. Mah JK, Korngut L, Fiest KM, et al. A Systematic Review and Meta-analysis on the Epidemiology of the Muscular Dystrophies. The Canadian journal of neurological sciences Le journal canadien des sciences neurologiques. 2016 Jan;43(1):163-77.
2. Leung DG, Carrino JA, Wagner KR, Jacobs MA. Whole-body magnetic resonance imaging evaluation of facioscapulohumeral muscular dystrophy. Muscle and Nerve. 2015;52(4):512-20.
3. Mercuri E, Pichiecchio A, Allsop J, Messina S, Pane M, Muntoni F. Muscle MRI in inherited neuromuscular disorders: past, present, and future. Journal of magnetic resonance imaging : JMRI. 2007 Feb;25(2):433-40.
4. Friedman SD, Poliachik SL, Otto RK, et al. Longitudinal features of STIR bright signal in FSHD. Muscle Nerve. 2014 Feb;49(2):257-60.
Figures