1578
Body Composition Analysis Combined with Individual Muscle Measurements using Dixon-MRI1Department of Medical and Health Sciences, Linköping University, Linköping, Sweden, 2Advanced MR Analytics AB, Linköping, Sweden, 3Center for Medical Image Science and Visualization (CMIV), Linköping University, Linköping, Sweden, 4Department of Biomedical Engineering, Linköping University, Linköping, Sweden, 5Obstetrics and Gynecology, Linköping University, Linköping, Sweden
Synopsis
Body composition analysis is increasingly important for diagnosis and follow-up in many patient groups and medical conditions. The combined fat and muscle quantification on global and regional level is not commonly reported. In this study a Dixon-MRI based acquisition and body composition analysis was extended to quantify individual muscles. Test-retest reliability was established in a clinically relevant group of 36 postmenopausal women. This method enables advanced phenotyping combined with measurements of specific muscles to target clinical questions.
Introduction
Body composition analysis including precise measurements of fat and muscles in the body are increasingly important for diagnosis and follow-up in many patient groups and medical conditions. Emerging techniques based on Dixon-MRI1 allow rapid whole-body acquisition of water-fat separated images with high soft-tissue contrast.
Manual or semi-automated methods have been the most common approaches for quantification of muscle and fat compartments from MR images. These methods may, however, introduce intra- and inter-operator variability. Furthermore, it is challenging to establish a method that operates with high precision on the global level, regional level, and also for individual muscles.
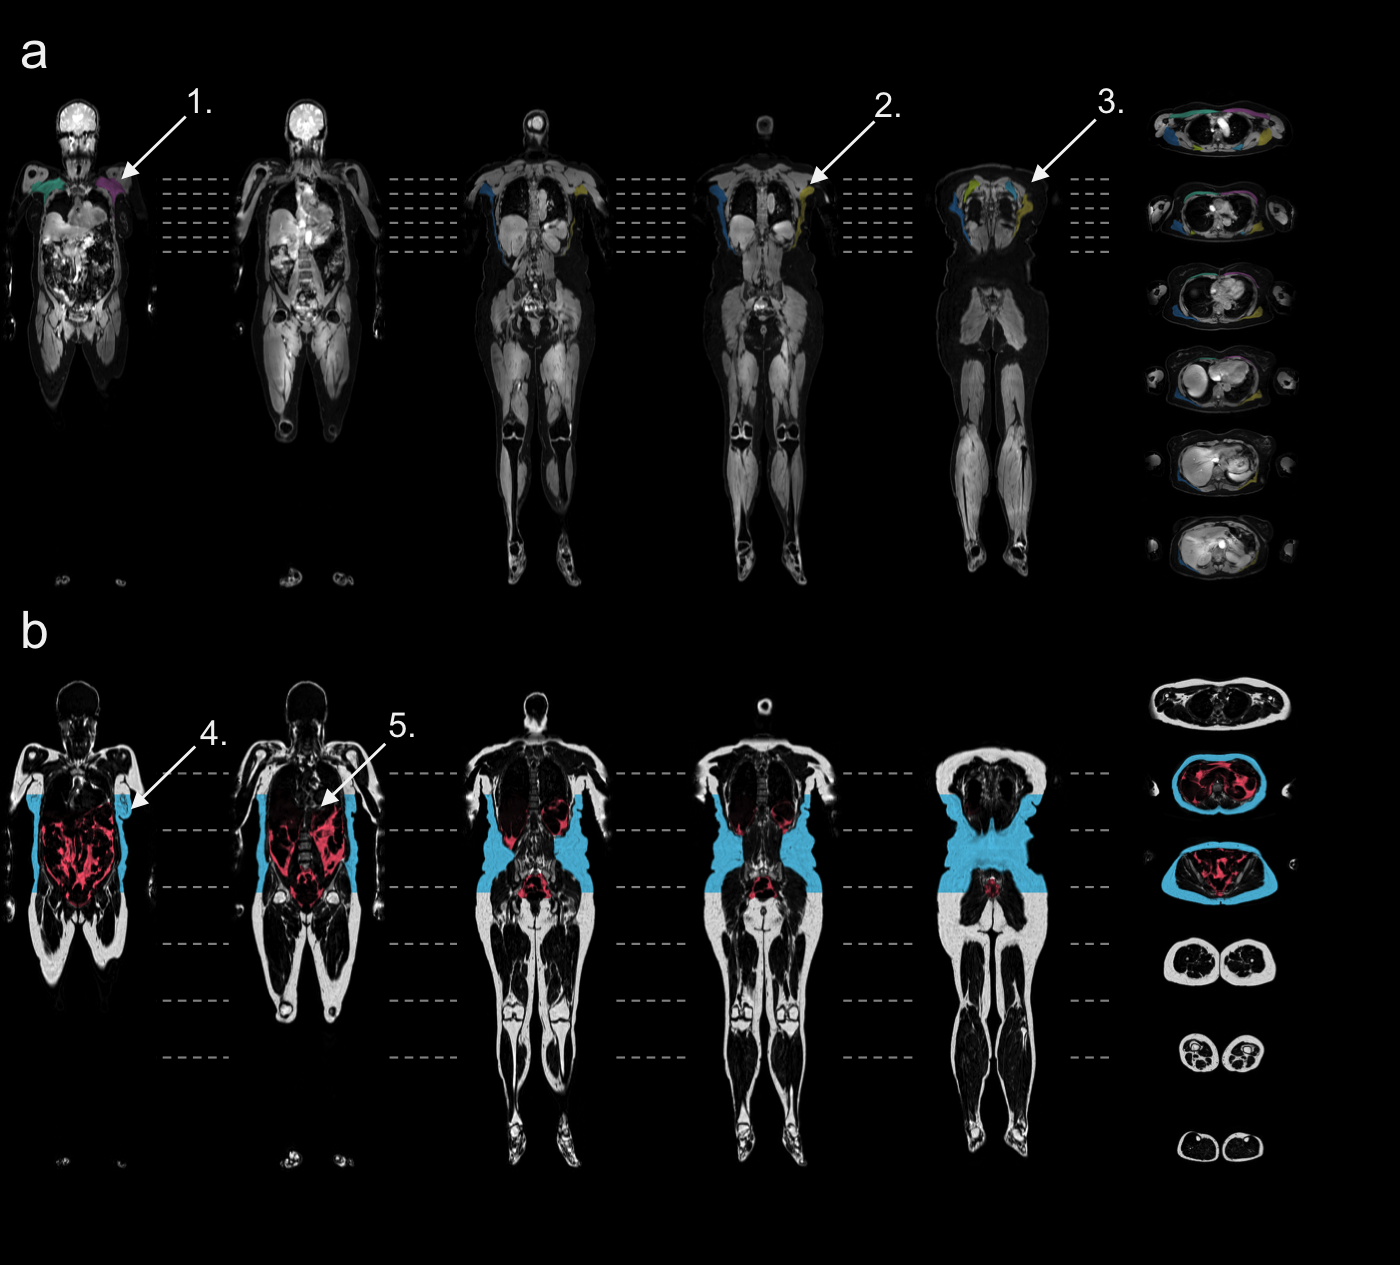
The aim of this study was to extend one recently published method for body composition analysis to also enable measurements of individual muscles. Three representative muscles of various size were selected: latissimus dorsi, pectoralis major, and rhomboideus. Finally, test-retest reliability was established in a clinically relevant group of postmenopausal women.
Methods
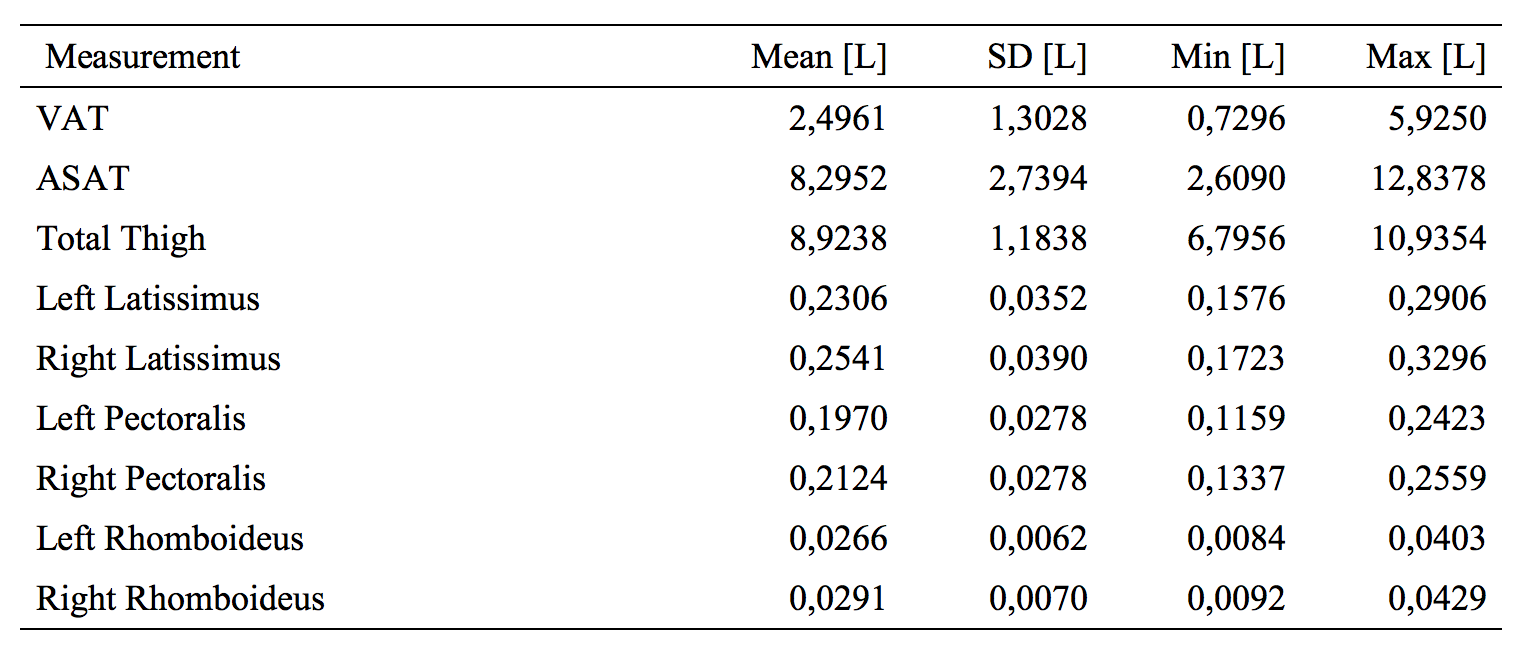
In-vivo imaging was performed using a Philip Ingenia 3.0 T MR-scanner of 36 postmenopausal women, enrolled from a larger intervention study. The mean age was 56 ± 5.95 years (range 45 to 70), the mean BMI was 26.46 ± 3.56 kg/m2 (range 18.89 to 33.50). The main study was a randomized clinical trial investigating effects of resistance training in women. Each subject was scanned twice, where the subject was removed from the scanner room in between acquisitions. The protocol was a four-point whole-body Dixon-protocol divided over ten overlapping slabs of axial 3D spoiled gradient multi-echo images (TR=6.69 ms, TE=1.15/2.30/3.45/4.60 ms, and voxel size 2.5×2.5×4 mm3). The first and last four slabs consisted of 66 slices; slabs two to six consisted of 39 slices, acquired during 17-seconds expiration breath-holds. Water and fat images were calculated from the multi echo images2, using a 6 peak lipid model including R2*-correction3. Phase sensitive reconstruction was performed using an in-house MATLAB (The MatchWorks Inc. Natick, MA) implementation. The study was approved by the regional ethics committee and written informed consent was obtained from all subjects prior to study entry.
Body composition analysis was performed for visceral adipose tissue (VAT), subcutaneous adipose tissue (ASAT), and thigh muscle volume as described in 4-6.
Subsequently, ground-truth labels for the muscles latissimus dorsi, pectoralis major, and rhomboideus, were manually outlined on a random subset of the acquired images. The muscles were segmented and quantified using the method for body composition analysis4-6. Briefly, image calibration was performed using adipose tissue as internal reference, labels were registered to the acquired volumes, quantification and quality control was performed, and finally volumes were calculated by integrating the fat-signal for fat-compartments and fat-free muscle volumes4 for the muscles.
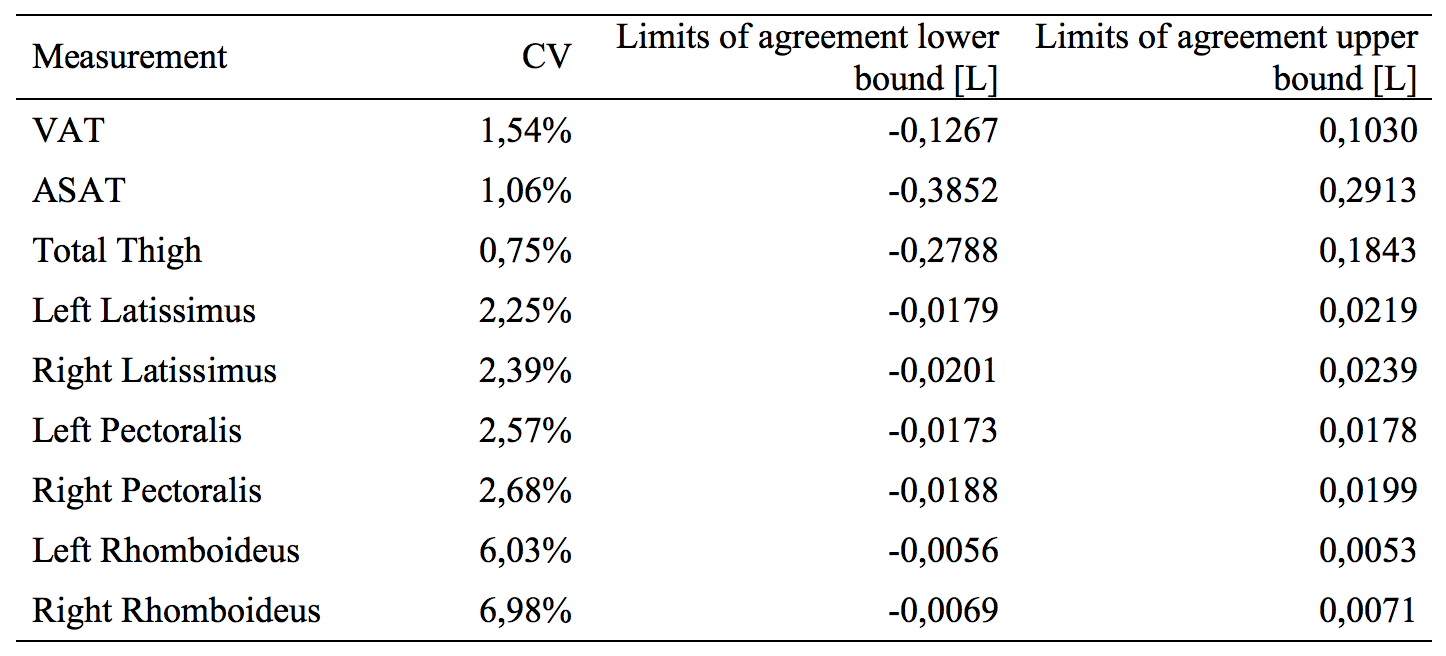
Descriptive statistics were calculated for all volumes. Test-retest reliability was calculated using Bland-Altman analysis (mean of difference, and limits of agreement) and within-subject coefficient of variation (CV). Segmentation and quantification was performed using AMRA® Profiler (Advanced MR Analytics AB, Linköping, Sweden), statistical analysis was performed in SPSS 21(IBM, 2012).
Results
All of the 36 included women were successfully scanned and analysed with an acquisition time of 8:00 minutes per scan. Representative segmentation results from one of the women are shown in Figure 1, and descriptive statistics are reported in Table 1.
The CV for measurements of VAT was 1.54%, ASAT 1.06%, thigh muscle volume 0.75%, latissimus dorsi 2.39%, pectoralis major 2.68%, and rhomboideus 6.98%, complete reliability statistics are presented in Table 2.
Discussion
In this study a previously presented method for body composition analysis was extended to also allow measurements of individual muscles. The muscles were selected to represent various size regimes, where latissimus was largest and rhomboideus smallest. This study verifies that whole-body Dixon-MRI can characterize a wide range of different compartments with high precision. Especially the case of latissimus and pectoralis illustrates that detailed ground-truth labels may be used to answer specific clinical questions. The rhomboideus muscle was challenging to measure with high precision, because of two reasons. First, the muscle was not clearly differentiated from surrounding muscle tissue. Second, the size of the muscle was small in relation to the acquisition resolution.
The investigated group of women is relevant when investigating metabolic and musculoskeletal health. In particular since being in the menopausal transition, body composition may change due to hormonal changes, and is also dependent on a number of factors like dietary and exercise habits.
Conclusion
This study demonstrated that body composition analysis based on Dixon-MRI could be extended to allow precise measurements of individual muscles. This method enables advanced phenotyping, based on body composition analysis, combined with measurements of specific muscles to target clinical questions.Acknowledgements
Research nurses Åsa Rydmark Kersley and Linda Shosholli who supported the study and supplied the meta-data. This study was supported by grants from The Swedish Research Council (ID: 2014-2781), Region Östergötland, Sweden, LIST.References
1. Dixon WT. Simple proton spectroscopic imaging. Radiology. 1984;153(1):189-94.
2. Yu H, Shimakawa A, McKenzie CA, Brodsky E, Brittain JH, Reeder SB. Multiecho water-fat separation and simultaneous R2* estimation with multifrequency fat spectrum modeling. Magn Reson Med. 2008;60(5):1122-34.
3. Hamilton G, Yokoo T, Bydder M, Cruite I, Schroeder ME, Sirlin CB, et al. In vivo characterization of the liver fat (1)H MR spectrum. NMR in biomedicine. 2011;24(7):784-90.
4. Karlsson A, Rosander J, Romu T, Tallberg J, Gronqvist A, Borga M, et al. Automatic and quantitative assessment of regional muscle volume by multi-atlas segmentation using whole-body water-fat MRI. Journal of magnetic resonance imaging : JMRI. 2014.
5. Borga M, Thomas LE, Romu T, Rosander J, Fitzpatrick JA, Leinhard OD, et al. Validation of a fast method for quantification of intra-abdominal and subcutaneous adipose tissue for large scale human studies. NMR in biomedicine. 2015;28(12):1747-53.
6. West J, Dahlqvist Leinhard O, Romu T, Collins R, Garratt S, Bell JD, et al. Feasibility of MR-Based Body Composition Analysis in Large Scale Population Studies. PloS one. 2016;11(9):e0163332.
Figures