1577
Disease progression in skeletal muscles of Myotonic Dystrophy Type 1 evaluated using quantitative MRI1Radiology and Nuclear Medicine, Radboud university medical center, Nijmegen, Netherlands, 2Neurology, Radboud university medical center, Nijmegen, Netherlands, 3Neuromuscular Reference Center, Henri Mondor university hospital, Paris, France
Synopsis
We studied the occurrence and progression of fatty infiltration, atrophy and edema-like processes in calf and thigh muscles of Myotonic Dystrophy Type 1 (DM1) patients. Fat fraction (FF) and muscle volume (MV) were obtained by a DIXON-sequence and T2 of muscle water (T2water) was calculated by a bi-component extended-phase-graph model. Calf and thigh muscles show fatty infiltration and increased T2water in non-fat infiltrated and fat infiltrated muscles. Atrophy is observed in four calf muscles and one thigh muscles. FF significantly increases in 10 months in fat infiltrated and non-fat infiltrated muscles, but MV only decreases in fat infiltrated thigh muscles.
Purpose
MRI evaluation of muscles in patients with muscular dystrophy reveals fatty infiltration, atrophy and edema-like processes.1-4 In many muscular dystrophies, evaluation with quantitative MRI was extremely valuable in understanding these disease processes.2,5,6 Moreover, the evaluation of disease progression by quantitative MRI has been demonstrated to be very useful in assessing the effects of therapeutic interventions.7,8 However, in Myotonic Dystrophy Type 1 (DM1) mostly semi-quantitative MR analyses have been performed and none of them were longitudinal.3,9,10 Therefore, we investigated the occurrence and progression of fatty infiltration, atrophy and edema-like processes in muscles of DM1 patients by quantitative MR.Methods
Subjects:
We included 32 patients with DM1 (18 male, age: 45.3±12.5 years, MIRS score11: 1-5) of which 13 patients underwent a follow-up MRI at 10.1±1 months (7 male, age 45.2±3.4 years, MIRS score: 2-5). Furthermore, 10 age-matched healthy volunteers were included (5 male, age 44.1±14.3 years).
MR protocol: Subjects were examined using a 3T MR system (Siemens) and a spine/phased array coil combination placed around the lower extremity. A fat fraction map was acquired via a 2pt-DIXON (TR/TE1/TE2: 10/2.45/3.675ms, FA: 3°, voxel size: 1x1x5mm, slices: 32) or 3pt-DIXON (TE1/TE2/TE3: 2.31/3.68/5.07ms). To quantify edema-like processes multi spin-echo (MSE) images were acquired (TR: 3720ms, number of echoes (ETL): 17, echo-spacing (ES): 8ms, voxel size: 1.5x1.5x10mm, slice gap: 20mm, slices: 5).
Data analysis: Muscle water T2 relaxation (T2water) was mapped by voxel-wise fitting the MSE data using a bi-component extended phase graph (EPG) model12:
$$$SI(TE)=A\times FF_{EPG}\times EPG(T1_{fat},T2_{fat},ES,B1,\alpha_{1},...\alpha_{ETL})+A\times (1-FF_{EPG})\times EPG(T1_{water},T2_{water},ES,B1,\alpha_{1},...\alpha_{ETL})$$$
with T1water=1400ms, T1fat=365ms and α the refocusing angle. T2fat was determined per patient by a mono-component EPG model on subcutaneous fat. Since sufficient water signal is needed to obtain a reliable T2water, voxels with FFEPG>50% were excluded for further T2water analysis.
Regions of interests were drawn around calf and thigh muscles on 15 slices of the DIXON and the 5 slices of the DIXON corresponding to the T2water map. The average fat fraction (FFDIXON), T2water and muscle volume (MV) were determined for each muscle. The change in FFDIXON (ΔFFDIXON) and percentage change in MV (ΔMV) from baseline to follow-up were calculated and normalized to one year. Muscles were divided in two subgroups: non-fat infiltrated muscles (muscles_noFat, FFDIXON<10%) and fat infiltrated muscles (muscles_withFat, FFDIXON>10%).
Statistics: Kruskal-Wallis test with Dunns correction and Mann-Whitney test without correction for multiple testing were used to compare FFDIXON, T2water and MV between DM1 and healthy volunteers. FFDIXON between muscles was compared using Friedman’s ANOVA. A one-sampled t-test was used to test if ΔFF and ΔMV differed significantly from zero.
Results
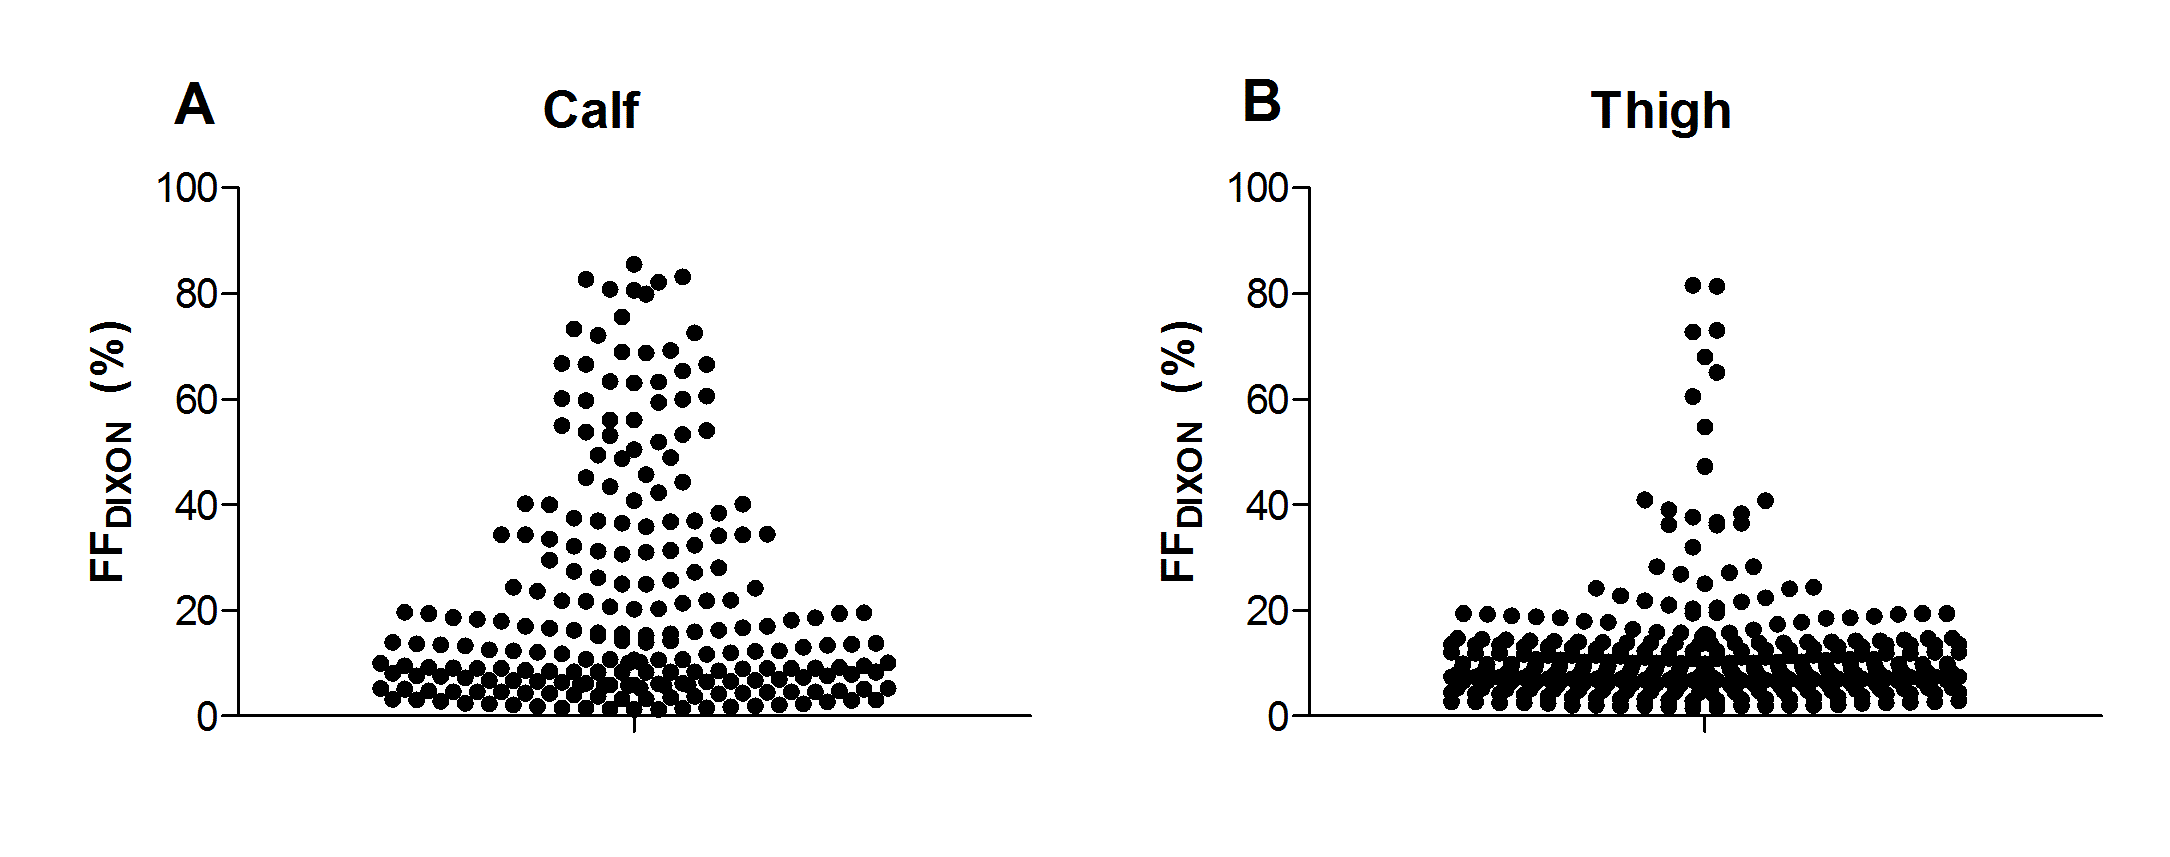
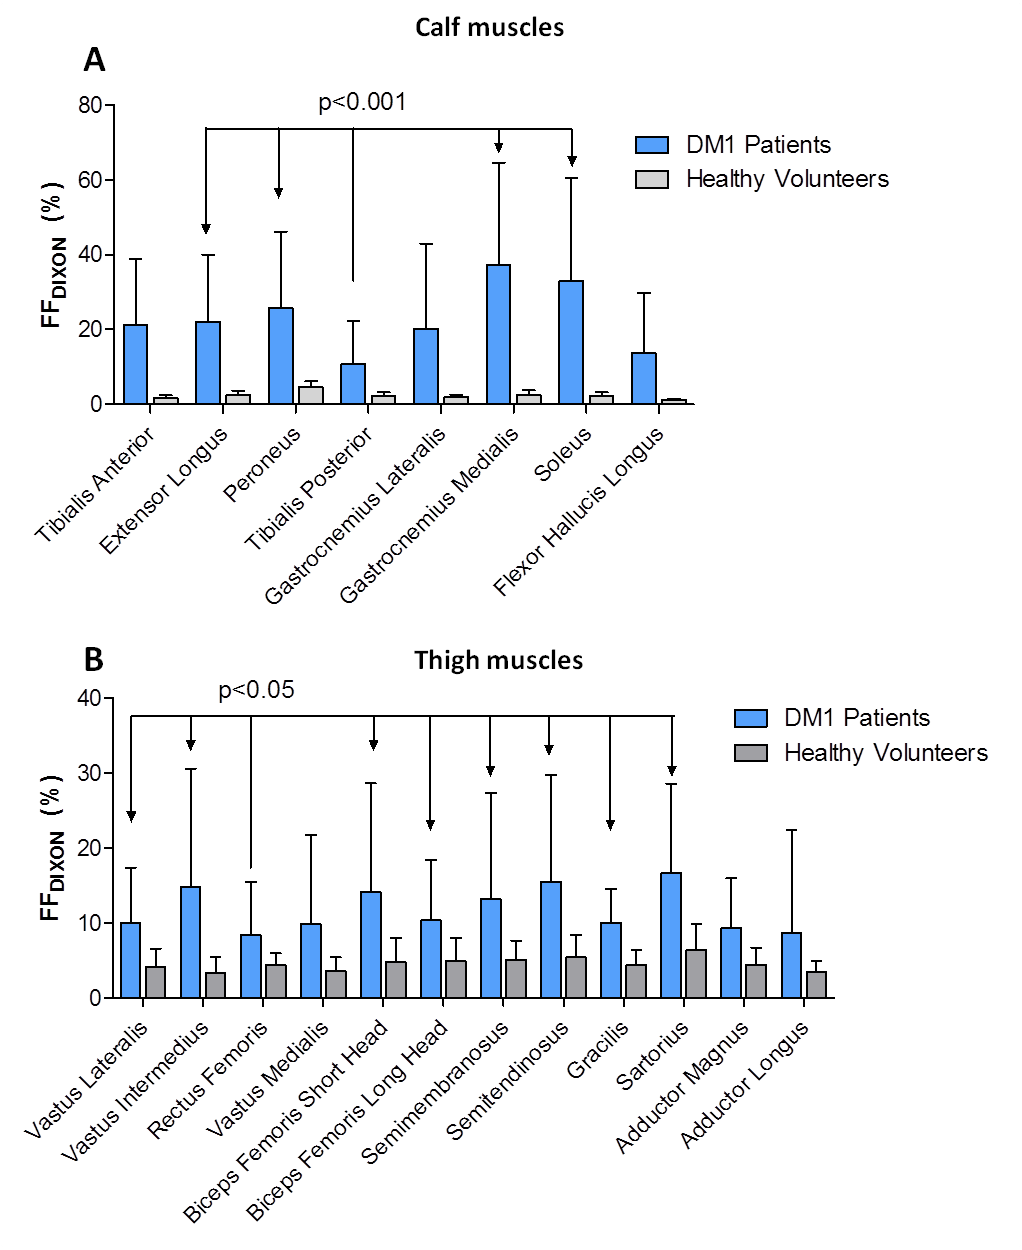
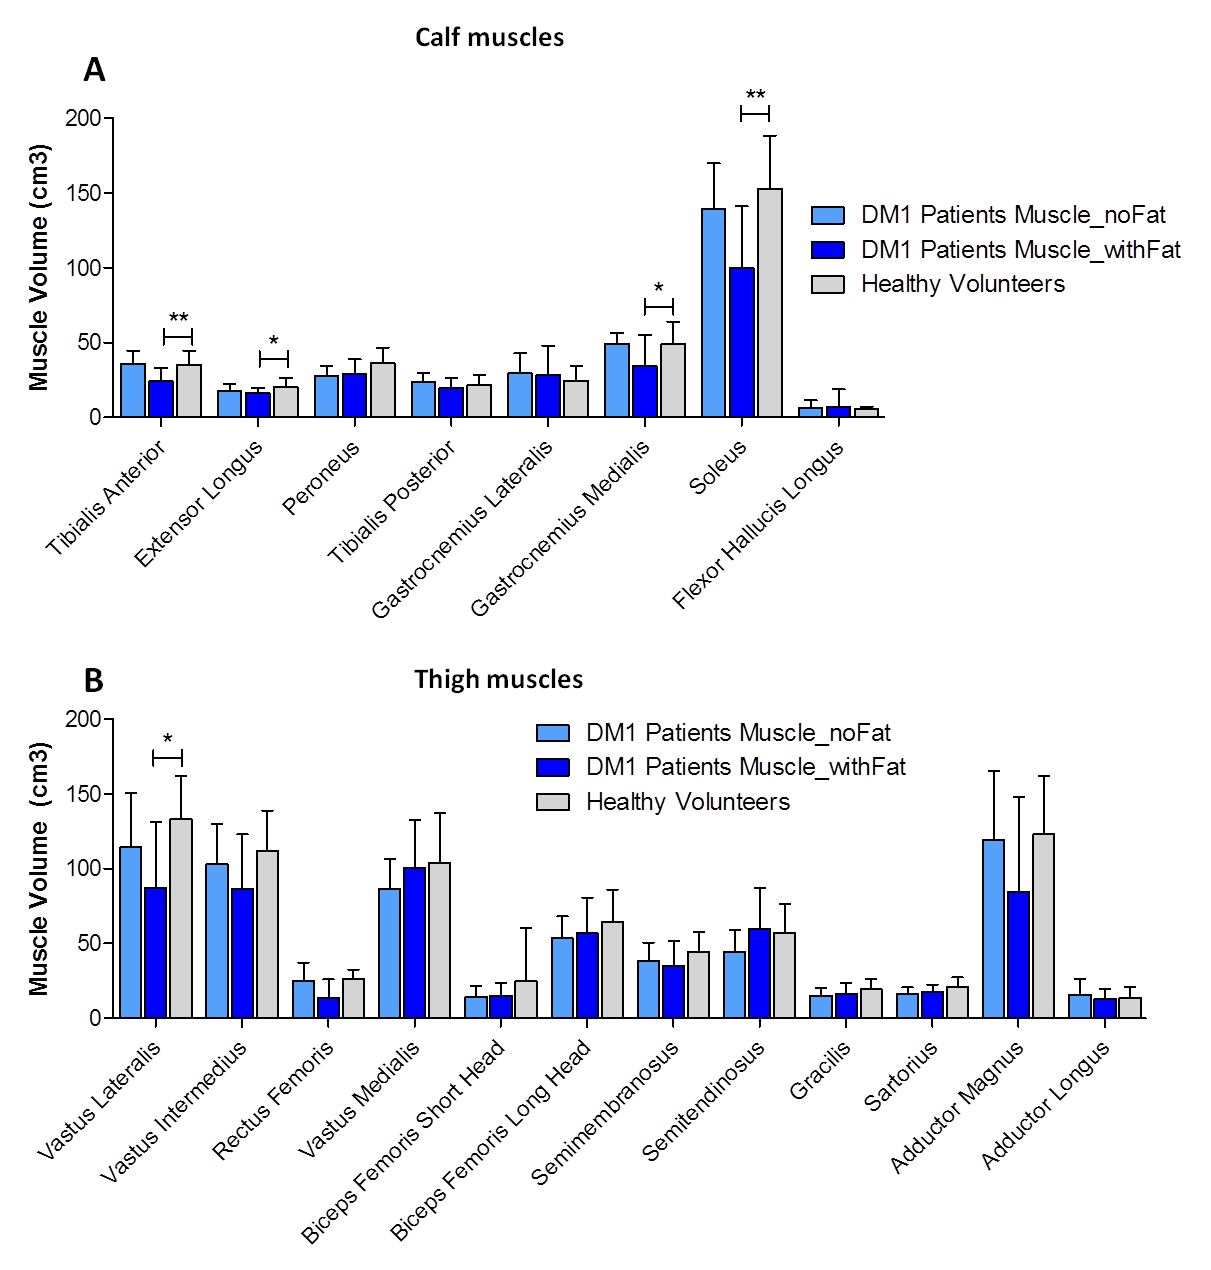
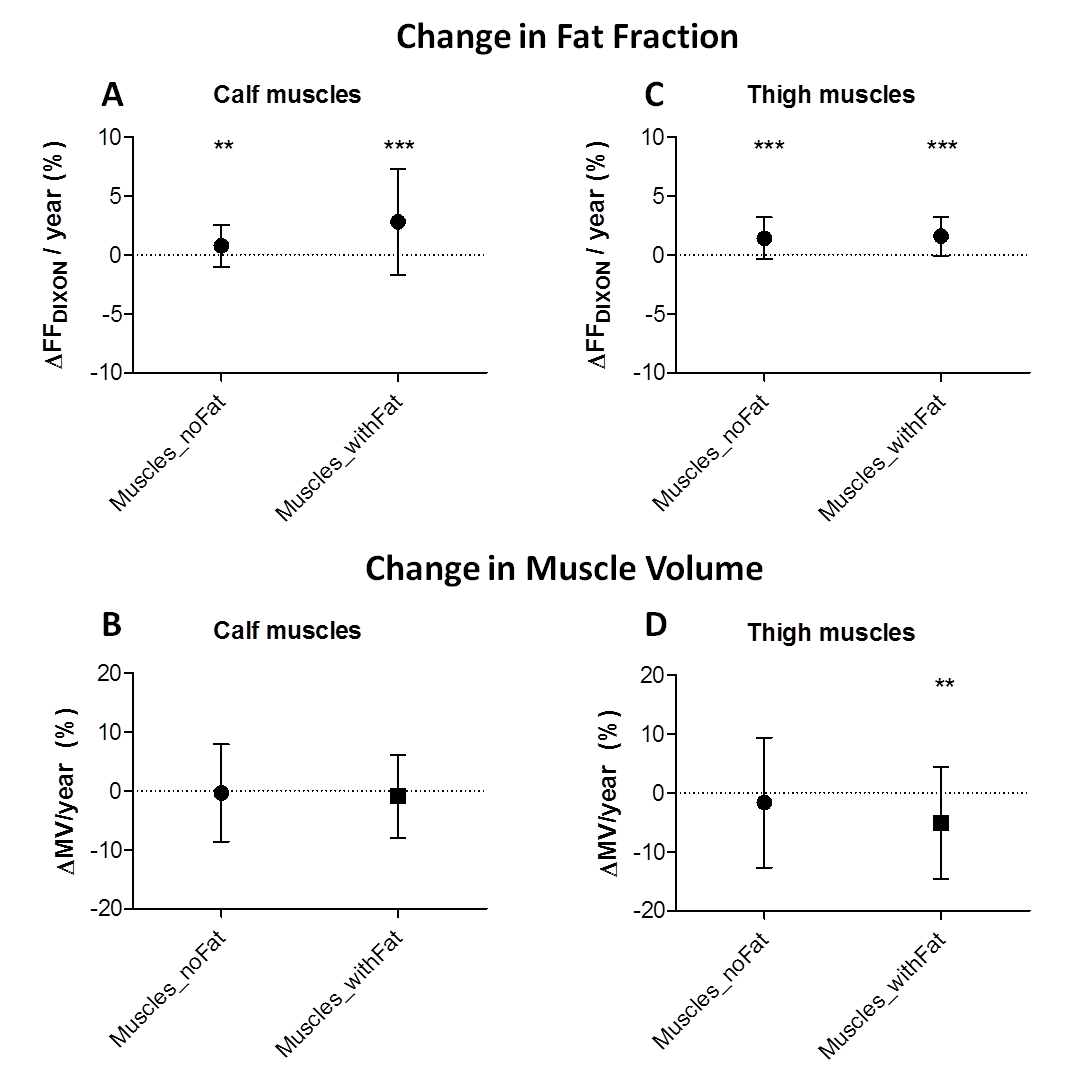
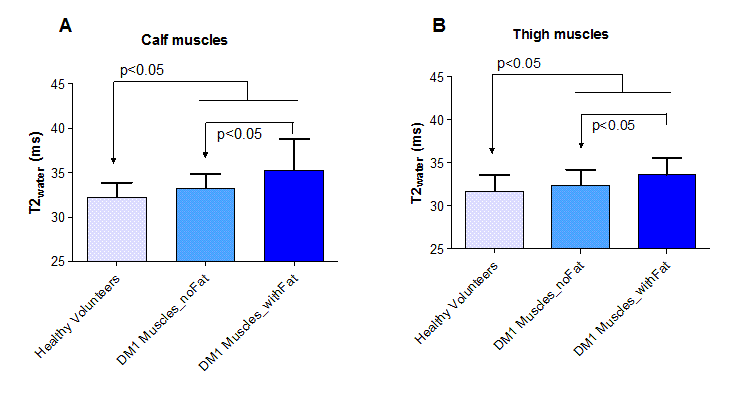
The FFDIXON distribution plot of the calf and thigh muscles of the 32 DM1 patients has a pyramid shape and shows higher FFDIXON in calf than thigh muscles (Fig.1). In DM1, average FFDIXON is significantly increased in all investigated muscles, except for the rectus femoris and adductor magnus/longus. The extensor longus, peroneus, gastrocnemius medialis, and soleus have a significantly higher FFDIXON compared to the tibialis posterior (Fig.2A). All thigh muscles, except for the vastus medialis and adductor magnus/longus, have a significantly higher FFDIXON compared to the rectus femoris (Fig.2B). MV is significantly reduced in the tibialis anterior, extensor longus, gastrocnemius medialis, soleus, and the vastus lateralis in Muscles_withFat in DM1 compared to healthy volunteers (Fig.3). After 10 months, the FFDIXON is significantly increased (ΔFFDIXON>0) in the calf and thigh muscles (Fig.4A/B). ΔMV is significantly <0 in muscles_withFat in the thigh, while no decrease in MV is observed in the calf muscles (Fig.4C/D). In both calf and thigh muscles, T2water is significantly increased in muscles_withFat, compared to muscles_noFat and both are significantly higher compared to healthy volunteers (Fig.5).Discussion
In this natural history study, we evaluated the disease progression in muscles of DM1 patients by quantitative MRI. Both calf and thigh muscles show fatty infiltration and increased T2water. In muscles with ongoing fatty infiltration, T2water is the highest, but it is also increased in muscles without fat infiltration. In fat infiltrated muscles, FFDIXON increases with 2.8%/year and 1.6%/year in the calf and thigh muscles, respectively. This is comparable to LGMD2I and lower than in FSHD and DMD, where respectively a change of 1-4%/year, 7%/year and 3-7%/year was observed.2,8,13-15 Atrophy is observed in four of the calf muscles and one of the thigh muscles. In accordance with previous semi-quantitative studies, the gastrocnemius medialis, soleus and vastii are predominantly affected by fatty infiltration and atrophy.3,9,10 In contrast to these studies, our study shows that the hamstrings are also prone to be affected, while the vastus medialis is spared.Acknowledgements
This work was supported by the EU Seventh Framework Programme (#305697) on DM1 (OPTIMISTIC).References
1. McNally EM, Pytel P. Muscle diseases: the muscular dystrophies. Annual review of pathology 2007;2:87-109.
2. Janssen BH, Voet NB, Nabuurs CI, Kan HE, de Rooy JW, Geurts AC, et al. Distinct disease phases in muscles of facioscapulohumeral dystrophy patients identified by MR detected fat infiltration. PloS one 2014;9(1):e85416.
3. Kornblum C, Lutterbey G, Bogdanow M, Kesper K, Schild H, Schroder R, et al. Distinct neuromuscular phenotypes in myotonic dystrophy types 1 and 2 : a whole body highfield MRI study. Journal of neurology 2006;253(6):753-61.
4. Wokke BH, Van Den Bergen JC, Hooijmans MT, Verschuuren JJ, Niks EH, Kan HE. T2 relaxation times are increased in Skeletal muscle of DMD but not BMD patients. Muscle & nerve 2016;53(1):38-43.
5. Kan HE, Scheenen TW, Wohlgemuth M, Klomp DW, van Loosbroek-Wagenmans I, Padberg GW, et al. Quantitative MR imaging of individual muscle involvement in facioscapulohumeral muscular dystrophy. Neuromuscular disorders : NMD 2009;19(5):357-62.
6. Wokke BH, van den Bergen JC, Versluis MJ, Niks EH, Milles J, Webb AG, et al. Quantitative MRI and strength measurements in the assessment of muscle quality in Duchenne muscular dystrophy. Neuromuscular disorders : NMD 2014;24(5):409-16.
7. Janssen B, Voet N, Geurts A, van Engelen B, Heerschap A. Quantitative MRI reveals decelerated fatty infiltration in muscles of active FSHD patients. Neurology 2016;86(18):1700-7.
8. Arpan I, Willcocks RJ, Forbes SC, Finkel RS, Lott DJ, Rooney WD, et al. Examination of effects of corticosteroids on skeletal muscles of boys with DMD using MRI and MRS. Neurology 2014;83(11):974-80.
9. Damian MS, Bachmann G, Herrmann D, Dorndorf W. Magnetic resonance imaging of muscle and brain in myotonic dystrophy. Journal of neurology 1993;240(1):8-12.
10. Stramare R, Beltrame V, Dal Borgo R, Gallimberti L, Frigo AC, Pegoraro E, et al. MRI in the assessment of muscular pathology: a comparison between limb-girdle muscular dystrophies, hyaline body myopathies and myotonic dystrophies. La Radiologia medica 2010;115(4):585-99.
11. Mathieu J, Boivin H, Meunier D, Gaudreault M, Begin P. Assessment of a disease-specific muscular impairment rating scale in myotonic dystrophy. Neurology 2001;56(3):336-40.
12. Marty B, Baudin PY, Reyngoudt H, Azzabou N, Araujo EC, Carlier PG, et al. Simultaneous muscle water T2 and fat fraction mapping using transverse relaxometry with stimulated echo compensation. NMR in biomedicine 2016;29(4):431-43.
13. Fischmann A, Hafner P, Fasler S, Gloor M, Bieri O, Studler U, et al. Quantitative MRI can detect subclinical disease progression in muscular dystrophy. Journal of neurology 2012;259(8):1648-54.
14. Willcocks RJ, Rooney WD, Triplett WT, Forbes SC, Lott DJ, Senesac CR, et al. Multicenter prospective longitudinal study of magnetic resonance biomarkers in a large duchenne muscular dystrophy cohort. Annals of neurology 2016;79(4):535-47.
15. Willis TA, Hollingsworth KG, Coombs A, Sveen ML, Andersen S, Stojkovic T, et al. Quantitative muscle MRI as an assessment tool for monitoring disease progression in LGMD2I: a multicentre longitudinal study. PloS one 2013;8(8):e70993.
Figures