1572
Correlating MRI and Histological Parameters in GRMD Muscles: A Comparison Between 3T and 4.7T Acquisitions1Department of Electrical and Computer Engineering, Texas A&M University, College Station, TX, United States, 2Department of Veterinary Pathobiology, Texas A&M University, College Station, TX, United States, 3Small Animal Imaging and Radiology, Texas A&M University, College Station, TX, United States, 4Department of Large Animal Clinical Sciences, Texas A&M University, College Station, TX, United States, 5Department of Veterinary Integrative Biosciences, Texas A&M University, College Station, TX, United States
Synopsis
The relationship between localized histological truth and various MRI quantitative measures were investigated using canine models. In this study, GRMD pectineus muscle samples were imaged on a 3T clinical scanner and a 4.7T small-bore scanner. Trichrome stained histology slice was registered to the 3D MRI volume. Localized quantitative MRI parameters are correlated with histology analysis (muscle, fibrosis and interstitial tissue percentage). Parameters derived from the 4.7T MRI data show consistent correlations, while those from 3T MRI data do not show consistent correlation.
Purpose
In order to identify quantitative MRI biomarkers for GRMD disease, ground-truth histology images and quantitative MRI parameters were registered. In this study, we aimed to investigate and evaluate the relationship between histological tissue components and various quantitative MRI parameters (T1, T2, WF, FF, FA, TrD, and ADC) acquired on both 3T and 4.7T scanners. The objective is to evaluate whether the 3T clinical scanner can provide sufficient image quality for assessing small pectineus canine muscles for GRMD.Methods
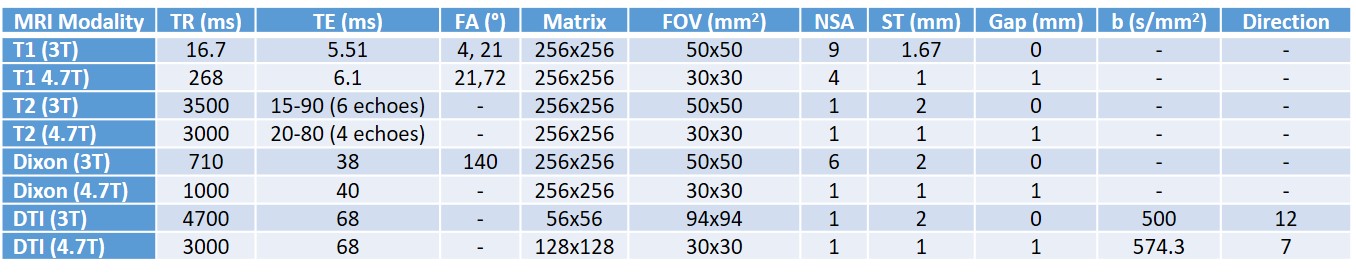
GRMD pectineus muscle samples were placed in 100ml centrifuge tubes filled with agarose gel to prevent any motion artifact. MRI imaging of the specimens were acquired on a clinical 3T Siemens Verio system and a 4.7T 40-cm bore Varian Bruker scanner. A quadrature bird-cage coil is used on the 4.7T acquisition and a surface coil is used on the 3T acquisition due to its superior SNR and small size of the muscle samples. The imaging parameters are shown in Table 1. On the 3T data, T1 map, T2 map, Dixon (water/fat) images, and DTI parameters (FA, TrD, and ADC) are provided by the scanner. After acquisition, T2-wighted, Dixon and DTI images were registered to T1-weighted images. All data from the 4.7T were processed offline. A non-local means filter was applied to all MRI images before quantitative parameter images were calculated1. Despot1 approach with dual-flip angles was used to calculate T1 maps2. T2 maps were computed using a linear fitting approach for the conventional spin echo images at 4 different echo times (20, 40, 60, 80ms). Water and Fat images were acquired using a 3-point Dixon method3. DTI parameters were calculated using Camino diffusion toolkit4 with weighted least squares algorithm. Water fraction (WF) and fat fraction (FF) values were calculated using the approach described in 5. After MRI imaging, muscle samples were sectioned at the middle and one 5-µm trichrome stained histology slice was generated per sample at 0.23 µm in-plane resolution. Trichrome images were segmented to determine composition of tissues (percentage of muscle, fibrosis, interstitial) with an in-house developed algorithm. Afterwards, histology images were registered to MRI volumes using the method described in 6. After registration, segmented histology images and MRI quantitative images were re-sampled to 0.39mm × 0.39mm resolution for the 3T data, and 0.24mm × 0.24mm resolution for the 4.7T data. The correlation is calculated by
$$\rho\left(m,h\right)=\frac{\tt E \it \left[\left(m-\mu_{m}\right)\left(h-\mu_{h}\right)\right]}{\sigma_{m}\sigma_{h}}$$
where m denotes the calculated MR parameter and h denotes the tissue composition based on histology, µ and σ denote mean and standard deviation, respectively.
Results
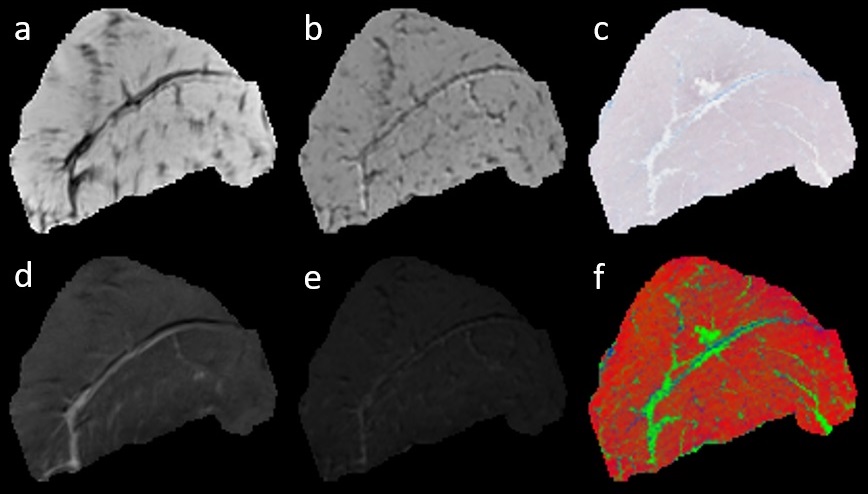
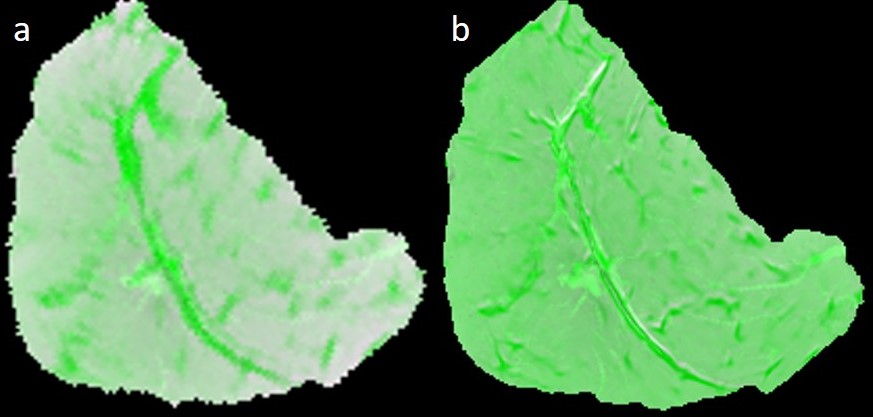
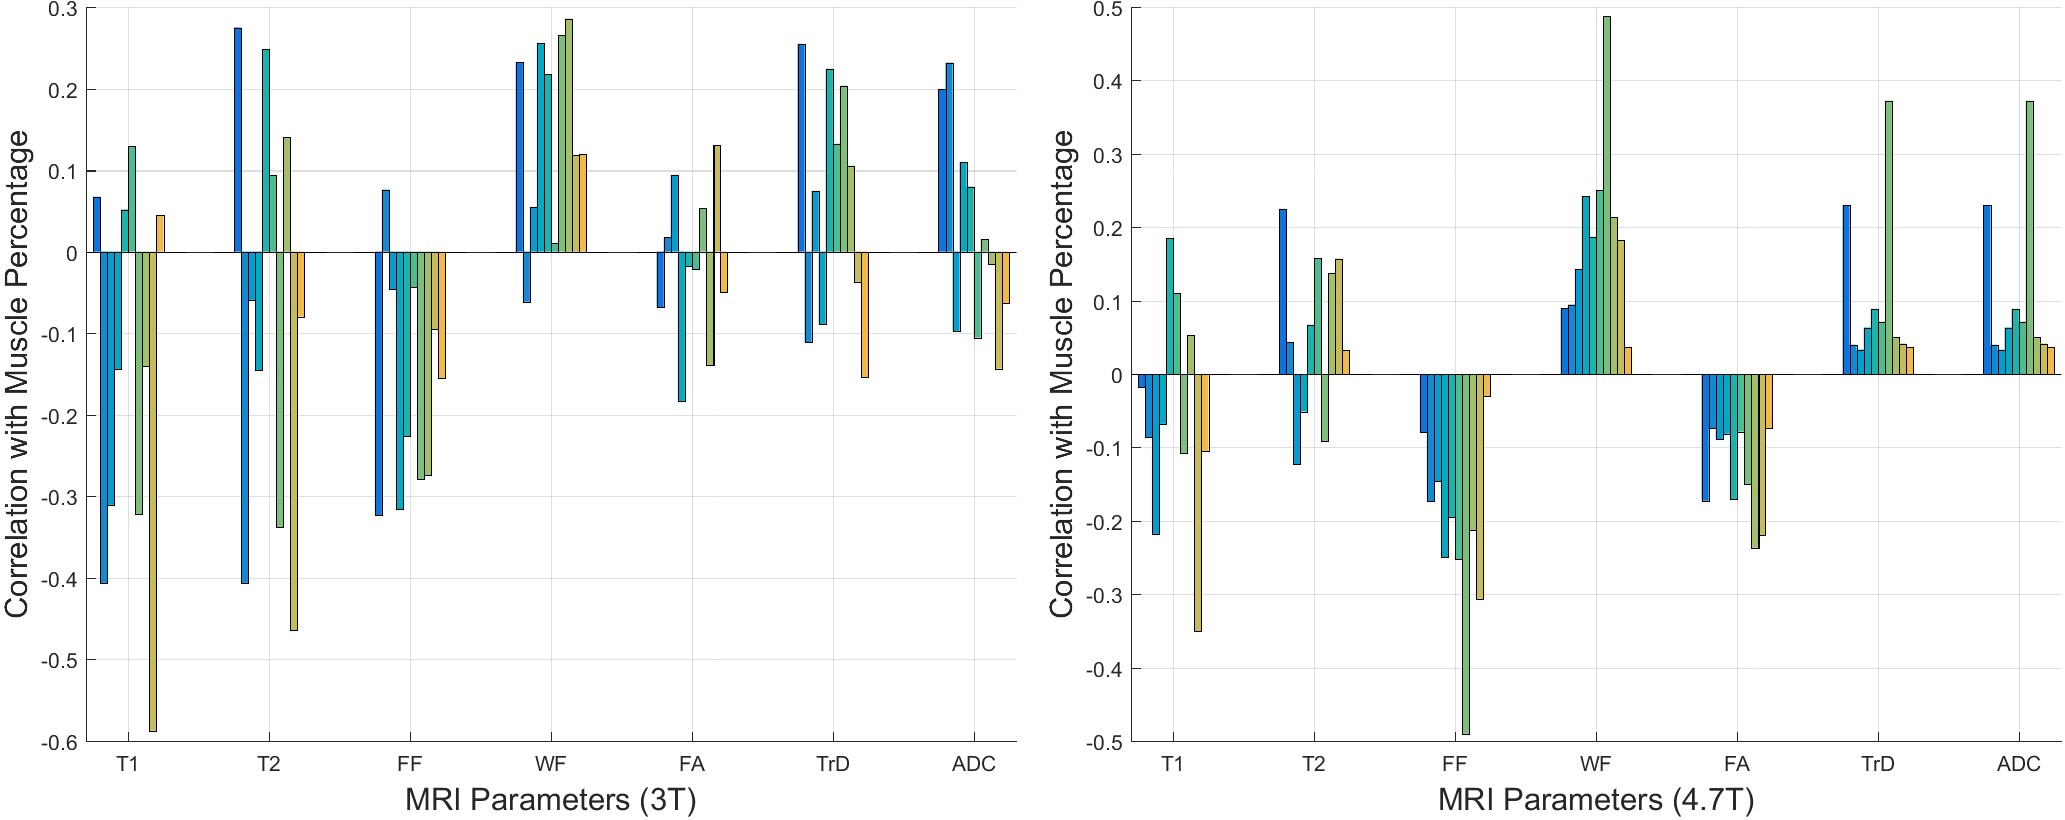
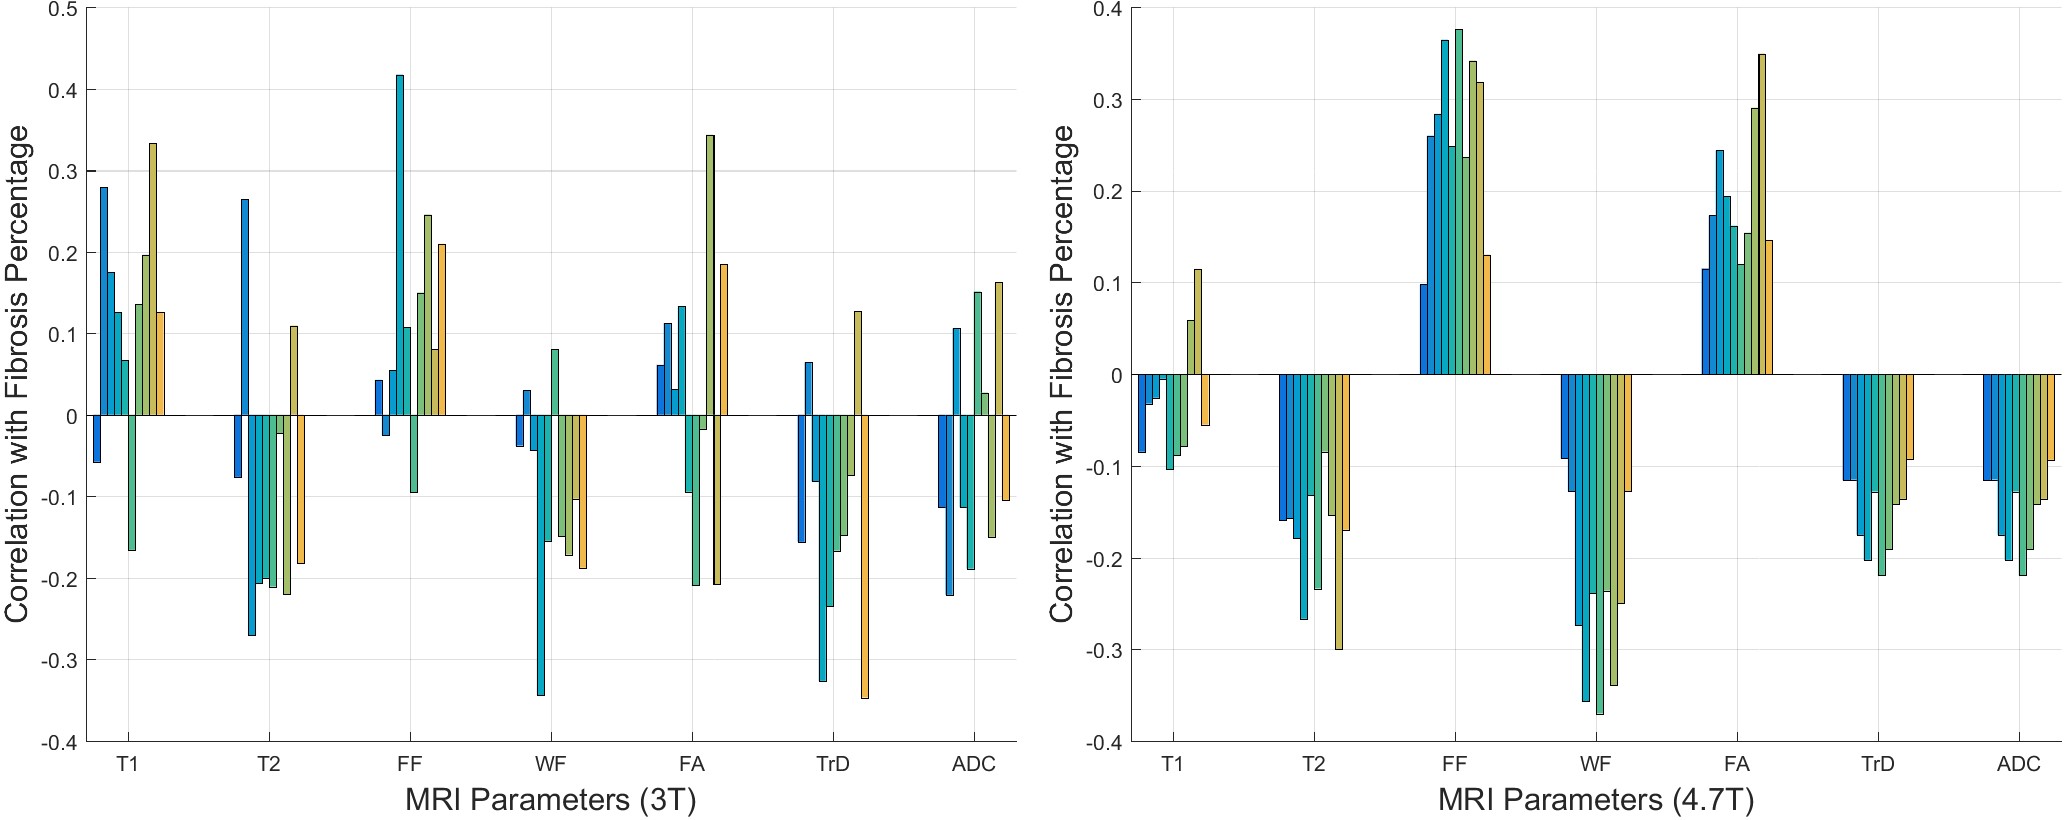
Figure 1 shows a set of MRI and histology images. Figure 2 shows a representative sample of registered MRI and histology slice. The fused images are shown in pseudo color. As shown, MR images are registered to histology images sufficiently to examine correlation. Figure 3 shows the correlation between muscle tissue percentage and MRI parameters. MRI quantitative parameters (FF, WF, FA, TrD, and ADC) from the 4.7T dataset correlate consistently with muscle percentages per samples. FF and FA parameters show negative correlation which can be explained with alteration of muscle cells with fat/fibrosis tissues. Positive correlation of WF and ADC values can be explained with increased water context in the muscle cells. However, quantitative MRI parameters from the 3T datasets do not show consistent correlation for all samples except the WF. Figure 4 is the same as Figure 3 except that the correlation is between MRI and fibrosis component percentage.
As shown, all quantitative MRI parameters obtained from the 4.7T data (except T1maps) show a significant correlation with fibrosis tissue percentage. Positive correlation of FF and WF values can be explained with increasing fibrosis cells along the fat cells. Similarly, negative correlation of ADC values can be interpreted based on decreasing water content with muscle cells. However, on the 3T data, fibrosis tissue percentage do not show coherent correlation for all samples.
Conclusion
On the 4.7T small bore scanner, consistent correlations between muscle percentage derived from histology and WF, FF, FA, TrD, ADC are observed. Fibrosis percentage from histology and T2, WF, FF, FA, TrD, ADC parameters are also observed. Results show that the increased fibrosis percentage is correlated with increasing FF and FA values. Increase of muscle percentage has the opposite effect on FF and FA values. However, MRI parameters acquired on the 3T clinical scanner do not show coherent correlation with neither muscle percentage nor fibrosis percentages. This may be caused by lower SNR and also lower resolution at 3T.Acknowledgements
The authors thank to Dr John Bosshard, and Dr Steve M. Wright and Magnetic Resonance Imaging Laboratory in Texas A&M University. A. Eresen thanks to Turkish Ministry of National Education for partial support.References
1. Buades A, Coll B, Morel J-M. A non-local algorithm for image denoising. Proc of the 2005 IEEE Comp Soc Conf on Comp Vis and Pattern Recog. 2005; San Diego, USA.
2.Deoni SCL, Rutt BK, Peters TM. Rapid combined T1 and T2 mapping using gradient recalled acquisition in the steady state. Mag Res in Med. 2003; 49:515-526.
3. Glover GH, Schneider E. Three-point dixon technique for true water/fat decomposition with B0 inhomogeneity correction. Mag Res in Med. 1991; 18:371-383.
4. Cook PA, Bai Y, Nedjati-Gilani S, Seunarine KK, Hall MG, Parker GJ, Alexander DC. Camino: Open-Source Diffusion-MRI Reconstruction and Processing. 14th Sci Meeting of the Int Soc for Mag Res in Med. Seattle, WA, USA; 2759, 2006.
5. Reeder SB, Hines CD, Yu H, McKenzie CA, Brittain JH. On The Definition of Fat-Fraction for In Vivo Fat Quantification with Magnetic Resonance Imaging. Proc of Int Soc for Mag Res in Med; 2009.
6. Eresen A, McConnel S, Ji JX, Birch S, Kornegay S. MRI As a Diagnostic Imaging Alternative for DMD Therapeutic Assessments. 38th Ann Int Conf of the IEEE Eng in Med and Bio Soc; Orlando, FL, USA: IEEE; 2016.
Figures