1571
Changes in muscle morphometry, composition and performance in patients with sporadic inclusion body myositis1Novartis Institutes for Biomedical Research, Basel, Switzerland, 2VirtualScopics, LLC, Rochester, NY, United States, 3MRC Centre for Neuromuscular Diseases, UCL Institute of Neurology, London, United Kingdom, 4Novartis Pharmaceuticals Corporation, East Hanover, NJ, United States, 5Novartis Pharma AG, Basel, Switzerland
Synopsis
A comprehensive MRI approach was used to characterize changes in muscle structure and composition in patients with sporadic inclusion body myositis (sIBM) over 1-year. Results showed progressive deterioration in muscle quality, e.g. increased connective tissue volume in the most affected muscles, and this appeared to be associated with a functional impact.
Introduction
sIBM is a rare, progressive and asymmetric muscle disorder, which causes severe disability. Although the etiology of sIBM is unknown, muscle biopsies show inflammatory and degenerative components. As new therapies are being developed, it is critical to monitor patients for the pure-muscle anabolic response and potential changes in muscle composition. As an alternative to serial biopsies, MRI appears to be well suited to quantify pathology such as muscle fat infiltration by the 3-point Dixon method1, muscle edema from fat-corrected T2 maps2, macromolecular structure of muscle cells implied by the magnetization transfer ratio (MTR)3 and muscle connective tissue from T2* values4. These markers have potential utility as objective endpoints (biomarkers) to describe disease-modifying effects of new drugs.
We show preliminary MRI results obtained from 13 patients with sIBM, describe changes in muscle structure and composition over one year, and correlations with functional status.
Methods
Thigh muscle volume (TMV), subcutaneous and inter/intramuscular adipose tissue (SAT and IMAT) volumes, relative fat fraction (%FF) in lean muscle, intra/intermuscular connective tissue (IMCT) and inflammation levels, were all assessed at 1.5T during a single imaging session. Proton density (PD)-MRI and Dixon acquisitions were performed for TMV, SAT, IMAT and %FF measurements. T2 (fat-saturated multi-echo spin-echo sequence), T2* (multi-echo gradient recalled echo sequence) and MTR (gradient echo series with and without magnetization transfer contrast) mapping sequences were acquired for muscle inflammation, IMCT and macromolecular assessments, respectively.
PD images were semi-automatically segmented into non-overlapping class maps representing muscle, SAT and IMAT. The average T2 relaxation time, percentage of voxels with T2* consistent with IMCT and IMAT, and average MTR were measured from cross-sections in the middle of the thigh. Fat fraction maps (%FF) were calculated from Dixon images as Fat/(Water+Fat). A segmentation map, performed on PD images, was then overlaid on the water-fat images to determine the average %FF in segmented muscle tissue. The correlation between changes in MRI endpoints and functional outcomes such as cumulative sIBM Physical Functioning Assessment (sIFA) scores, 6-minute walk distance (6MWD) and quantitative muscle testing (QMT) was also determined.
Results
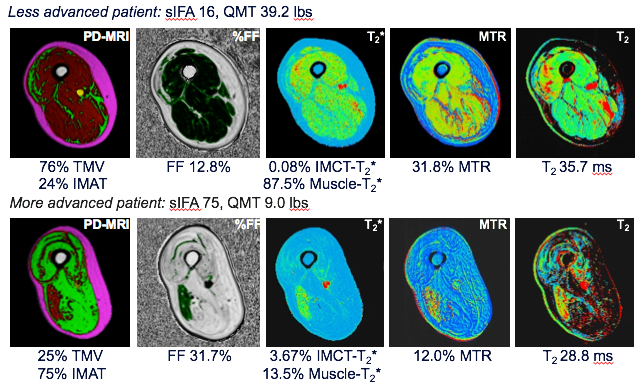
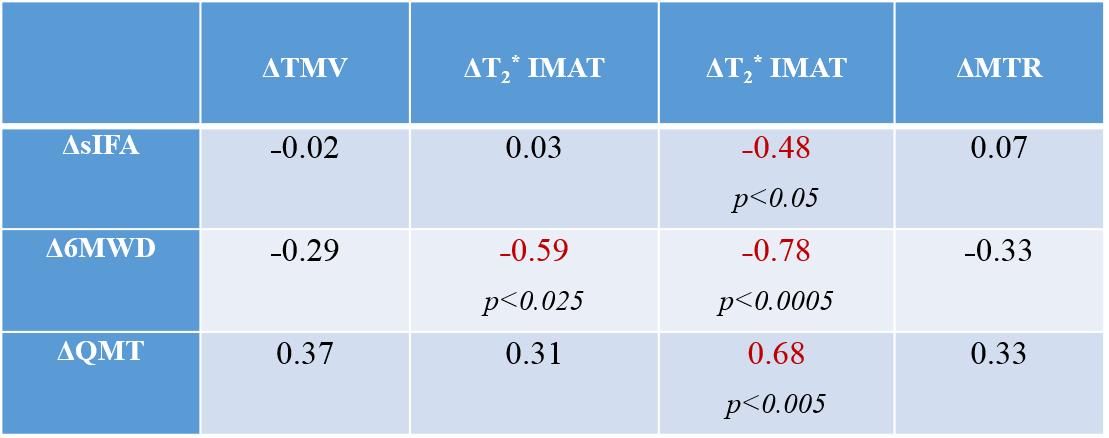
Thigh muscle ratio [TMV*100/(TMV+IMAT)] ranged from ~24% to ~75%, with an average of 55±17%, an indication of muscle atrophy in this group of sIBM patients vs normal healthy subjects (91±5%, N=47 parallel study). Figure 1 shows typical thigh images of two sIBM patients at different stages of their disease. Along with different degrees of muscle atrophy, clear disparities can be observed in terms of muscle fat infiltration (%FF), presence of connective tissue (T2*), and alteration in the macromolecular structure (MTR). Further analysis of the entire group at baseline demonstrated more edema (T2: 40±8 vs 32±5 ms, p<0.005) and specific alteration of macromolecular structure (MTR: 19.1±7.6 vs 24.5±10.2, p=0.06) in anterior thigh muscles, when compared to the posterior compartment. This is aligned with the clinical observation of greater involvement in the anterior thigh in sIBM. Although non-significant, several changes were observed after one year: 1) ~8% loss in TMV associated with an increase in IMAT, more so in the anterior (+24%) than in the posterior muscles (+7%, p=0.41), 2) no clear change in %FF values, 3) slightly less muscle edema across the whole leg (i.e. ~4% lower T2 values), 3) ~3-fold increase (p=0.13) in connective tissue in anterior muscles (IMCT-T2* voxels%: 0.4±0.7 at baseline vs 1.2±2.7 at 1-year), and 4) further alteration in the muscle macromolecular structure (MTR: 22.1±8.1 at baseline vs 19.9±6.3 at 1-year). Interestingly, an inverse correlation (r=-0.57, p<0.01) was observed between the slight decrease in muscle edema (T2) and new deposition of “marbling” fat (IMAT). Finally, the decrease in muscle performance seen over 1-year in these patients (-7% QMT and -10% 6MWD) was associated with a ~20% worsening of the physical function (sIFA). This functional impairment was correlated most strongly with deposition of connective tissue in thigh muscles (Table 1).Discussion
Besides the detection of loss of skeletal muscle and related fat deposition over time, this study showed that the increase in marbling fat (IMAT) is inversely correlated with muscle edema. This suggests that inflammation may play a role in triggering infiltration of fat into muscle, which is a typical characteristic of sIBM. Another key result of this study is the quantity of connective tissue which is nearly doubled over a year in the most affected muscles of the thigh (anterior muscles). To which extend this reflects development of fibrosis will require further studies; however, these changes appear to correlate well with concomitant functional decline observed over a year.Acknowledgements
No acknowledgement found.References
1. Wren TA, Bluml S, Tseng-Ong L, et al. Three-point technique of fat quantification of muscle tissue as a marker of disease progression in Duchenne muscular dystrophy: preliminary study. AJR. 2008;190(1):W8-W12
2. Yao L, Gai N. Fat-corrected T2 measurement as a marker of active muscle disease in inflammatory myopathy. AJR. 2012;198(5):W475-W81
3. Sinclair CD, Morrow JM, Miranda MA, et al. Skeletal muscle MRI magnetisation transfer ratio reflects clinical severity in peripheral neuropathies. J Neurol Neurosurg Psychiatry. 2012;83(1):29-32
4. Csapo R, Malis V, Sinha U, et al. Age-associated differences in triceps surae muscle composition and strength - an MRI-based cross-sectional comparison of contractile, adipose and connective tissue. BMC Musculoskelet Disord. 2014;15:209
Figures