1570
Multi-parametric characterization of highly fat infiltrated muscular dystrophy patients: results of a multi-variate analysis.1Department of Information Engineering, University of Padova, Padova, Italy, 2Neuroimaging Lab, Scientific Institute IRCCS Eugenio Medea, Bosisio Parini (LC), Italy, 3Functional Rehabilitation Unit, Neuromuscular Disorders, Scientific Institute IRCCS Eugenio Medea, Bosisio Parini (LC), Italy, 4Radiology Department, University Medical Center Utrecht, Utrecht, Netherlands
Synopsis
Limb Girdle Muscular Dystrophies (LGMD) are a family of myopathies characterized by progressive degeneration and fat infiltration of muscular tissue. In the context of a study that includes Dixon, T2 quantification and diffusion MRI (dMRI), we investigated a multi-variate analysis to remove the effect of fat from concurrent measures and correlate them with clinical indexes of strength. In our dataset of highly infiltrated patients, T2 and dMRI metrics were strongly biased by fat. Our results show that it is possible to mitigate the bias by multi-variate modeling of the FF effect while retaining disease specific effects.
Purpose
Limb Girdle Muscular Dystrophies (LGMD) are a family of myopathies characterized by progressive degeneration and fat infiltration of muscular tissue. In the context of a study that includes Dixon, T2 quantification and diffusion MRI (dMRI), we aim to remove the effect of fat from concurrent measures and correlate them with clinical indexes of strength.Methods
11 healthy controls (HC, 5 males, 45±10 years), 7 patients affected by LGMD2A (Calpain deficit, 2 males, 39±7 years) and 7 patients affected by LGMD2B (Dysferlin deficit, 3 males, 48±7 years) underwent 3T MRI of the thigh. The MRI sessions included a 15 echoes spin-echo sequence for T2 quantification (resolution 1.7x1.7x5mm3, TE/δTE=9.3/12.5ms), a 12 echoes Dixon acquisition (resolution 1x1x5mm3, TE/δTE=2.7/1.2ms) and a multi-shell dMRI scan (TE/TR=42/7000ms, resolution 1.5x1.5x6mm3, 5 b=0s/mm2, 16 directions at b=250,400s/mm2).
T2 was quantified voxel-wise with a mono-exponential model, then moved along with Dixon fat fraction (FF) maps to the corresponding dMRI space of each subject. The transformations were performed using an affine/b-spline transformation[1]. The Dixon water signal image was registered to the first b=0s/mm2, then the transformation was concatenated with the registration of the 6th T2 sequence echo to the Dixon fat signal image. Quantification of dMRI data was performed with Camino[2] using RESTORE[3] on the two-shell dMRI data to minimize IVIM effects[4]. Regions of Interest (ROIs) of the Posterior Muscles (PM), Anterior Muscles (AM), Gracilis (GR) and Sartorius (SR) were manually delineated on the Dixon of each subject, then median values of the metrics were computed for each ROI and subject.
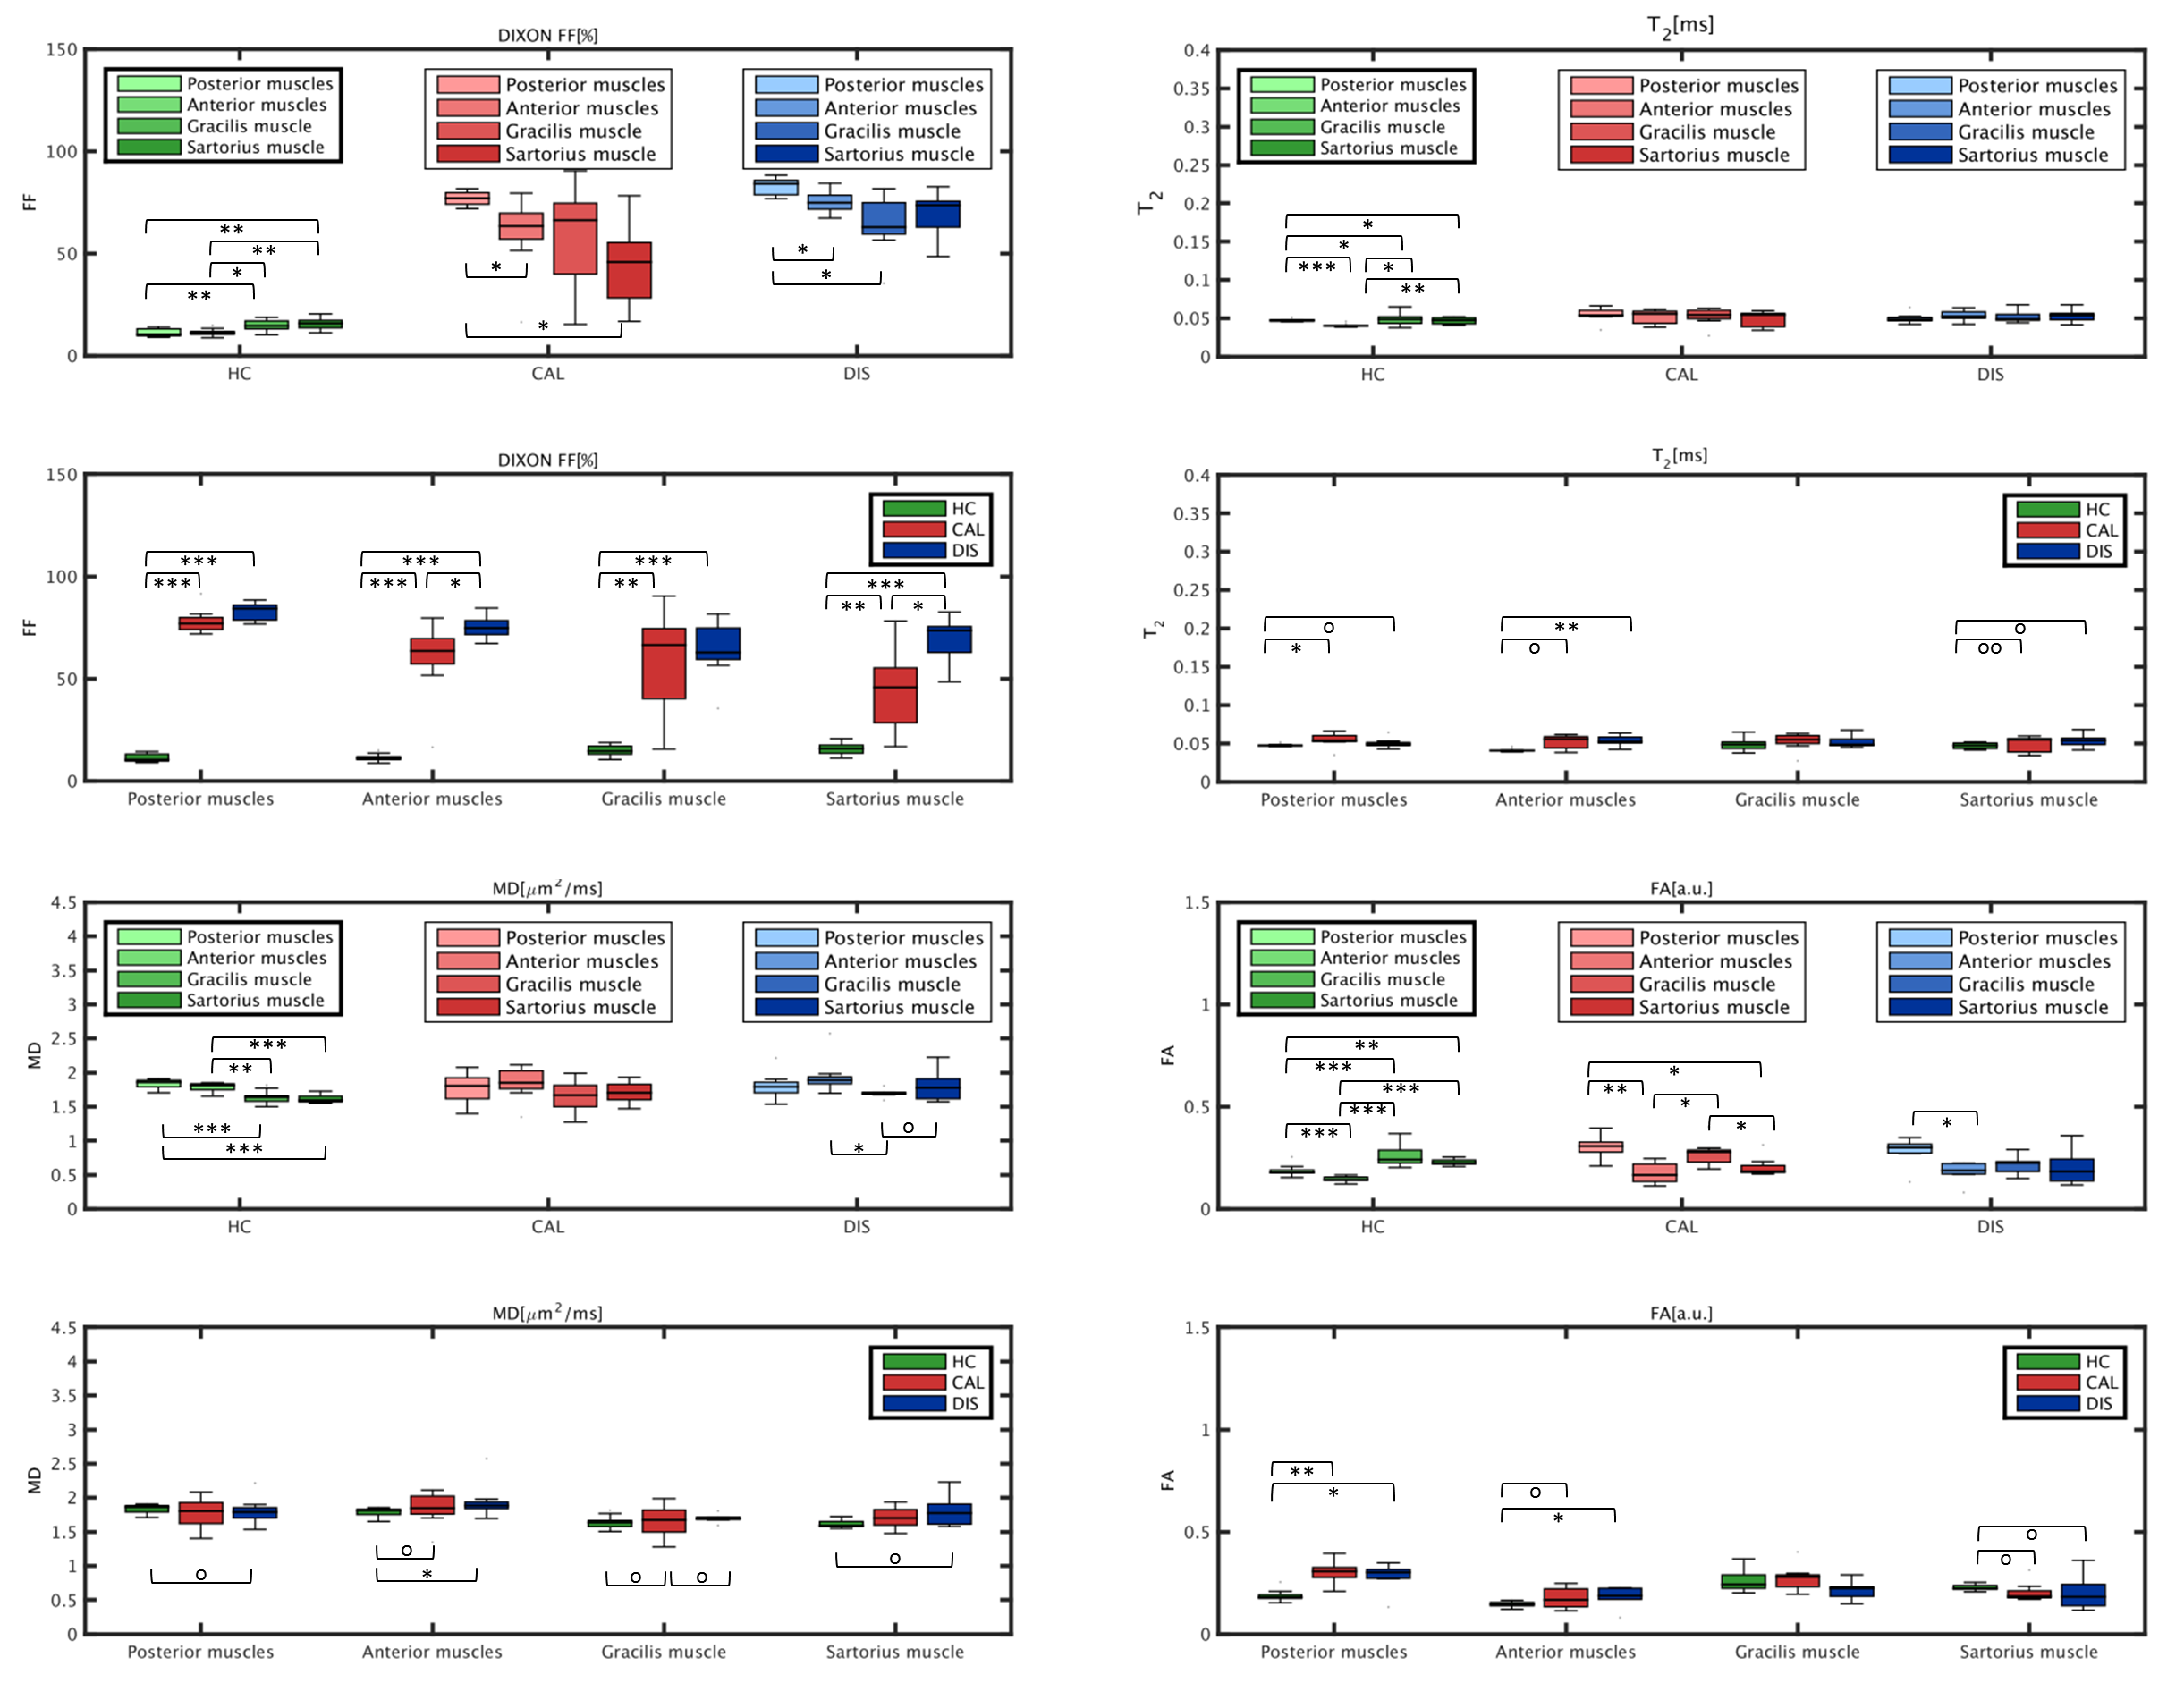
A multi-variate regression of each MRI parameter based on FF and its group was performed:$$$MRI_{metric}=β_0+β_{1}FF+β_{2}DIAGNOSIS$$$, where DIAGNOSIS was a categorical variable. MRI metrics were individually corrected for fat effect but not for disease effect subtracting only the term. Boxplots of the corrected metrics were computed and differences among muscles and groups tested with the Wilcoxon Rank-Sum test and the Ansari-Bradley test for dispersion. Finally, the correlations between corrected MRI parameters and clinical measures (Medical Research Council scale for muscular strength, MRC) of the adductors and quadriceps were evaluated.
Results
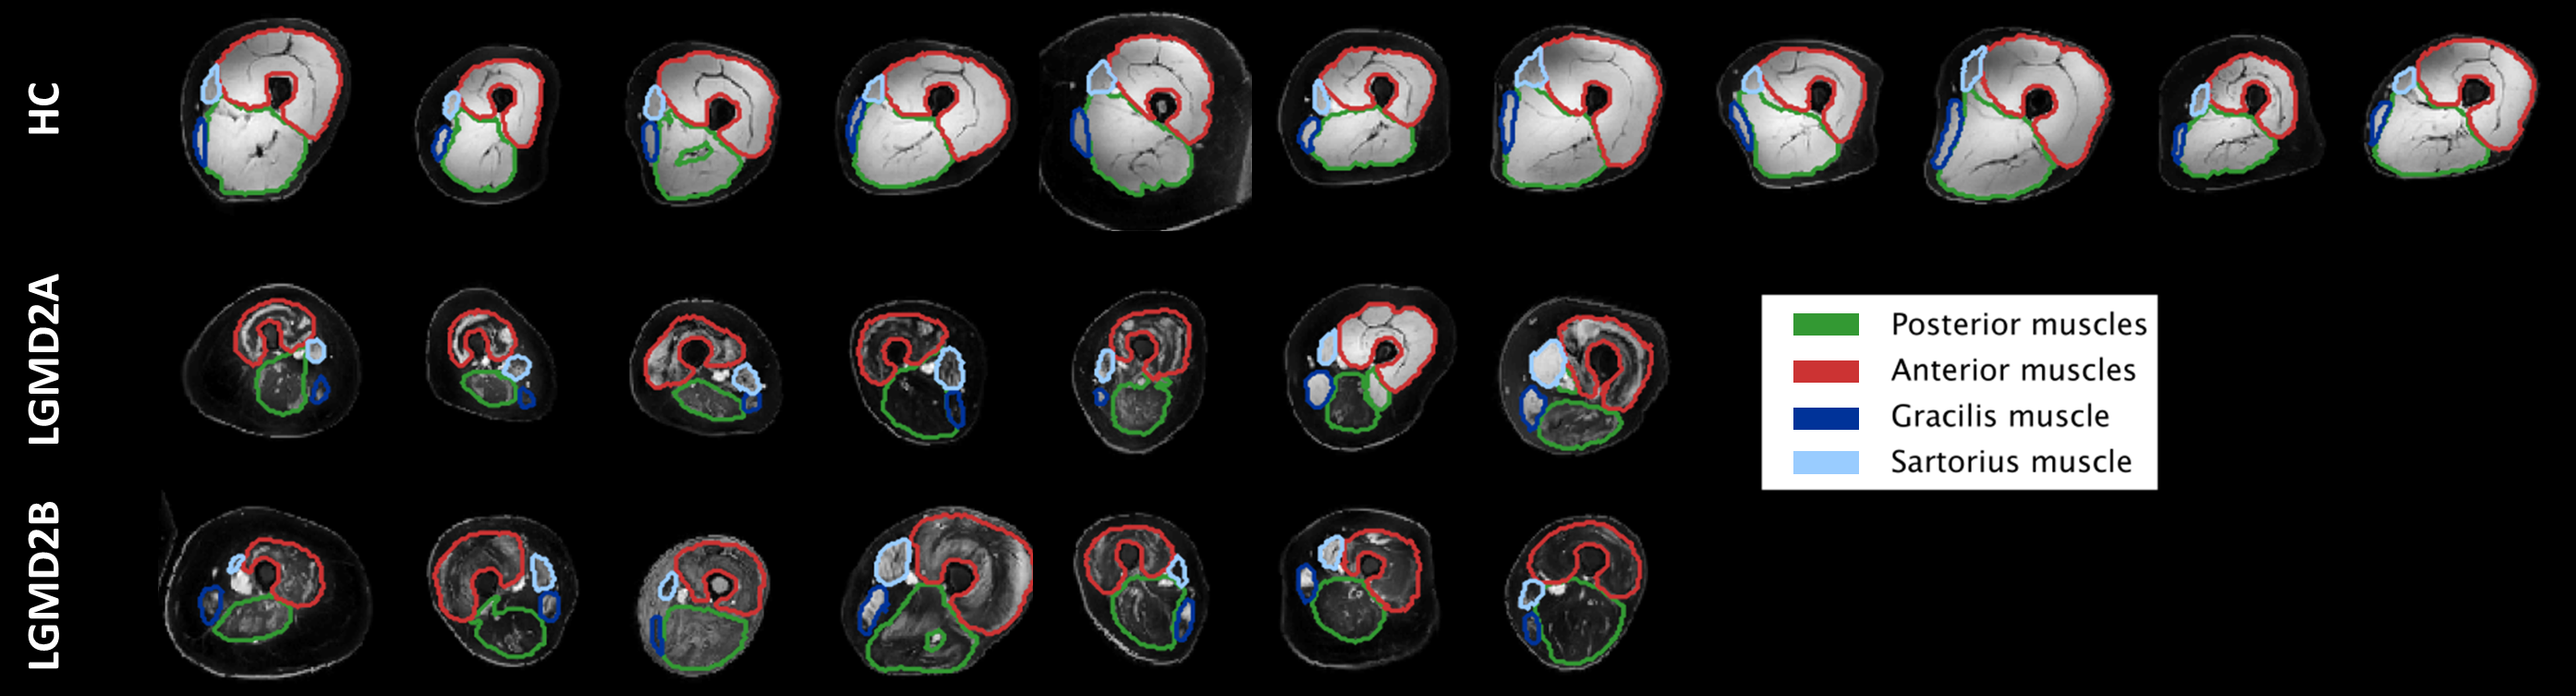
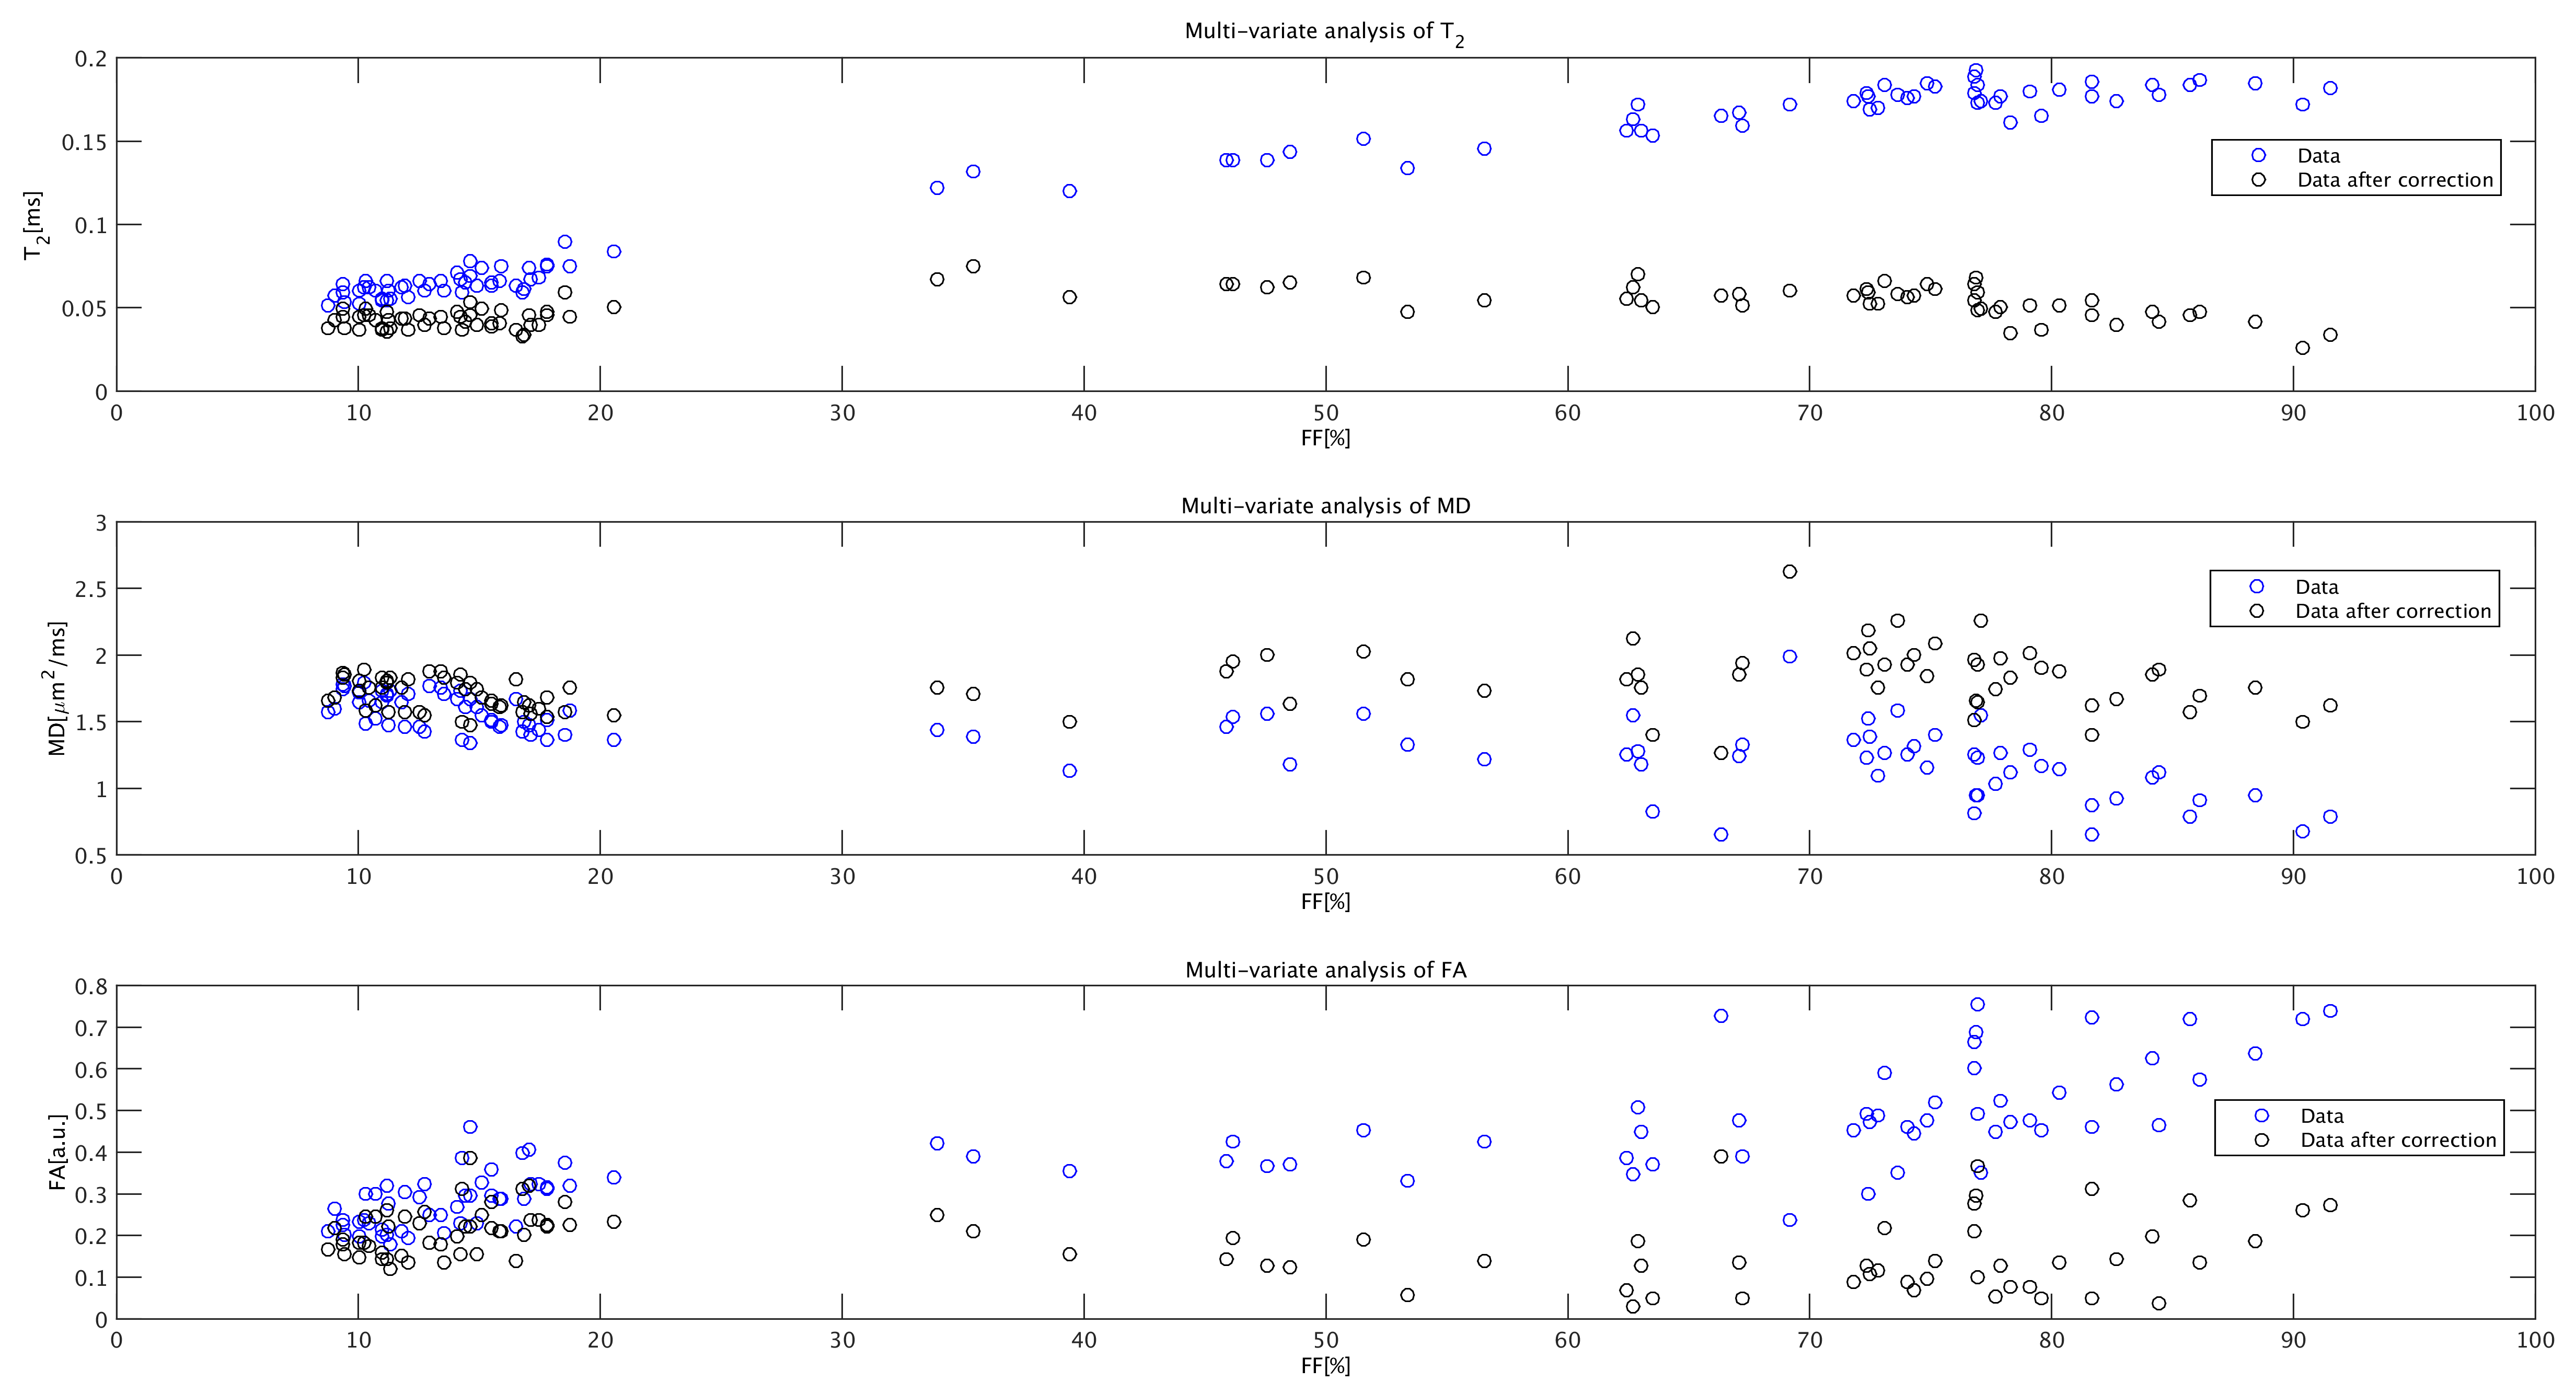
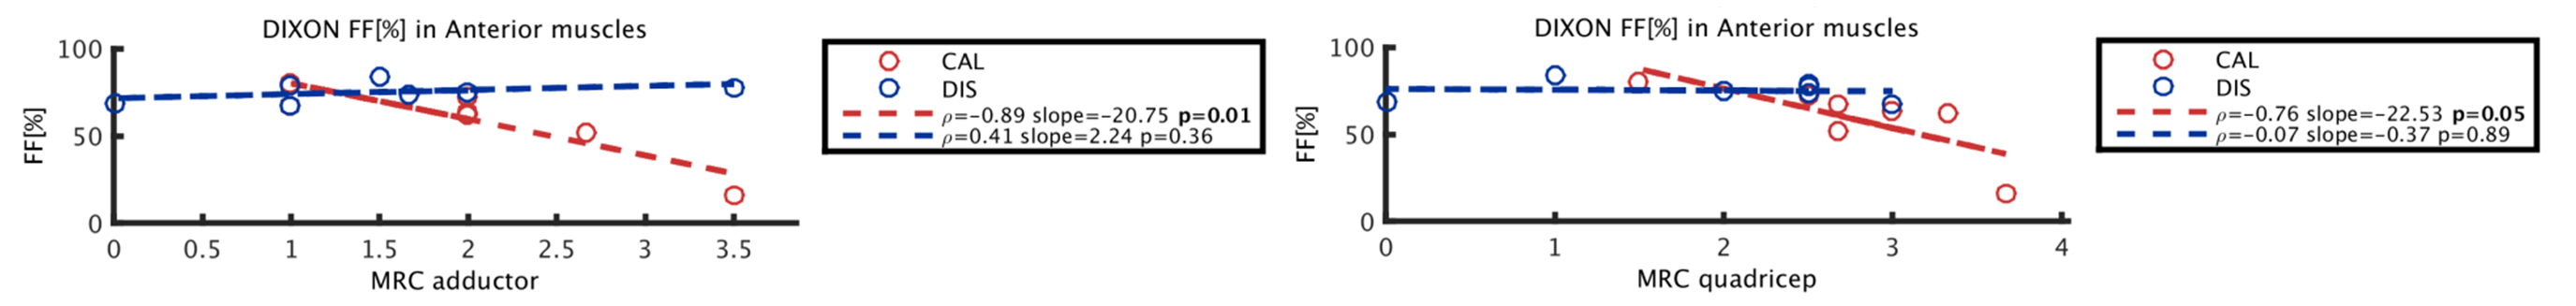
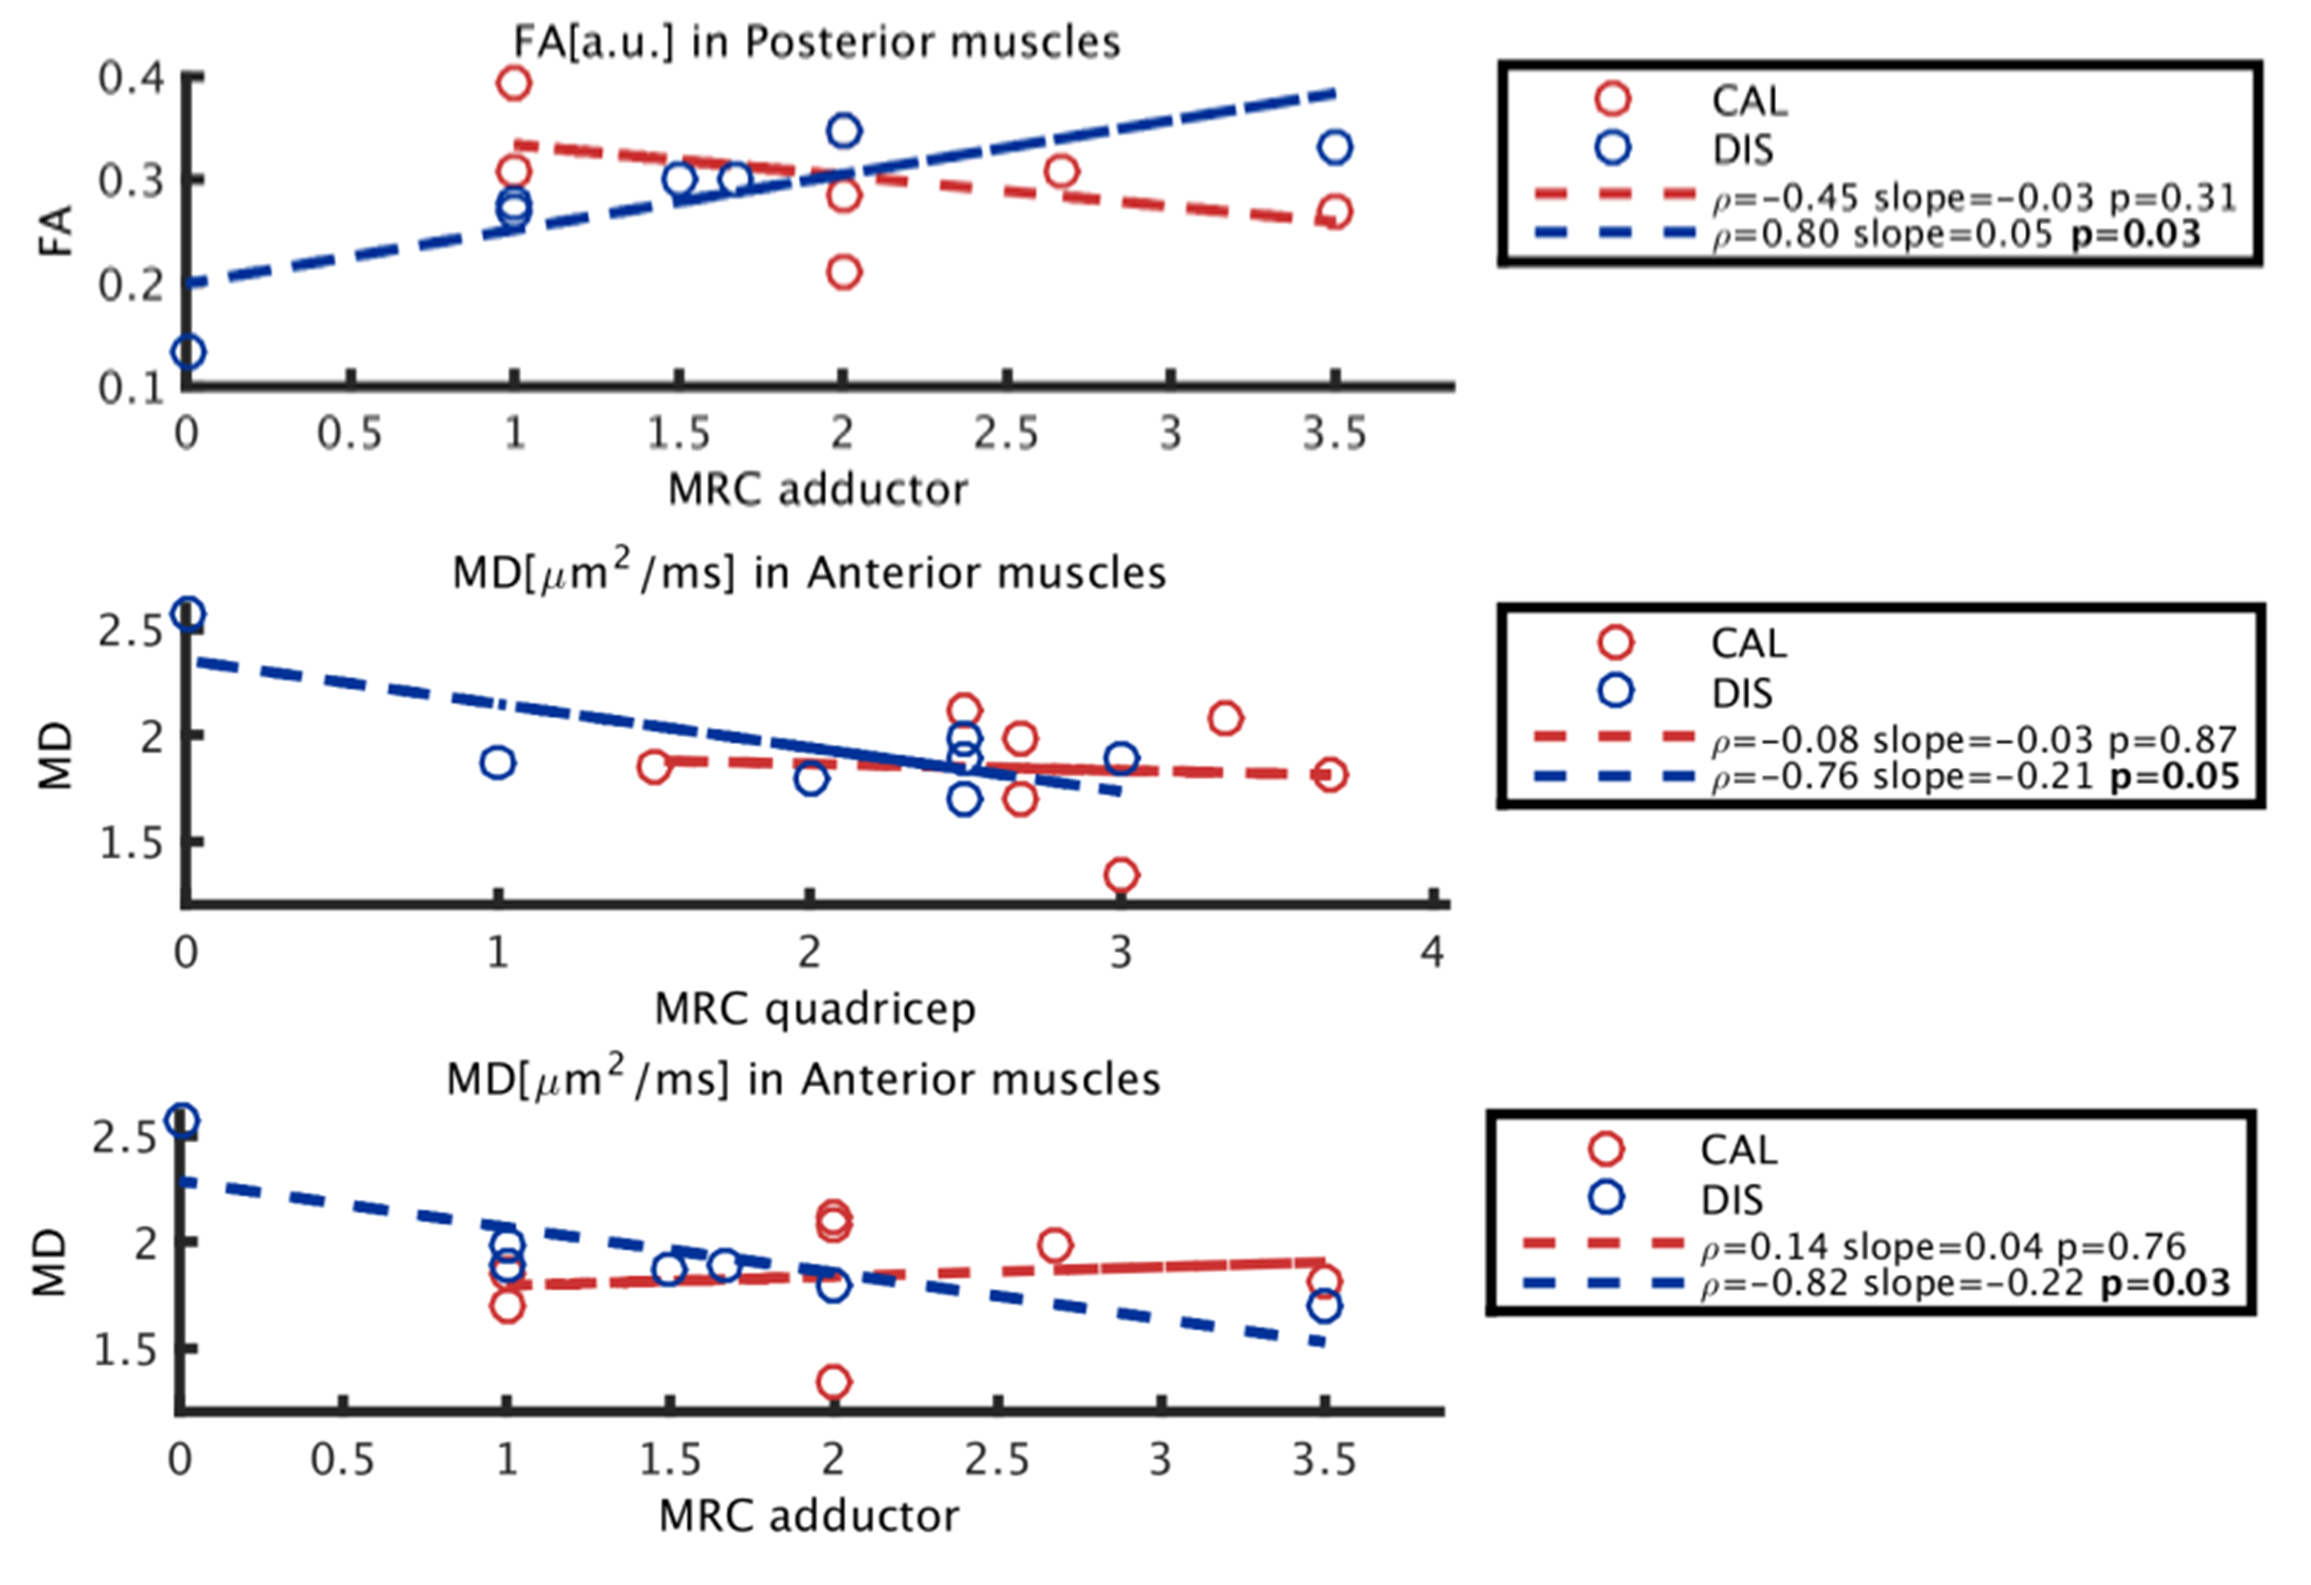
Figure 1 shows an example of the Dixon water signal images of each subject, with the four ROIs overlaid. Patients of both groups were characterized by high fat infiltration and atrophy. Within the ROIs of patients the percentages of voxels with FF≤30% were between 2 and 36%. The multi-variate analysis of the MRI metrics with FF is reported in Figure 2. For all the parameters, FF resulted to be a significant predictor. The adjusted R2 of the GLM was 0.97 for T2, 0.56 for MD and 0.68 for FA. Also the diagnosis was a significant predictor for all parameters. Boxplots of FF, corrected T2, MD and FA are reported in Figure 3. Several statistical differences among muscles and groups were revealed as marked in figure. Figure 4 shows some of the results of the correlation analysis between MRC of adductors/quadriceps and FF. Significant correlations with both MRCs were observed in the CAL group, pointing out a reduction of functionality with increasing FF, while FF was not significant in the DIS group. Conversely, MD and FA were correlated with MRC only in the DIS group, associating lower MD and higher FA values to higher functional scores, as shown in Figure 5.Discussion
Fat infiltration is a key-characteristic of muscular dystrophies that affects other MRI-derived measures, as reported for dMRI[5]. The solution here proposed attempts to remove the contribution of fat on other MRI metrics in highly infiltrated muscles. Physiologic differences between muscle groups were observed in HC, with GR and SR showing higher T2 and FA values, and lower MD than AM and PM. These differences were reduced for patients, eventually due to the massive architectural degeneration. Most of the differences between HC and patients were supported by FF. However, corrected measures also showed differences between patient groups and healthy controls. Finally, correlations with functional variables highlighted the different sensitivity of dMRI and Dixon to LGMD2A and LGMD2B etiology. Given the limited sample size, further characterization should be pursued in future studies.Conclusions
T2 and dMRI metrics are strongly biased by fat in highly infiltrated patients. This bias can be reduced by multi-variate modeling of the FF effect. FF explains MRC in LGMD2A but not in LGMD2B, where strength correlated with corrected dMRI metrics.Acknowledgements
No acknowledgement found.References
[1] S. Klein, M. Staring, K. Murphy, M. A. Viergever, and J. P. W. Pluim, “elastix: a toolbox for intensity-based medical image registration.,” IEEE Trans. Med. Imaging, vol. 29, no. 1, pp. 196–205, Jan. 2010.
[2] P. A. Cook, Y. Bai, S. Nedjati-Gilani, K. K. Seunarine, M. G. Hall, Parker, Geoff J M, and D. C. Alexander, “Camino: Open-Source Diffusion-MRI Reconstruction and Processing,” in International Society for Magnetic Resonance in Medicine, 2006.
[3] L.-C. Chang, D. K. Jones, and C. Pierpaoli, “RESTORE: robust estimation of tensors by outlier rejection.,” Magn. Reson. Med., vol. 53, no. 5, pp. 1088–95, May 2005.
[4] A. De Luca, A. Bertoldo, and M. Froeling, “Effects of perfusion on DTI and DKI estimates in the skeletal muscle.,” Magn. Reson. Med., Aug. 2016.
[5] M. T. Hooijmans, B. M. Damon, M. Froeling, M. J. Versluis, J. Burakiewicz, J. J. G. M. Verschuuren, E. H. Niks, A. G. Webb, and H. E. Kan, “Evaluation of skeletal muscle DTI in patients with duchenne muscular dystrophy,” NMR Biomed., no. October, p. n/a-n/a, 2015.
Figures