1568
Fast delineation of calf muscles for quantitative MRI applications1Consultants for Research in Imaging and Spectroscopy, Tournai, Belgium, 2Support Center for Advanced Neuroimaging, Institute for Diagnostic and Interventional Neuroradiology, Inselspital, Bern University Hospital, University of Bern, Switzerland, 3NMR Laboratory, Institute of Myology, Paris, France, 4CEA, DRF, I²BM, MIRCen, NMR Laboratory, Paris, France
Synopsis
One typical obstacle in quantitative MRI lies in the delineation of the regions of interest. When not absolutely necessary, per-muscle analyses are often abandoned, resulting in the loss of a wealth information. A software dedicated to accelerated segmentation of muscle images was recently introduced. It was tested here on the calf muscles of healthy volunteers and Duchenne patients. Results showed an important gain in average speed and were close to the manual segmentation used as reference. Thus, the tested software proved to be a valuable tool for quantitative analysis of skeletal muscle NMR images.
Introduction
In today’s clinical practice and therapeutic trials on neuromuscular diseases, quantitative MRI is progressively taking a major role for monitoring the evolution of diseases and the efficacy of treatments.
However, in the course of the acquired data processing, one typical obstacle lies in the determination of the regions to assess. For brain and heart, specialized automatic software tools can quickly segment the anatomical images into meaningful regions. For the other organs, including skeletal muscles, one has to invest long hours to delineate the regions of interest (ROI). For this reason, localized, e.g. muscle by muscle, analyses are often disregarded, with a waste of abundant information.
A software dedicated to interactive segmentation of muscle MRI has recently been introduced1. It was made available to a team of neurologists who tested it on the lower leg muscles of healthy volunteers and Duchenne patients, the latter presenting severe fatty infiltrations. The obtained segmentations were compared to the standard, fully manual approach both in terms of accuracy and processing time.
Methods
All images were acquired either on a 3 tesla Siemens Prisma or Trio scanner. The acquisition sequence was a standard 2pt Dixon sequence (VIBE 3D, TR: 10ms, TE: 1.75/3.95, FA: 3, FoV: 192x192mm2, pixel size: 1mm2, slice thickness: 5mm), with resulting images showing fat and water in-phase and out-of-phase. Only latter were used for segmentation, due to the good contrast between muscle and surrounding fasciae. The number of slices was 40 for the healthy volunteers, and 16 for the Duchenne patients.
There were 2 subject cohorts: one of 7 volunteers (BMI range: 19.6—30.4kg/m2), the other of 5 patients suffering from Duchenne muscular dystrophy (age range: 6—13 ), presenting severe fatty infiltrations in some of the studied muscles.
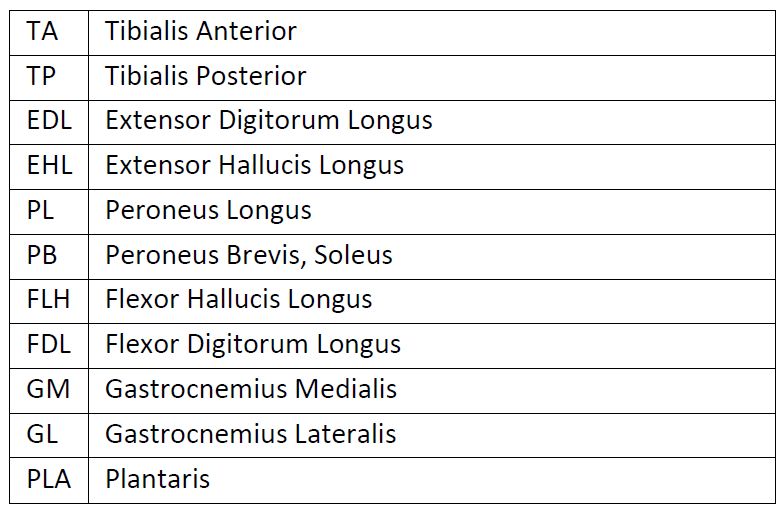
Twelve lower leg muscles were systematically evaluated (see figure 2). Several muscle heads included in the list were found by the operator to be difficult to segment manually due to the lack of any visible fascia (e.g. EHL, PB). Since most quantitative analyses do not require delineation of every single muscle, it was decided to merge some heads into larger groups for future analysis (cf. figures 3 and 4).
The tested software implements an interactive segmentation algorithm based on the Random Walker algorithm2. In interactive mode, the user is asked to label a few pixels of the image, after which the software automatically delineates a larger region around the labeled pixels.
One operator, trained in anatomy, performed all the segmentation tasks. All images were first segmented in a fully manual process: all muscles were manually delineated on all slices. The time spent on each muscle was recorded. At a later stage, all images were segmented again, this time aided by the interactive segmentation algorithm. The time interval prevented the operator to be influenced by their previous work.
Both segmentations were compared with respect to several similarity metrics: volumetric similarity (1 – absolute volume difference divided by sum of compared volumes), Dice coefficient (overlap measurement), Hausdorff distance (maximal distance between any points on each of the segmented volumes).
Results
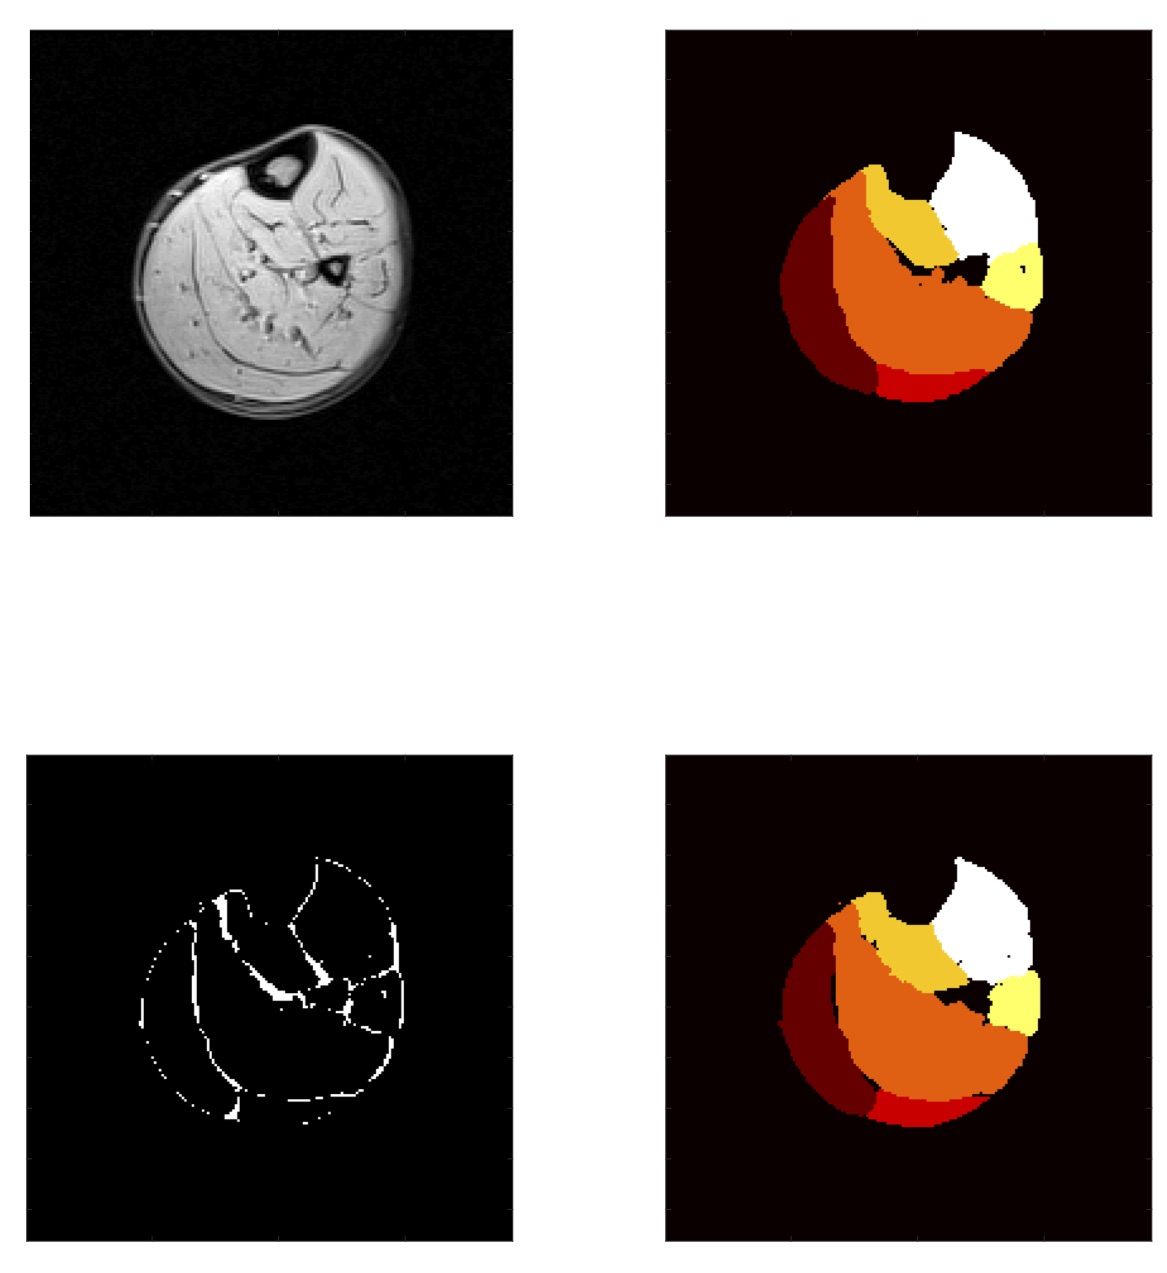
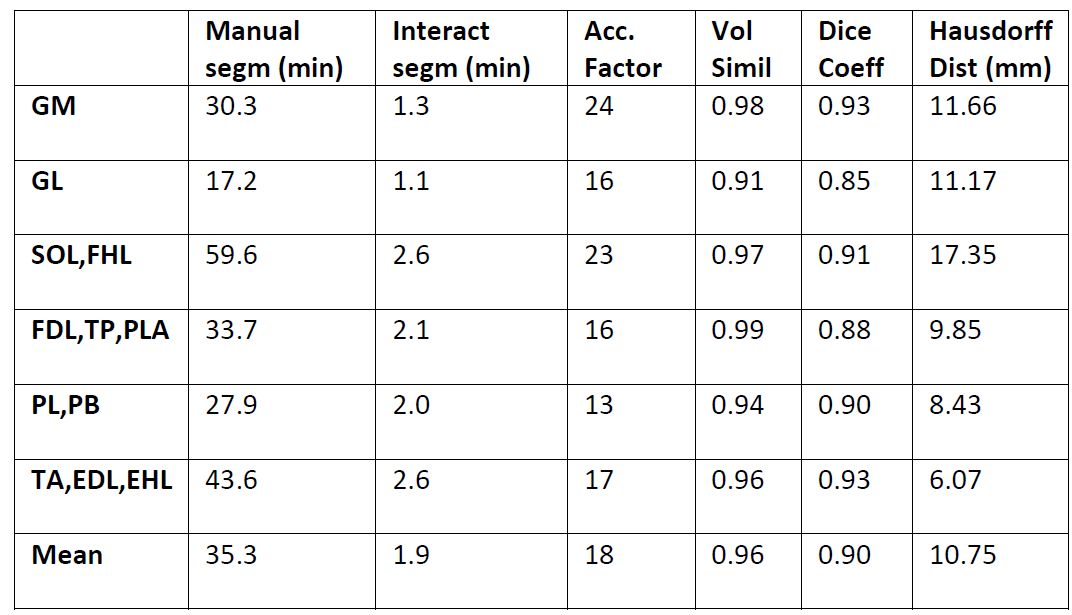
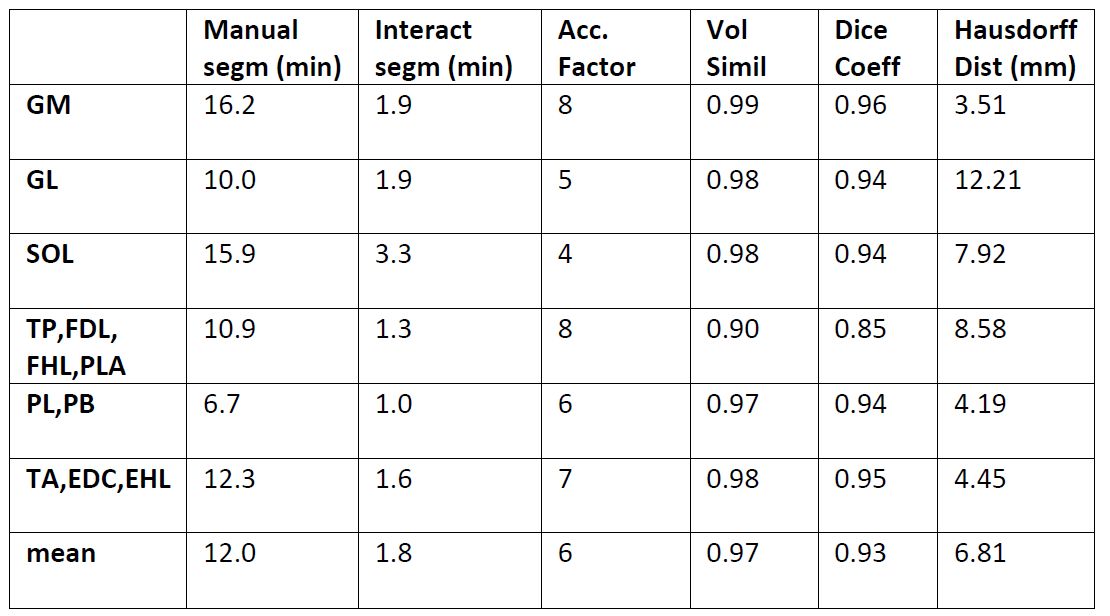
Results are gathered in figures 3 and 4. Examples of manual and interactive segmentations, and their differences, are given in figure 1.
Manual segmentation times on the volunteer cohort were 35 min per muscle on average. The mean segmentation time with the interactive method was 2 min. Results show an average speed increase by a factor of 18 per muscle. The muscles with clearly visible fasciae were those with the larger factors (GM: 23, TA: 25). The mean total segmentation times for all muscles in all slices were 247 min for the manual approach and 14 min for the interactive approach, respectively.
On the Duchenne patients, the acceleration factor was less (mean: 7) due to the smaller number of slices to segment: the time taken with the interactive method remains roughly the same, irrespective of the number of slices, while the time of the manual approach is proportional to the number of slices.
On the muscle groups of the healthy volunteers, the mean volume similarity was 0.96. The mean Dice coefficient was 0.90. The mean Hausdorff distance was 10.75mm. On the Duchenne patients, similar to better results were found. The fatty infiltrations did not hinder the algorithm performance.
Conclusion
Results showed that satisfying segmentations could be obtained in a fraction of the time normally taken by the standard approach. Similar results were found on the Duchenne cohort, demonstrating the robustness of the software to muscle fatty infiltration. As confirmed by visual inspection, all delineated regions were deemed usable for further analysis.Acknowledgements
No acknowledgement found.References
1. Shukelovitch, A., Baudin, P.-Y., Azzabou, N., Barnouin, Y., & Carlier, P. G. (2014). Fast Interactive Segmentation of Skeletal Muscles in MRI. In ISMRM.
2. Grady, L. (2006). Random walks for image segmentation. Pattern Analysis and Machine Intelligence, 28(11), 1768–1783.
Figures