1567
Magnetic resonance biomarkers for cachexia in a mouse model of pancreatic ductal adenocarcinoma.1Department of Radiology, University of Washington, Seattle, WA, United States, 2Center for Industrial and Medical Ultrasound Applied Physics Laboratory, University of Washington, Seattle, WA, United States, 3Department of Medicine, University of Washington, Seattle, WA, United States
Synopsis
Cancer induced cachexia is prevalent with many cancers and is characterized by loss of muscle and fat mass. In pancreatic cancer the syndrome affects approximately 80% of patients. Non-invasive multi-parametric MRI was used to monitor the progression of cachexia in a genetically engineered mouse model of pancreatic ductal adenocarcinoma (PDAC). Using pixel-by-pixel comparison, we demonstrate a significant decrease in skeletal muscle T2 and increase in magnetization transfer ratio (MTR). Additionally, we found significant difference in diffusion parameters.
Purpose
Cachexia is defined as an unintentional weight loss of >5% over a 6-month period, or a body mass index <20 kg/m2. Cancer induced cachexia is a hallmark of several cancers and is associated with loss of muscle and fat mass. Non-invasive biomarkers that can monitor the degree of cachexia are an urgent and unmet requirement.1 The purpose of this study was to investigate the effects of pancreatic tumor progression on lower hindlimb muscles in a genetically engineered KPC mouse model of PDAC using quantitative MRI. The KPC mouse model has been used for preclinical studies for human pancreatic cancer as it recapitulates human PDAC.2Methods
KPC mice (n = 10) equally divided into two groups depending on their tumor size i.e < 250 mm3 and >250 mm3. In vivo MRI was performed on a 14T Bruker Avance 600 MHz/89 mm wide-bore vertical MR spectrometer (Bruker Corp., Billerica, MA). All mice were imaged using the 14T MR scanner. A birdcage coil (inner diameter 25 mm) coil was used to image the animal mounted on a cradle with respiratory monitoring probe. High resolution MRI protocol included scout imaging (gradient echo, TR/TE = 30/1.3 ms), planning for image planes (multi-slice RARE: TR/TE = 668/4.5 ms), high resolution 2D imaging (TR/TE = 4000/6 ms) for muscle size evaluation, multi-slice multi-echo imaging (TR/TE = 4000/6-75 ms, 12 echoes with 6.3 ms spacing) for transverse relaxation time T2 measurements, magnetization transfer imaging (gradient echo; TR/TE = 939/5 ms, flip angle =30o). Additionally, in-vivo DTI was performed using spin echo-EPI sequence (DTI-Epi) with 6 diffusion gradient directions (repetition time = 500 ms; echo time= 17.40 ms; field of view = 25.6 x 11.03 mm, matrix size = 128 x 64; diffusion gradient duration = 5 ms; diffusion gradient separation = 10 ms, number of averages (NA) = 2). Diffusion sensitizing gradients were applied along six different orientations. Image analysis was done using ImageJ software (http://rsbweb.nih.gov/ij), developed by the National Institute of Health, to measure mean values of muscles, gastrocnemius (GA) in this case. Muscle cross sectional area (CSAmax) was measured using Osirix (www.osirix-viewer.com).Results
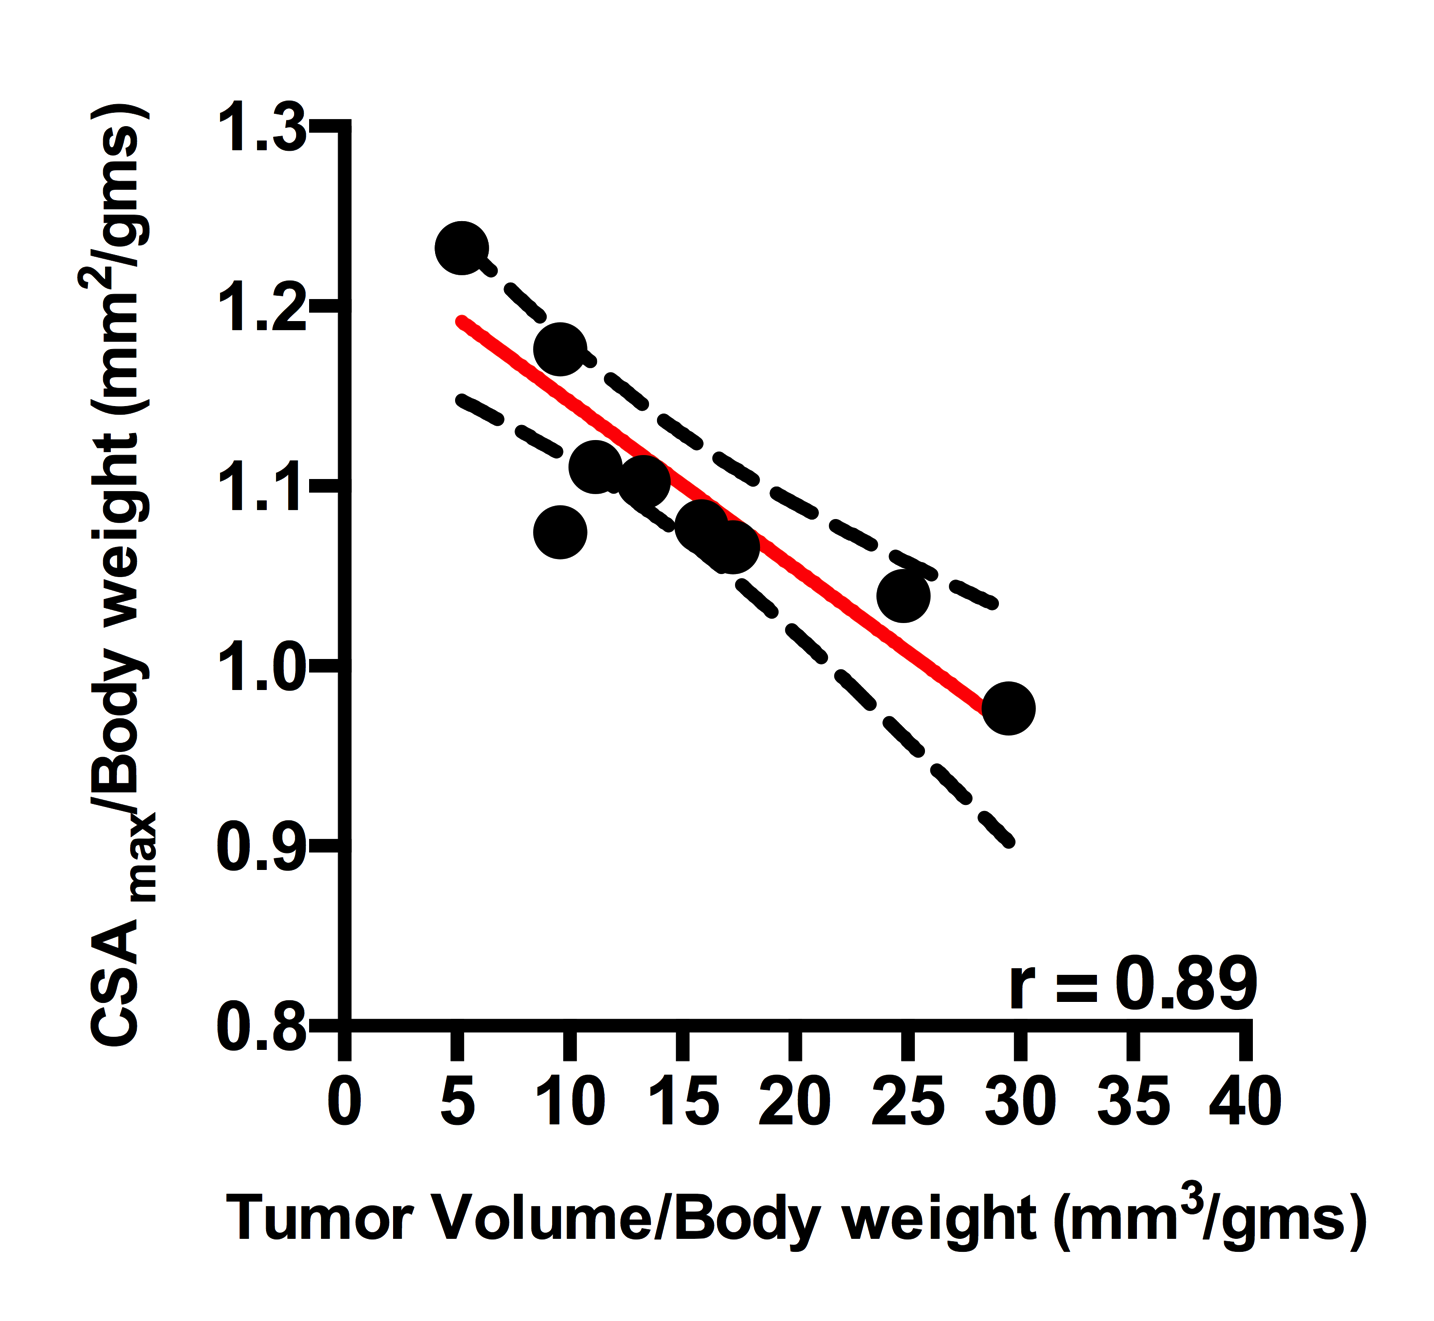
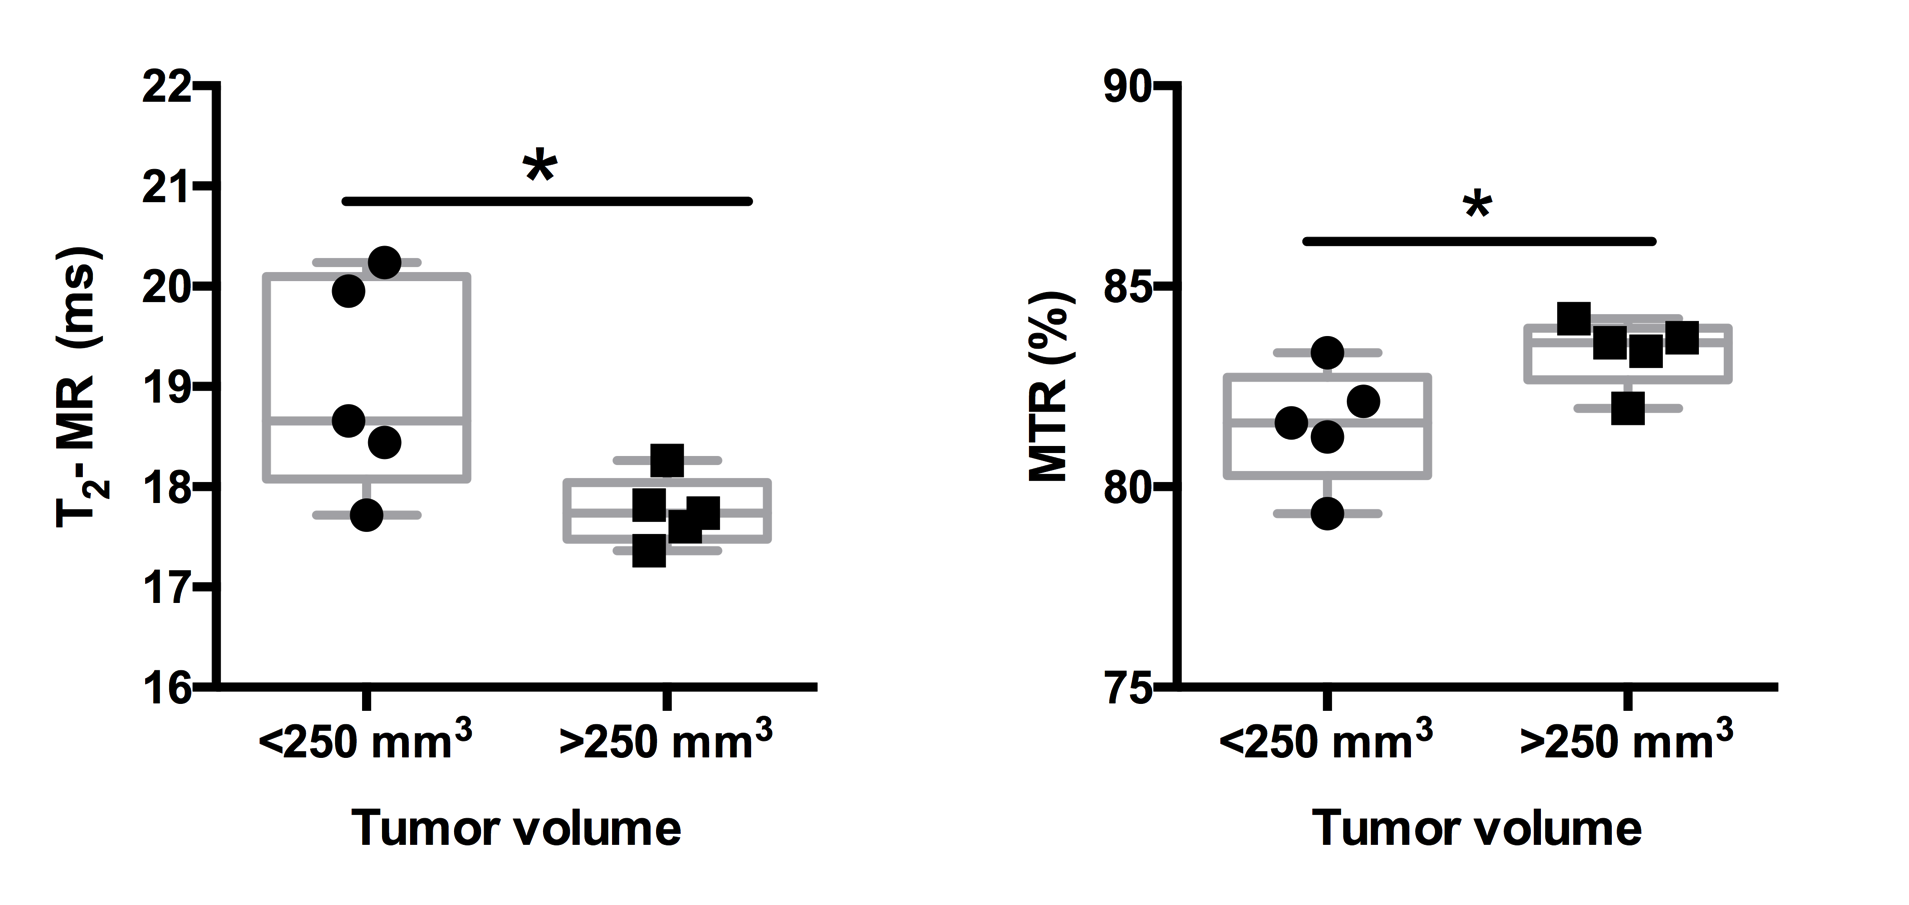
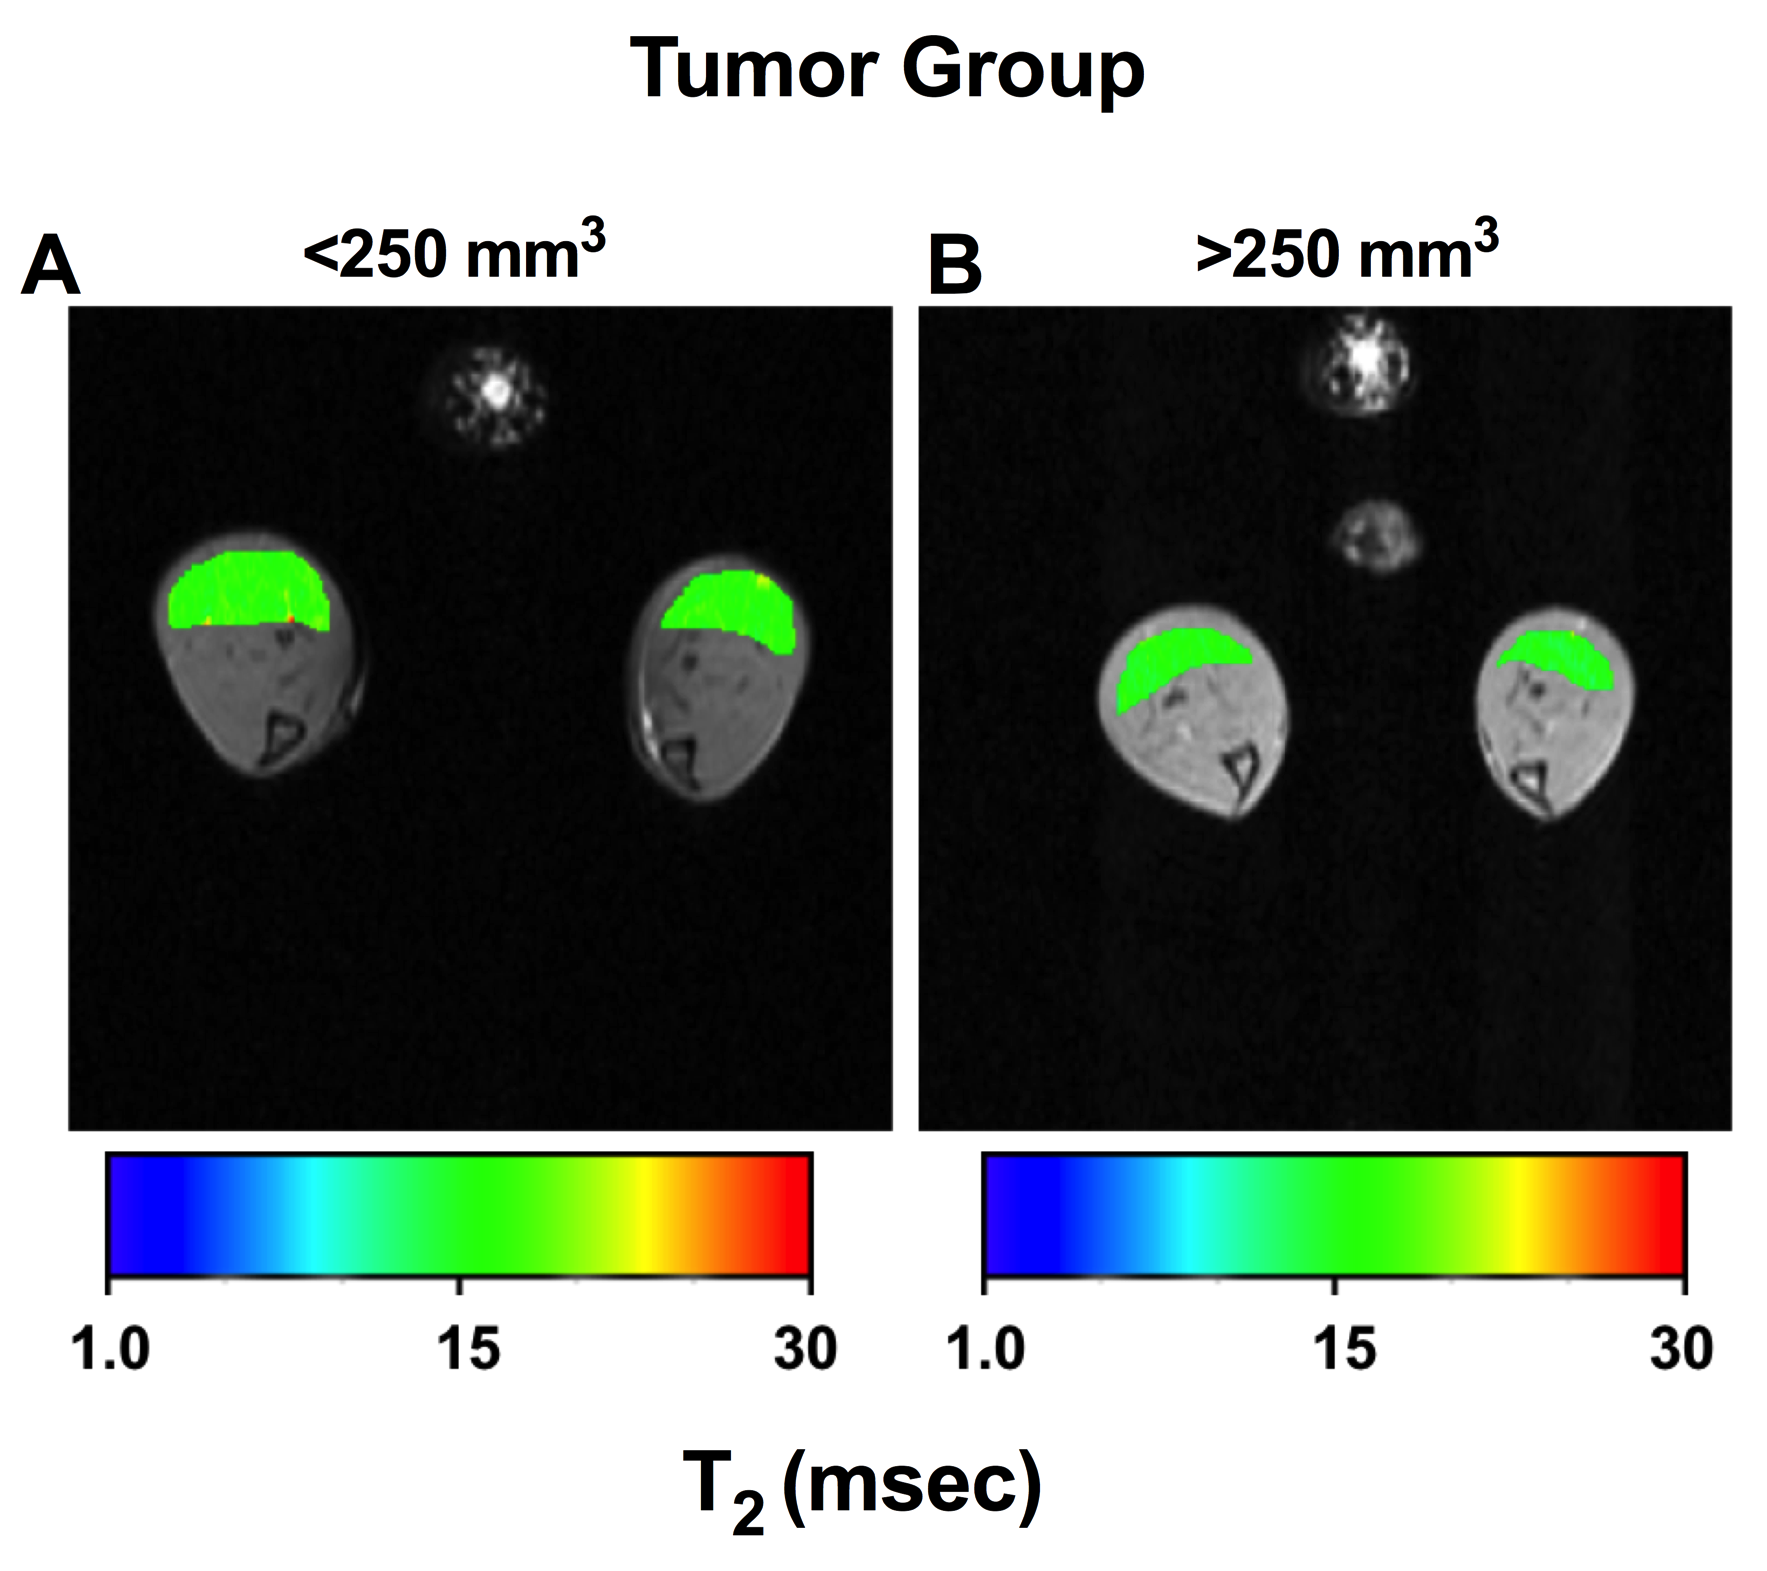
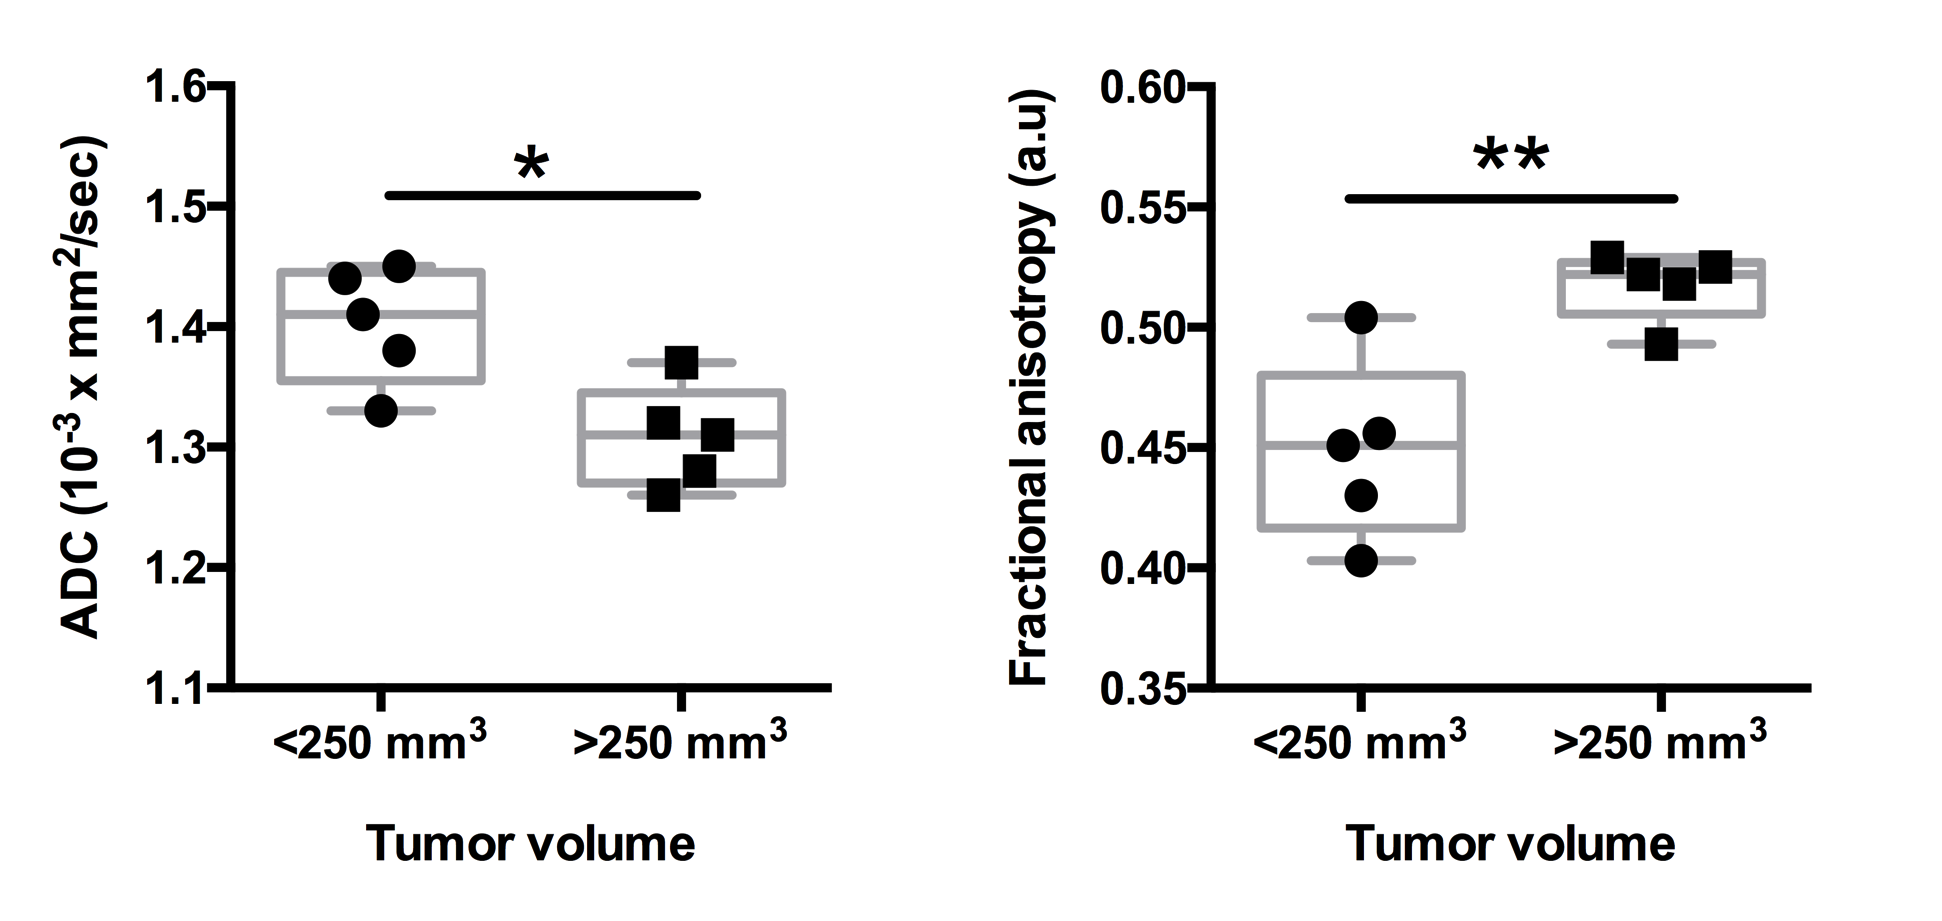
There was a significant negative correlation between increase in pancreatic tumor size and hindlimb muscle cross sectional area (r = 0.89, p <0.001) (Figure 1). Additionally, we found significant decrease in skeletal muscle T2 (19.00±1.06 ms vs 17.76±0.33 ms; p < 0.05) and increase in MTR (81.53±1.46 vs 83.37±0.84; p < 0.05) with increase in pancreatic tumor size (Figure 2, 3). Finally, there were significant differences diffusion parameters i.e. mean diffusivity (MD) (1.40x10⁻³±0.05x10⁻³ mm2/sec vs 1.31 x10⁻³±.04 x10-3 mm2/sec; p <0.05) and fractional anisotropy (FA) (0.49±0.04 vs 0.52±0.01; p < 0.01) (Figure 4).Discussion
Cancer related cachexia is characterized by continuous loss of skeletal muscle mass, which causes weakness in the muscles. Previously published results have demonstrated changes at the cellular level.3,4 However, there are not many reports correlating the degree of cachexia with increase in tumor size. This study demonstrates that MR can be used as a non-invasive tool to evaluate the size and diffusion properties of the muscle.Acknowledgements
The study was supported by National Institutes of Health (R01CA188654).References
1. Winnard, P.T., Jr., et al., Detection of Pancreatic Cancer-Induced Cachexia Using a Fluorescent Myoblast Reporter System and Analysis of Metabolite Abundance. Cancer Res, 2016. 76(6): p. 1441-50.
2. Hingorani, S.R., et al., Trp53R172H and KrasG12D cooperate to promote chromosomal instability and widely metastatic pancreatic ductal adenocarcinoma in mice. Cancer Cell, 2005. 7(5): p. 469-83.
3. Cai, D., et al., IKKbeta/NF-kappaB activation causes severe muscle wasting in mice. Cell, 2004. 119(2): p. 285-98.
4. Reed, S.A., et al., Inhibition of FoxO transcriptional activity prevents muscle fiber atrophy during cachexia and induces hypertrophy. FASEB J, 2012. 26(3): p. 987-1000.
5. Galban, C.J., et al., Diffusive sensitivity to muscle architecture: a magnetic resonance diffusion tensor imaging study of the human calf. Eur J Appl Physiol, 2004. 93(3): p. 253-62.
Figures