1566
Potential of Stimulated Echo Diffusion-weighted Imaging as Disease Marker in Duchenne Muscular Dystrophy1Radiology, LUMC, Leiden, Netherlands, 2Human Genetics, LUMC, Leiden, Netherlands, 3Institute of Child Health, University College London, London, United Kingdom, 4Newcastle Magnetic Resonance Centre, Newcastle University, Newcastle, United Kingdom
Synopsis
We used stimulated echo diffusion weighted imaging (STE-DWI) in a mouse model of Duchenne muscular dystrophy (mdx). From the data in mdx or wild type animals we observe that although muscle fibre size is smaller in the mdx mouse, the diffusion data show increased diffusibility – opposite to the hypothesised effect if fibre size is the main determinant of restricted water diffusion. Muscle fibre permeability is significantly greater in the mdx mouse, suggesting that the overall system permeability has a countering effect on diffusion restriction. Additional modelling is required to capture these two opposing effects.
Introduction
Duchenne muscular dystrophy (DMD) is a genetic disease, characterized by severe and progressive muscle weakness and altered muscle microstructure(1). Patients become wheelchair dependent and die between their 2nd and 4th decade of life due to respiratory or cardiac failure. Diffusion weighted imaging (DWI) can probe tissue microstructure of muscle tissue and may serve as an early disease marker(2,3). To effectively use DWI, long diffusion times are required to measure restriction, since muscle fibers have on average a diameters of 10-50 microns (4), far larger than nerve fibers. In this study we used a stimulated echo sequence to explore the effect of increased diffusion times, up to 700ms, to assess DMD muscle pathology in the mdx mouse model.Method
To study this, 8 weeks old (n=5) mdx and (n=5) C57BL/10ScSnJ mice were scanned using a 7Tesla Bruker PharmaScan equipped with a 370mT/m gradient system and ParaVision 6.0.1 software. Standard stimulated echo diffusion (STEAM) sequences were modified, crusher gradients were set to 40mT·s/m to significantly lower diffusion weighting by butterfly gradients, whilst ensuring proper crushing of unwanted signal. Phase cycling was implemented to avoid gradient echoes in the readout frame. To explore diffusion hindrance by increased mixing times, unweighted and b=500s/mm2 weighted images were acquired at Δ=[120 200 260 300 500 700]ms using a standard readout (2DFT) and echo planar imaging (EPI) readout with diffusion gradient on the read-axis. A T2 map was acquired as well. For all acquisitions the following settings were used: NA=2, TR = 4000ms; TE=21ms; FOV=20x10mm; matrix=128x64 and 5 slices (no gap) positioned perpendicular to the tibia bone. The EPI readout was split into 2 readout segments with NA=8. The leg was immobilized by alginate, a viscous gum, which also improved B0 shimming. All analyses were done on the triceps surae muscle group (which includes the gastrocnemius muscles).Results
SNR was not significantly different between the standard(2DFT) and the accelerated (EPI) acquisitions and with increasing diffusion time SNR decreased, as expected due to T1 decay during the mixing time of the STEAM sequence. Although we used four times as many averages to improve SNR, the EPI readout was eight times faster than the 2DFT readout. T2 values were elevated in the DMD model, with focal hyperintense appearances and increased heterogeneity throughout the whole leg, as seen in figure 1 and 2. Overall mdx mice had significant (p<0.05) higher T2 values (34.23+3.72 ms) compared to wildtype mice (28.25+0.23ms).
With increasing diffusion times, a reduction of 25% of ADC values were found in both strains. A trend to higher ADC values in the DMD model was seen at the intermediate diffusion times from 200-300ms (figure 3 and table 1), although all differences were not significant. Scatter plots (figure 4) do not show a correlation between T2 and ADC values, indicating that each parameter provides independent information. A qualitative analysis shows that the focal lesions found in T2 maps are not reflected in any of the ADC maps (figure 1 and 4).
Discussion
We found increased ADC values in mdx mice, while we expected a decrease in ADC values based on decreased fibre radii. We hypothesise that the increased permeability(5) found in mdx mice has a large effect on diffusion restriction. We applied an exponential fit to the data, while using modelling can further exploit the information present in underlying data to understand the microscopic changes and we are currently looking into this(2).
We cannot rule out that the characteristic hypertrophy in mdx mice might result in increased muscle pennation angle(6), causing the orientation of the diffusion gradient to be slightly more parallel to the muscle instead of perpendicular. Therefore, we are currently using diffusion tensor imaging, to avoid influence of slice selection and pennation angle on ADC values. Next to this we are using an exercise regime to increase fibre damage and cell permeability to investigate the effect of permeability on the diffusion curve
Conclusion
Using stimulated echo diffusion weighted imaging, we used diffusion times up to D=700ms and found a decrease of ADC values with increasing diffusion times for both mdx and wild-type mice. T2 values were significantly elevated in mdx mice, while ADC values were shifted to higher values, but were not significant different, despite a 50% reduction in fibre size. We need diffusion tensor imaging and advanced modelling to further understand the microscopic changes occurring in muscular dystrophies.Acknowledgements
This work was supported by the European Union NMD-Bioimage project. Seventh Framework Programme (FP7/2007-2013) under grant agreement 602485 Bioimage-NMD project.References
1. Bushby K, Finkel R, Birnkrant DJ, Case LE, Clemens PR, Cripe L, et al. Diagnosis and management of Duchenne muscular dystrophy, part 1: diagnosis, and pharmacological and psychosocial management. Lancet Neurol [Internet]. Elsevier Ltd; 2010;9(1):77–93. Available from: http://dx.doi.org/10.1016/S1474-4422(09)70271-6
2. Hall MG, Clark CA. Diffusion in hierarchical systems: A simulation study in models of healthy and diseased muscle tissue. Magn Reson Med [Internet]. 2016 Sep 25;0:1–12. Available from: http://doi.wiley.com/10.1002/mrm.26469
3. Sigmund EE, Sui D, Ukpebor O, Baete S, Fieremans E, Babb JS, et al. Stimulated echo diffusion tensor imaging and SPAIR T2 -weighted imaging in chronic exertional compartment syndrome of the lower leg muscles. J Magn Reson Imaging [Internet]. 2013 Nov [cited 2014 Feb 18];38(5):1073–82. Available from: http://www.ncbi.nlm.nih.gov/pubmed/23440764
4. Roig M, Roma J, Fargas A, Munell F. Longitudinal pathologic study of the gastrocnemius muscle group in mdx mice. Acta Neuropathol [Internet]. 2004 Jan [cited 2014 Apr 7];107(1):27–34. Available from: http://www.ncbi.nlm.nih.gov/pubmed/14530991
5. Hamer PW, McGeachie JM, Davies MJ, Grounds MD. Evans Blue Dye as an in vivo marker of myofibre damage: Optimising parameters for detecting initial myofibre membrane permeability. J Anat. 2002;200:69–79.
6. Lovering RM, Shah SB, Pratt SJP, Gong W, Chen Y. Architecture of healthy and dystrophic muscles detected by optical coherence tomography. Muscle Nerve [Internet]. 2013 Apr;47(4):588–90. Available from: http://www.ncbi.nlm.nih.gov/pubmed/23381871
7. Hall MG, Porcari P, Blamire A, Clark CA. Proc.of the 24th Meeting of the International Society for Magnetic Resonance in Medicine. In Singapore; 2016.
Figures
Left: An example T2 map of a mdx mouse showing muscle damage with focal hyperintense appearances throughout the whole leg. These focal appearances are non-specific for oedema, inflammation or necrosis.
Right: The corresponding ADC map acquired using a diffusion time of D=300ms shows different information and is not characterised by the focal appearances found on the T2 map.
A: Extracted from (7): Fibre size distributions of mdx and wild type mice. In mdx mice smaller fibre radii are found compared to wild type mice.
B: A histogram of T2 values of the triceps surae muscle in all mice. A significant increase (P<0.05) in T2 values is found in mdx mice.
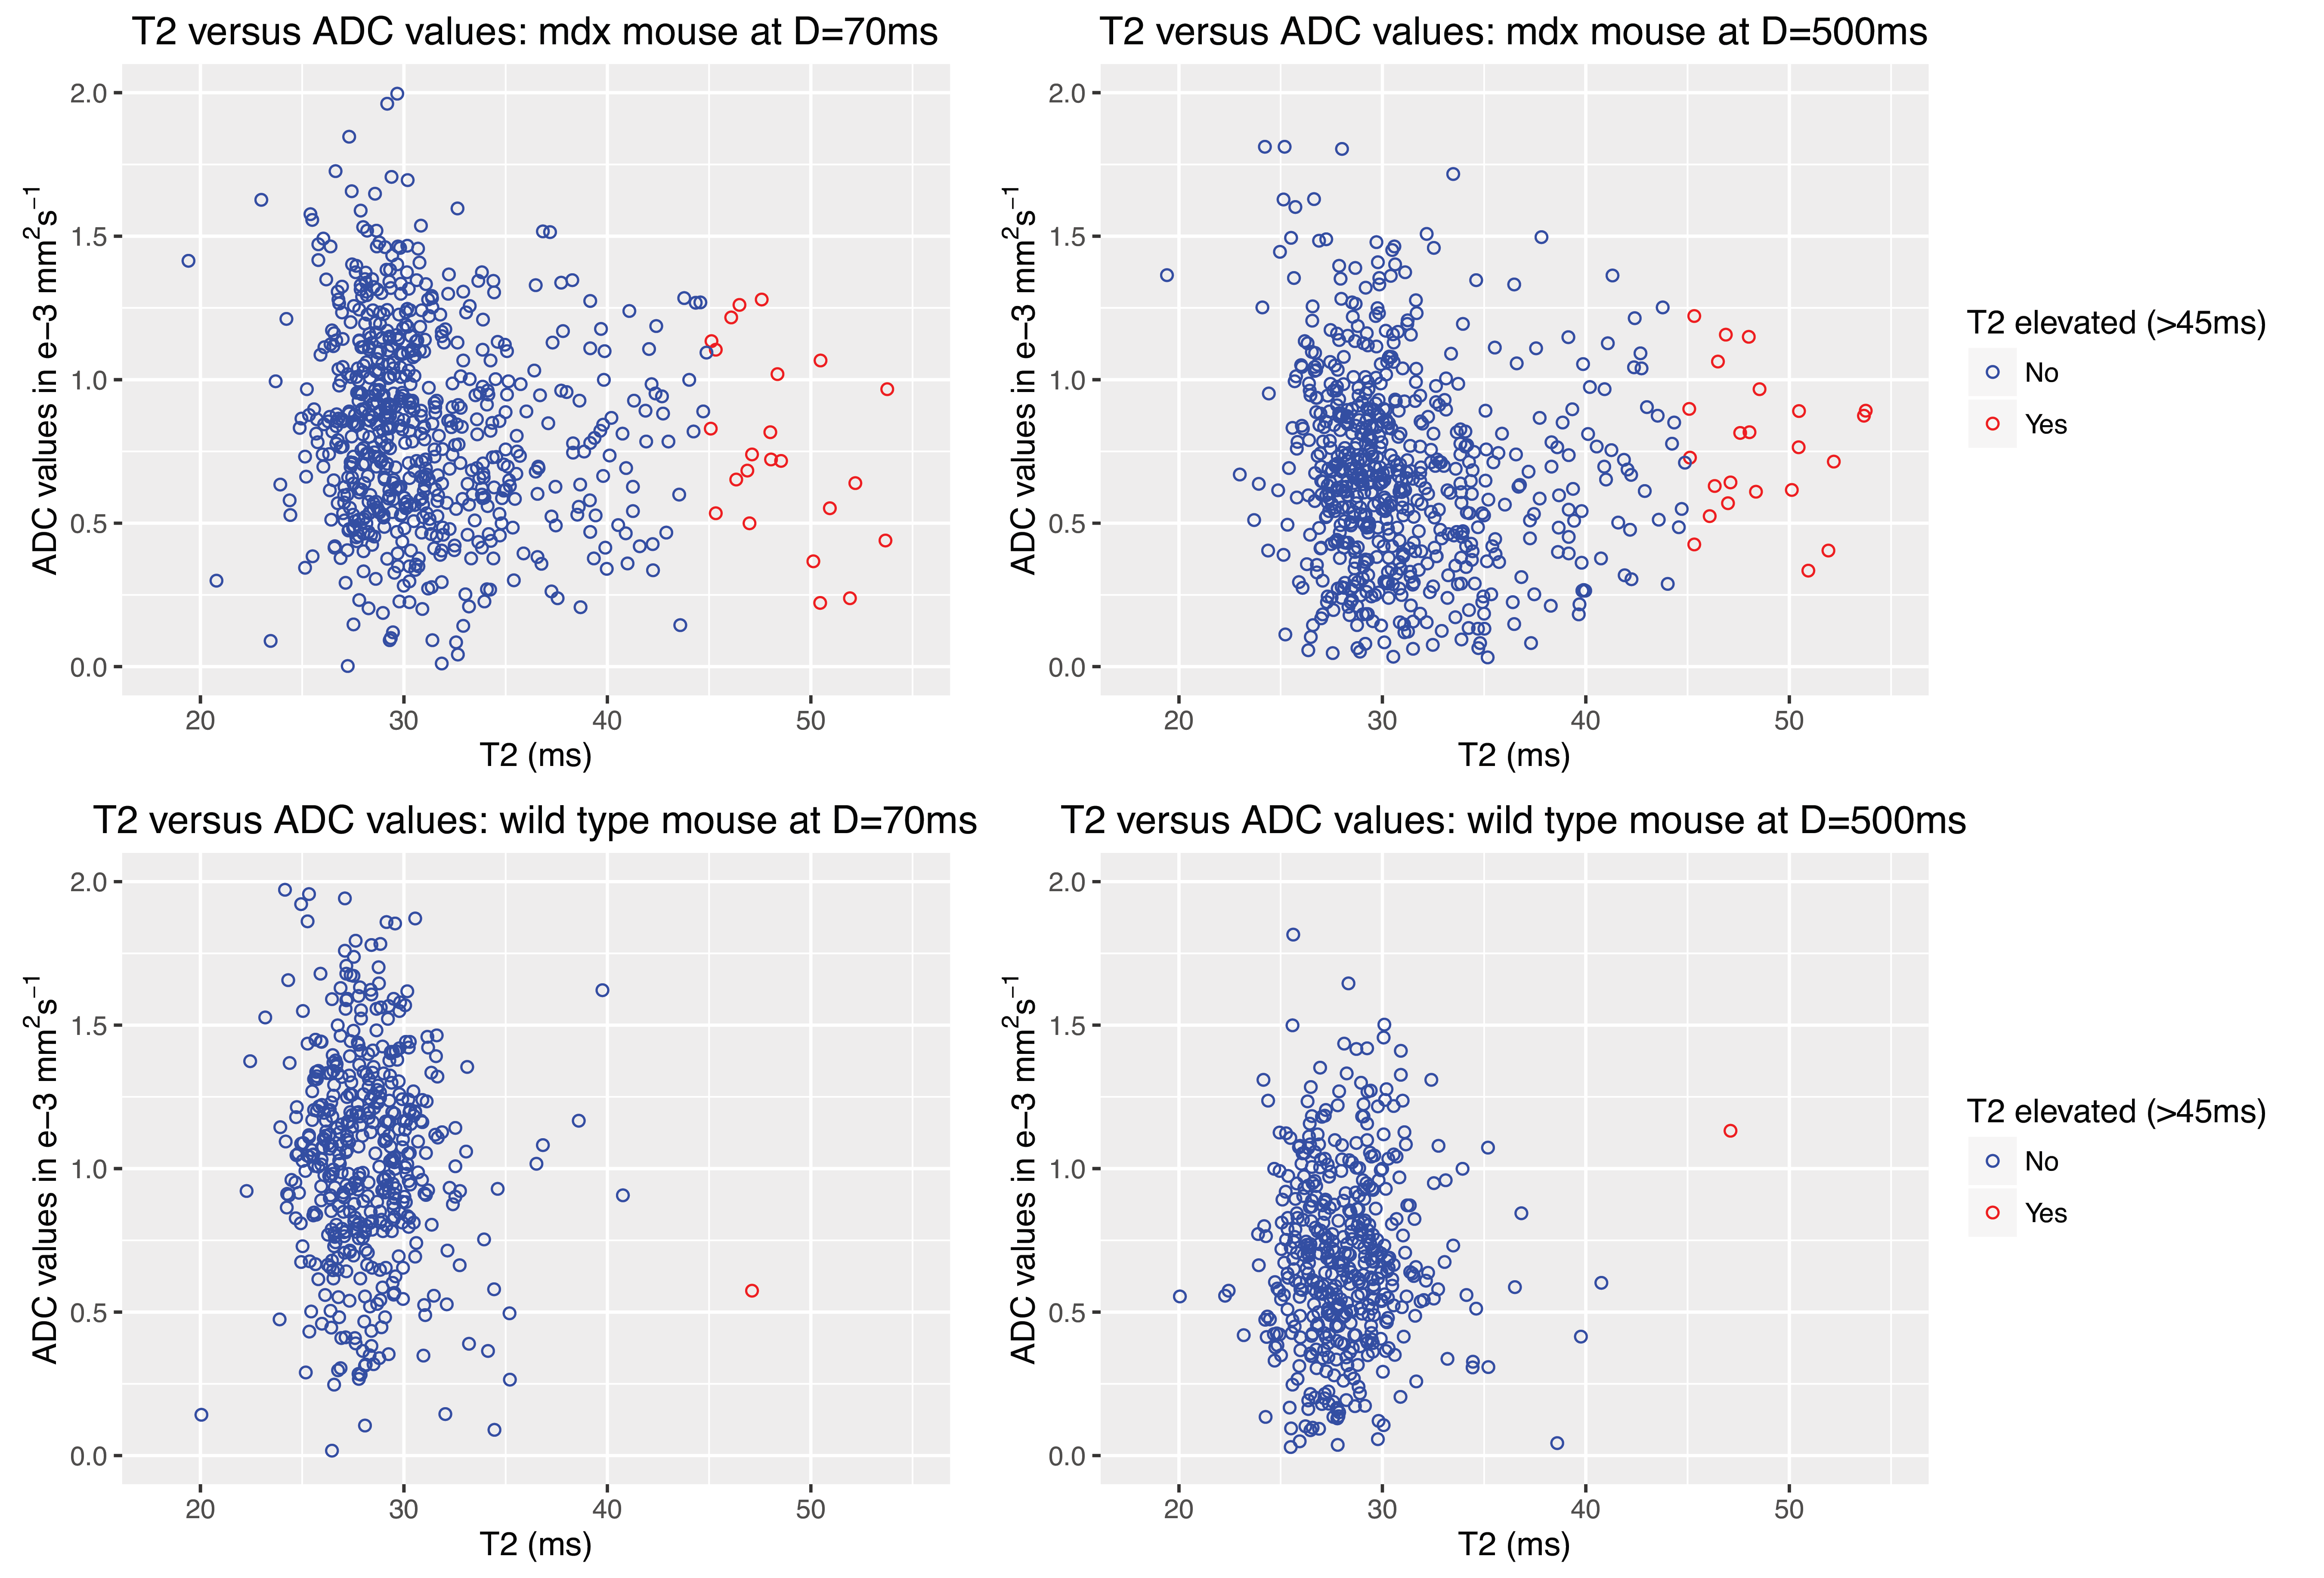
Scatter plots of T2 versus ADC values of one mdx and one wild type mouse for diffusion times D=70ms and D=500ms.
There was no correlation found between T2 and ADC values for both the mdx and the wild type mice. T2 values were divided into two groups: pixels with elevated values (>45ms) and non-elevated pixels. There was also no correlation found for the elevated hyperintense pixels.