1564
Noninvasive MRI Biomarkers for Muscular Dystrophy Progression in Young Muscle1Radiology, University of Washington, Seattle, WA, United States, 2Biochemistry, University of Washington, Seattle, WA, United States, 3Neurology, University of Washington, Seattle, WA, United States, 4Senator Paul D. Wellstone Muscular Dystrophy Cooperative Research Center, University of Washington, Seattle, WA, United States, 5Medicine, University of Washington, Seattle, WA, United States
Synopsis
Muscular dystrophy is a family of inherited diseases characterized by progressive muscle weakness that leads to muscle damage and wasting, and in the case of Duchenne muscular dystrophy (DMD), is fatal. Clinical measures of muscular dystrophy rely on surgical biopsy, which is invasive and provides a limited overview of the disease’s progression. Magnetic resonance imaging (MRI) may provide valuable information pertaining to tissue characteristics of this disease. We performed multi-parametric MRI to assess the changes in young dystrophic mice. The changes observed in skeletal muscles demonstrate MRI parameters may be used to track disease progression and future treatment options.
Purpose
Duchenne muscular dystrophy (DMD) is the most prevalent forms of muscular dystrophy affecting approximately 1 in every 3600 male infants with an average life expectancy of 25 years.1,2 Regardless of the therapy model, assessment of the tissue characteristics has been done by surgical biopsy which fails to provide detailed information about the whole muscle. The emergence of multi-parametric Magnetic Resonance Imaging (MRI) has provided an alternative means for acquiring tissue information without the same limitations. In young dystrophic mice specifically, a period of cyclical changes has been observed 3,4 but not characterized for possible treatment at such an early age. The goal of this study was to evaluate and characterize changes in muscle tissue characteristics in younger mice using MRI to better understand the progression of the disease in these early stages and to set a potential therapy plan exploring the possibility of better treatment outcomes.Methods
There were 25 B6Ros.Cg-Dmdmdx-4Cv/J (abbreviated mdx4cv or mdx) mice along with 5 age matched normal C57BL/6J mice that were 3 weeks of age when used for this study. 20 mdx mice, along with the 5 control mice, were imaged at 3, 5, 7, 9, and 11 weeks of age (longitudinal groups). The mice were imaged on a Bruker 14T Avance MR spectrometer (Bruker Corp., Billerica, MA). The high resolution MRI protocol includes scout imaging (gradient echo; TR (repetition time)/TE (echo time) = 100/3.42 ms), planning for image planes (multi-slice RARE (rapid acquisition with refocused echoes): TR/TE = 667.54/4.47 ms), high resolution 2 dimensional imaging with 55 thin slices (200 micron thick) (multi-slice RARE: TE/TE = 5031.363/10 ms) for muscle volume evaluation, multi-slice images with refocused echoes for T1 measurements (TR/TE = 5500, 3000, 1500, 1000, 385.8/9.66), multi-slice multi-echo imaging (TR/TE = 4000/6.28 – 75.4 ms, 12 echoes with 6.28 ms spacing) for transverse relaxation time T2 measurements, magnetization transfer (MT) imaging (gradient echo; TR/TE = 938.94/2.28 ms, flip angle = 30°), and diffusion imaging with a b value of 1000 s/mm2 (TR/TE = 3751/27.5 ms). All mice were euthanized at the completion of imaging with the leg tissues harvested for histology.Results
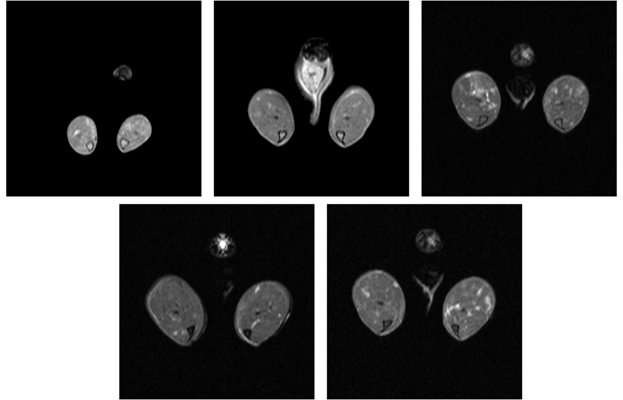
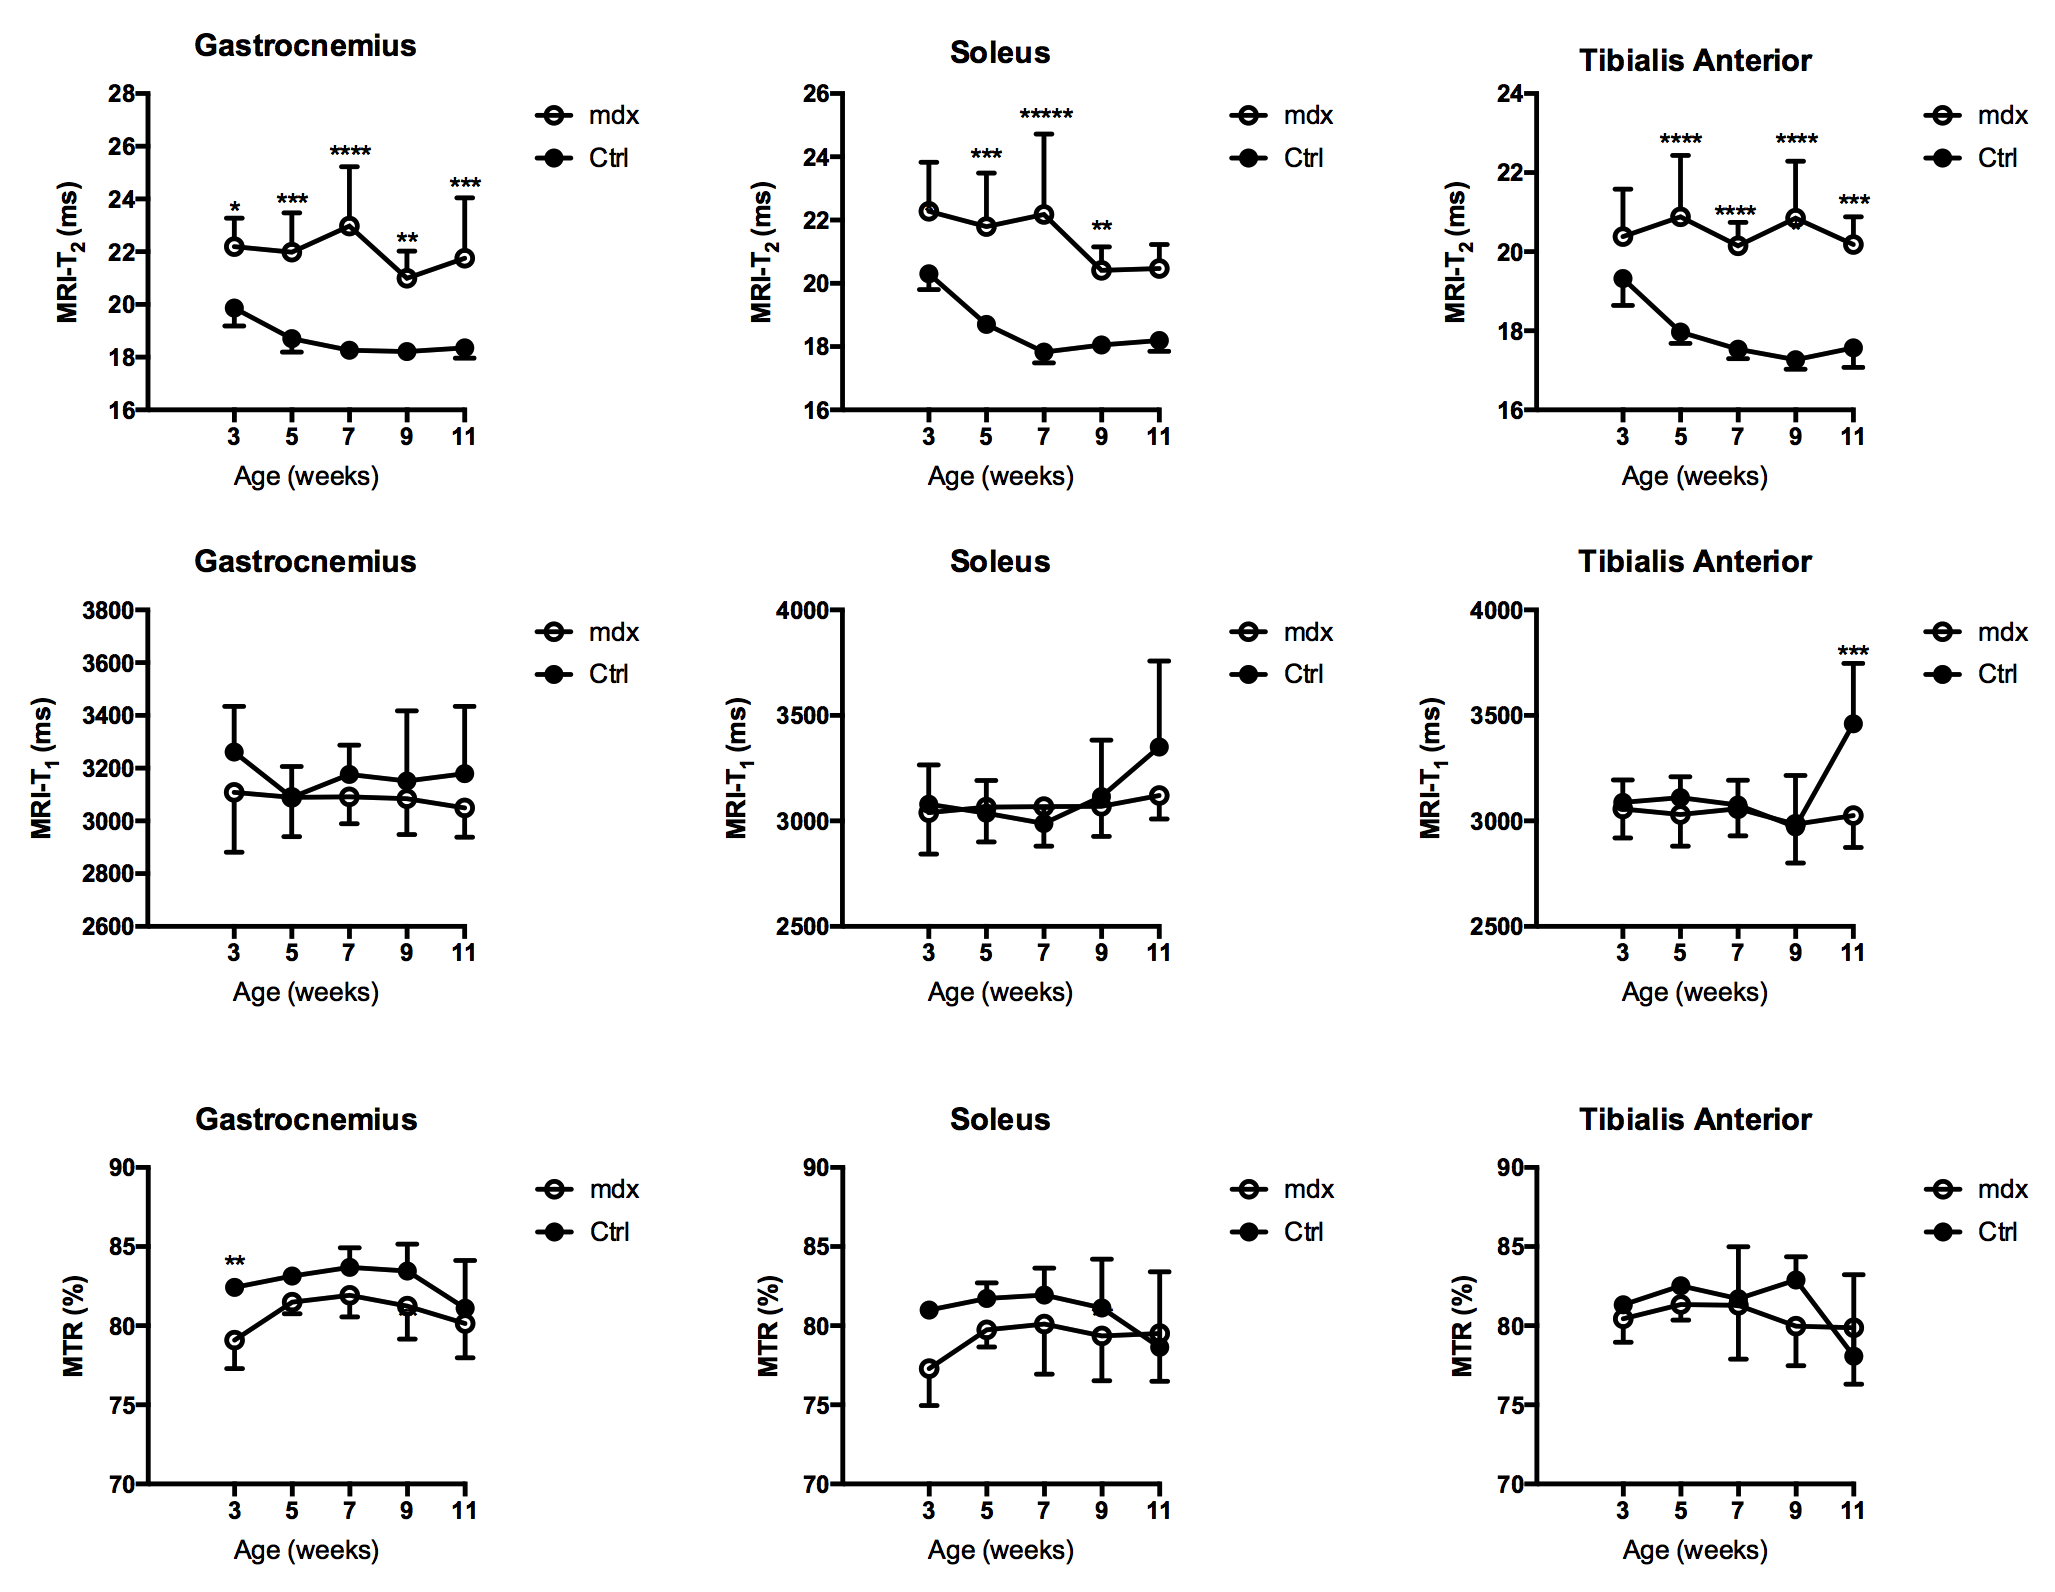
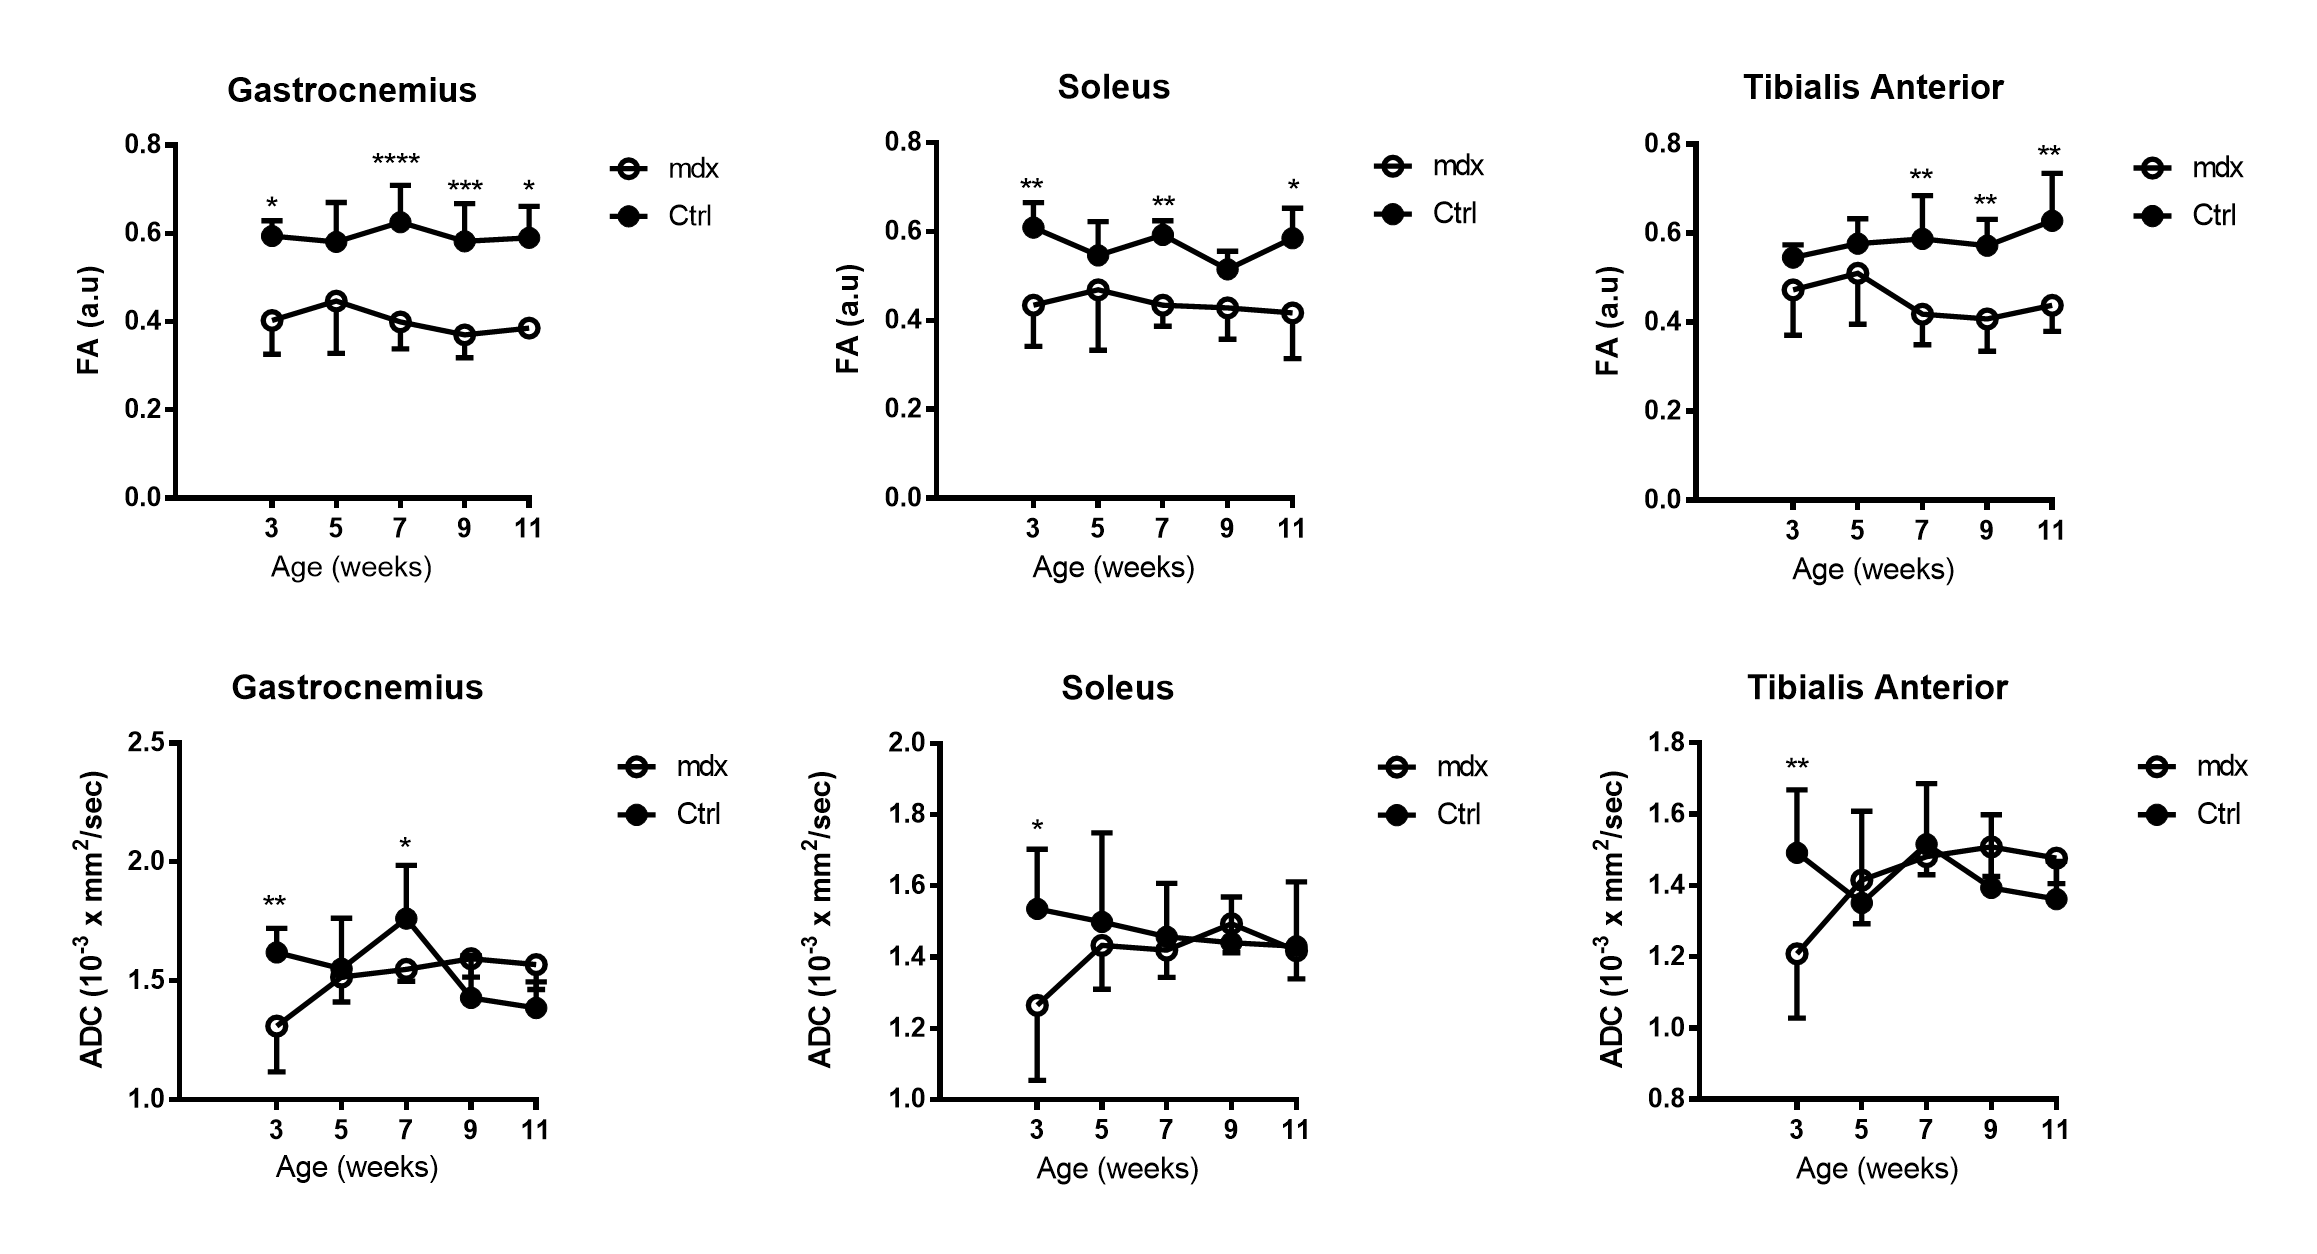
Figure 1 displays the longitudinal progression of one mdx mouse from the 3-week timing point to the end timing point of 11 weeks of age. There were significant differences between the groups when analyzing the results of the T2 (Figure 2). The T2 measurements in the normal mice displayed an average of approximately 10% in decreases between the first and final timing points across all three muscle types (Tibialis Anterior (TA), Gastronemius GA), and Soleus (SOL) muscles) in both legs. In the mdx mice, the average percent change in the muscle types was far more variable (i.e. 4% decrease of T2 in the left TA muscle vs .62% decrease in the right TA muscles, 4.5% decrease in the left GA vs 5.1% increase in the right GA, and 8% decrease in the left SOL vs 11.7% decrease in the right SOL). Additionally, the GA muscles showed the most significant differences in the fractional anisotropy analysis with more moderate significant differences in the TA and SOL (Figure 3). T1, MT ratio, and diffusion values in the mdx mice displayed a variance in values which eventually came to mirror the control group at the final time point of 11 weeks.Discussion
The measurements of the TA, GA, and SOL muscles showed significant differences in the T2 when comparing the mdx group against the control. This confirms research which showed great sensitivity in T2 measurements.5 The normal mice displayed a decreasing T2 trend while the mdx mice underwent increases and decreases in values observed (Figure 2). This is expected as reported in the younger mdx mice, there are cycles of inflammation, necrosis, and regeneration occurring with the lowest levels near 12 weeks of age.3,4 Additionally, while there were differences in the hyper-intense regions between the left and right legs of the mdx mice, there was no significant, quantifiable difference in the measurements. Between the legs of the mice themselves, neither mdx nor the control groups displayed any significant differences between the right or left legs. These observations and measurements could be explored and validated with comparisons to histological measurements for a more nuanced understanding of the cellular change.Conclusion
The multi-parametric MRI demonstrated that between the mdx and normal groups, there were quantifiable differences that could be identified and monitored. Similar MRI protocols could be explored and utilized as a noninvasive means of tracking disease progression and treatment response in future clinical trials of muscular dystrophy treatment.Acknowledgements
We would like to acknowledge the Muscular Dystrophy Association (MDA) for their supportReferences
1. Emery AE. The muscular dystrophies. Lancet 2002;359(9307):687–95.
2. Rall S, Grimm T. Survival in Duchenne muscular dystrophy. Acta Myol. 2012 Oct;31(2):117-20.
3. Pratt SJ, Xu S, Mullins RJ, Lovering RM. Temporal changes in magnetic resonance imaging in the mdx mouse. BMC research notes. 2013 Jul 9;6(1):262.
4. Vohra RS, Mathur S, Bryant ND, Forbes SC, Vandenborne K, Walter GA. Age-related T2 changes in hindlimb muscles of mdx mice. Muscle & nerve. 2016 Jan 1;53(1):84-90.
5. Park J, Wicki J, Knoblaugh SE, Chamberlain JS, Lee D. Multi-parametric MRI at 14T for muscular dystrophy mice treated with AAV vector-mediated gene therapy. PloS one. 2015 Apr 9;10(4):e0124914.
Figures