1563
Quantitative Evaluation of T2 Signal Intensity for the Assessment of Muscle DenervationParina H. Shah1, Erin C. Argentieri1, Matthew F. Koff1, and Darryl B. Sneag1
1Radiology and Imaging, Hospital for Special Surgery, New York, NY, United States
Synopsis
Presence and severity of muscle denervation due to peripheral neuropathy are conventionally evaluated using needle electromyography (EMG); the results of which are critical in the diagnosis of nerve injury and prognosticating nerve recovery. Routine MRI can confirm the presence of denervation but is unable to quantify severity and relies on qualitative detection of diffuse T2-weighted signal hyperintensity of the muscle and fatty infiltration (if chronic). This pilot study explores the role of T2 mapping in the diagnosis denervation and for quantification of severity. T2 mapping may be an important complement to EMG results, particularly given the drawbacks associated with EMG.
Purpose
MRI is a powerful diagnostic tool for accurately localizing peripheral nerve pathology and as a screening tool to evaluate muscle quality and specifically regional denervation changes. Needle EMG is the current gold standard to assess muscle function, but drawbacks include its invasive nature, operator dependence and associated intra- and inter-observer inconsistency, and the requirement of individually testing each muscle. Additionally, denervation is only reliably detected by EMG 1-4 weeks following injury to allow Wallerian degeneration to take effect [1]. Denervation changes on MRI are reported to manifest as diffuse muscle T2 signal hyperintensity as little as 24 hours following nerve injury [2-8]. Anecdotally, however, in the experience of the authors of this abstract, signal hyperintensity in the very acute stage may be absent or very subtle and can therefore be missed, particularly when images are not tightly windowed. Conventional MRI can also only qualitatively assess the presence or absence of denervation and cannot determine severity, unless there is reduced muscle bulk and/or fatty infiltration. These latter two findings are typically seen in the more chronic phase of denervation (i.e. > 6 months post injury) [6]. This pilot study’s object was to use quantitative T2 mapping to evaluate muscle denervation and correlate results with conventional MRI sequences and EMG.Methods
This was an IRB-approved retrospective study of 10 subjects (3F/7M, Age = 52.2±10.1 years) who presented to the neuromuscular clinic for evaluation of peripheral neuropathy. Studies included were: 6 knees, 2 elbows, 1 humerus, and 1 shoulder. Image Acquisition: All scans were performed on a clinical 3T scanner (GE Healthcare, Waukesha, WI). Standard-of-care peripheral nerve MRI involved multiplanar T2-weighted Dixon fat suppression and proton density pulse sequences and the addition of a commercially available quantitative T2 mapping sequence. T2 mapping parameters: TR: 1000ms, 8 TEs: 10-90 ms with ΔTE=10ms, FOV: 10-20 cm, acquisition matrix: 320 x 256 mm, receiver bandwidth: ± 62.5 kHz. Concurrent EMG data were available for 9 subjects and muscle recruitment patterns were graded on EMG from least to greatest response as: normal, reduced, discrete and none. Image Evaluation: Affected muscles were graded qualitatively on MRI by their degree of T2-weighted signal intensity: none, mild, moderate and severe. Regions of interest (ROIs) of uniform size for both the injured (~25 mm2) and an unaffected (~50 mm2) muscle, the latter to serve as a control, were placed on T2 maps (Figure 1). Statistical Analysis: A Signed Rank test was performed to detect differences of T2 between affected and control muscles. A Kruskal-Wallis test was performed to detect differences of T2 by degree of denervation. A Spearman rank correlation coefficient was performed to correlate T2 values with EMG’s muscle grading. Significance was set at p<0.05.Results
Denervated muscles exhibited significantly greater T2 values (53.1 ms ±18.4ms) in comparison to T2 values found within normal, unaffected muscle (39.7 ms±5.8 ms), p<0.002. Though T2 values were not significantly different across the degree of denervation (p<0.11) they were positively correlated with EMG grades of muscle recruitment (ϼ =0.53, p< 0.02). A significant correlation was also found between average T2 values and the degree of denervation qualitatively assessed by MRI (p< 0.05) (Figure 2).Discussion
Muscle denervation is associated with biochemical changes within its structure including: enlargement of the intramuscular capillary bed, increase in muscle blood volume, decreased muscle fiber diameter and quality of contractile elements, fatty infiltration, and increased extracellular fluid content. As T2 values are largely the result of spin-spin interactions, they are tissue dependent, and the aforementioned changes within denervated muscle tissue will manifest as increased T2 signal intensity due to the relatively longer T2 characteristics of fat and water in comparison to muscle [2]. Denervated muscles within this study displayed these characteristic increases in T2 signal intensity and increases in T2 signal intensity corresponded with sequential increases in the level of denervation as assessed by qualitative MRI (Figure 2). A positive correlation, although not statistically significant (likely secondary to underpowering), was also found between T2 values and degree of denervation by EMG.Conclusion
Quantitative MRI may help to determine denervation severity at initial presentation and longitudinally. Though qualitative MRI assessment and average T2 values were correlated in this study, the earliest and most subtle changes associated with denervation are often difficult to reliably detect with qualitative MRI alone. Quantitative T2 mapping may aid in the early detection and diagnosis of denervation, and may also provide a means to reliably measure efficacy of targeted interventions and indirectly nerve regeneration. Further analysis of a larger, more homogenous sample is needed to draw any further conclusions.Acknowledgements
No acknowledgement found.References
1. Feinberg J. EMG: myths and facts. HSS J. 2006. Feb;2(1):19-21 2. Kamath S. Venkatanarasimha N. Walsh MA. Hughes PM. MRI appearance of muscle denervation. Skeletal Radiol. 2008. May;37Z(5):397-404. 3. Sallomi D. Janzen DL. Munk PL. Connell DG. Tirman PF. Muscle denervation patterns in upper limb nerve injuries: MR imaging findings and anatomic basis. AJR Am J Roentgenol. 1998. Sep;171(3):779-84. 4. Kim SJ et al. MR imaging mapping of skeletal muscle denervation in entrapment and compressive neuropathies. Radiographics. 2011. Mar-Apr;31(2):319-32 5. Vieira RL. Rosenberg ZS. Kiprovski K. MRI of the distal biceps femoris muscle: normal anatomy, variants and association with common peroneal entrapment neuropathy. AJR Am J Roentgenol. 2007. Sep;189(3):549-55. 6. Filosto M et al. MR neurography in diagnosing nondiabetic lumbosacral radiculoplexus neuropathy. J Neuroimaging. 2013. Oct;23(4):543-4. 7. Petchprapa CN et al. MR imaging of entrapment neuropathies of the lower extremity. Part I. The pelvis and hip. Radiographics. 2010. Jul-Aug;30(4):983-1000. 8. Donovan A. Rosenberg ZS. Cavalcanti CF. MR imaging of entrapment neuropathies of the lower extremity. Part 2. The knee, leg, ankle, and foot. Radiographics. 2010. Jul-Aug;30(4):1001-19.Figures
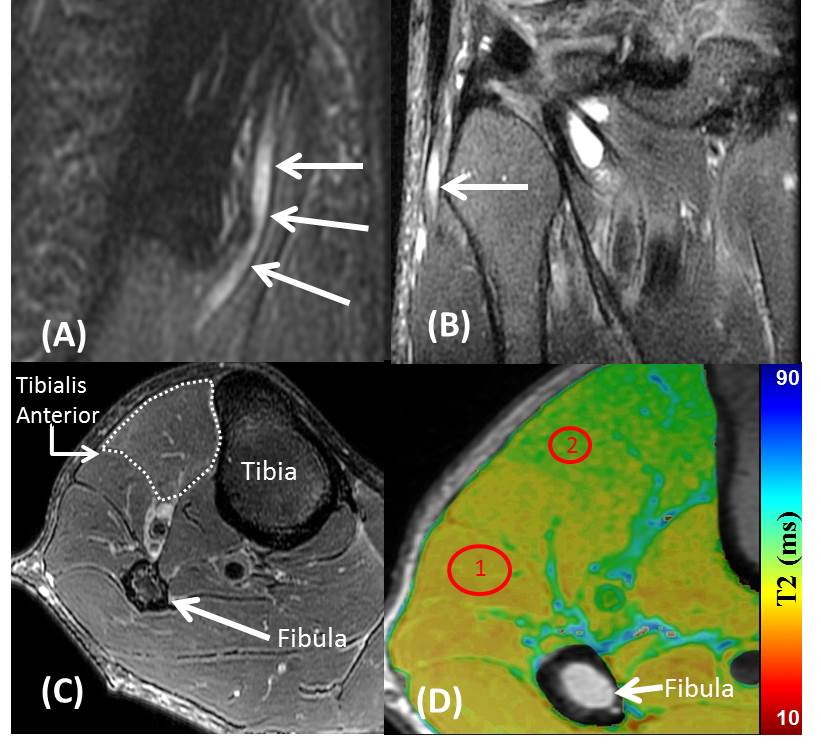
Figure
1. Oblique sagittal (A) and coronal (B) T2-weighted Dixon fat suppression MR
images demonstrate enlargement and signal hyperintensity (arrows) of common
peroneal nerve at the level of the fibular head. (C) Subtlety increased
T2-weighted signal intensity of the tibialis anterior muscle (outlined)
compared to normal regional muscles. (D) ROI #1 exhibits T2 signal of normal
muscle (38.2±1.5 ms) while R0I #2 contains the affected muscle and associated
T2 signal (49.8±1.9 ms)
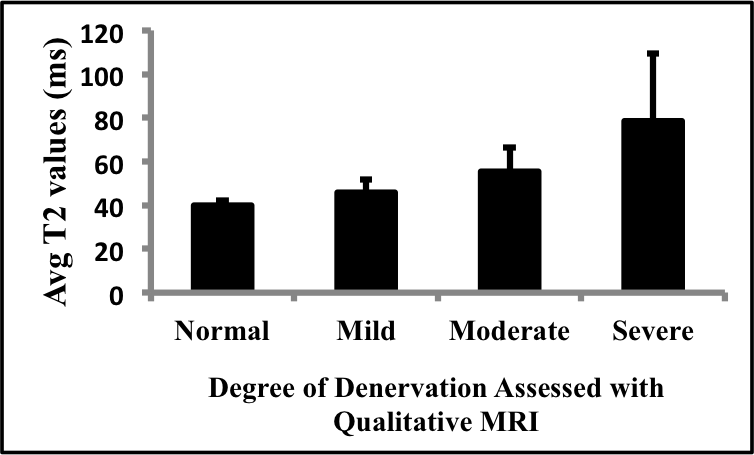
Figure
2: Positive correlation found between average T2 values and the qualitative MRI
assessment of the degree of denervation