1561
Regionally Dependent T2* Values of the Patellar Tendon in Collegiate Basketball PlayersErin C. Argentieri1, Parina H. Shah1, Ogonna K. Nwawka1, and Matthew F. Koff1
1Deparment of Radiology and Imaging - MRI, Hospital for Special Surgery, New York, NY, United States
Synopsis
Patellar tendinosis is a significant debilitation in collegiate and professional athletes that frequently leads to reduced performance. The quantitative magnetic resonance imaging (MRI) technique of T2* mapping is well suited to evaluate patellar tendinosis. This study evaluated regional differences of T2* values in collegiate basketball players pre-season. Short and long T2* values were both prolonged proximally, and no correlations were found with corresponding morphologic imaging. Continued longitudinal imaging will permit the evaluation of the development of tendinosis or micro-tears.
Purpose
Collegiate and professional athletes frequently display abnormal morphology on magnetic resonance images (MRI), even when asymptomatic (1-3). A recent study of asymptomatic male collegiate basketball players found that all subjects had at least one abnormal MRI finding, with patellar tendinopathy (PT) as most common finding (90% prevalence) (1). PT is a significant debilitation as the associated pain leads to reduced athletic performance (4,5). MRI is well suited to evaluate the patellar tendon in vivo, but tendons have short T2 values and exhibit little signal on traditional sequences. Only when the collagen is disrupted will it appear abnormal on FSE images, and subtle injuries may escape detection (6). Newer ultra-short echo (UTE) imaging sequences can visualize tendon (7,8) and also permit the calculation of T2*. This quantitative MRI (qMRI) technique can aid in the diagnosis of injuries, provide a means to reliably measure the efficacy of targeted treatment interventions, and better inform decisions on the most appropriate time for return to sport. We hypothesized that evaluation of the patellar tendons of asymptomatic subjects would reveal regional patterns of T2* values and that the presence of PT would correlate with the prolongation of T2* values in the affected region of the tendon.Methods
Following IRB approval with informed consent, local collegiate basketball players were enrolled: 10M, 19.8 ±1.0 y.o. (mean ±SD). Bilateral knee MRI scans were acquired for each subject using a clinical 3T scanner (GE Healthcare, Waukesha, WI) and an 8-channel phased array knee coil (Invivo, Gainesville, FL). Image Acquisition: 1) Multi-planar FSE for morphologic evaluation: TE: 25 ms, TR: 4000ms, FOV: 14-16 cm, slice thickness: 3.5 mm, matrix: 512x384 mm, NEX=2, RBW = ±62.5 kHz; 2) 3D-UTE-Cones for T2* calculations: TEs: 11 echoes between 0.03-12 ms, TR: 62 ms, Flip Angle: 12o, FOV: 16 cm, slice thickness: 3.0 mm, matrix: 256x256 mm, RBW: ±125 kHz. Total imaging time was 1 hour. Image Analysis: Qualitative grading of patellar tendinopathy was completed by a board-certified radiologist for three patellar tendon regions: superior, middle, inferior. Quantitative T2* values of the central third of the patellar tendon were calculated by fitting signal intensity to corresponding echo time using a bi-linear exponential fitting: SI (TE) =A·exp(-TE/T2*S) + B·exp(-TE/T2*L)+noise, where T2*S and T2*L are the short and long T2* components, respectively, and A and B are the corresponding short and long apparent proton densities. The short (PS) and long component (PL) fractions were calculated as A/(A+B) and B/(A+B), respectively. All calculated variables were subdivided into three regions (superior, middle, inferior) for localized analysis and comparison to morphologic grading. Statistical Analysis: A two way repeated ANOVA was performed to evaluate the interactions of leg (right, left) and region (superior, middle, inferior) on T2*S, T2*L, PS and PL. Spearman correlations were performed to evaluate the relationship between T2*S, T2*L, PS and PL and MRI grade of tendinopathy in each region. Significance was set to p<0.05.Results
A minimal, ~2%, but significant, p=0.04, difference of PS and PL was found between left and right legs. T2*S, T2*L, PS and PL differed by region, p<0.02 (Figure 1 and Table 1). T2*S was prolonged proximally and significantly longer than middle and inferior regions, p<0.009. T2*L was also prolonged proximally, but only significantly greater than the inferior region, p=0.013. PS was lowest, p<0.0001, with corresponding highest PL value in the proximal region. No significant correlations were found between calculated variables and corresponding morphologic grades in any region.Discussion
This study of young collegiate basketball players found regional variations of T2*S and T2*L within the patellar tendon. The lack of correlation of qMRI metrics with morphologic evaluation may be due to timing: biochemical changes which affect T2*S and T2*L (9) at the pixel level likely precede gross morphologic changes. Future analysis of the data will be enhanced by examining qMRI metrics across the entire patellar tendon aside from the central third. These qMRI data represent normative values for a population of young, asymptomatic, elite athletes. The images were obtained during the athletes’ pre-season as a baseline observation for future comparison to imaging performed at the completion of the basketball season. We anticipate the continued evaluation will permit a qualitative and quantitative narrative of the development of tendinosis or micro-tears.Conclusion
This study showed that quantitative T2* mapping is sensitive to the inherent anatomic variation present within the patellar tendon, but do not correlate with morphologic evaluation. Continued enrollment and longitudinal examination of this young athletic cohort will evaluate changes of T2* at the conclusion of the regular sports season.Acknowledgements
The authors would like to thank Liza Morales and Roseann Zeldin for their assistance in performing this study. Funding for this study was provided by the GE-NBA Co-Initiative for Tendinopathy.References
1. Pappas GP, Vogelsong MA, Staroswiecki E, Gold GE, Safran MR. Magnetic Resonance Imaging of Asymptomatic Knees in Collegiate Basketball Players: The Effect of One Season of Play. Clinical journal of sport medicine : official journal of the Canadian Academy of Sport Medicine 2016;26:483-489. 2. Kaplan LD, Schurhoff MR, Selesnick H, Thorpe M, Uribe JW. Magnetic resonance imaging of the knee in asymptomatic professional basketball players. Arthroscopy : the journal of arthroscopic & related surgery : official publication of the Arthroscopy Association of North America and the International Arthroscopy Association 2005;21:557-561. 3. Major NM, Helms CA. MR imaging of the knee: findings in asymptomatic collegiate basketball players. AJR. American journal of roentgenology 2002;179:641-644. 4. Lian OB, Engebretsen L, Bahr R. Prevalence of jumper's knee among elite athletes from different sports: a cross-sectional study. Am J Sports Med 2005;33:561-567. 5. Cook JL, Khan KM, Harcourt PR, Grant M, Young DA, Bonar SF. A cross sectional study of 100 athletes with jumper's knee managed conservatively and surgically. The Victorian Institute of Sport Tendon Study Group. Br J Sports Med 1997;31:332-336. 6. Gold GE, Pauly JM, Macovski A, Herfkens RJ. MR spectroscopic imaging of collagen: tendons and knee menisci. Magn Reson Med 1995;34:647-654. 7. Du J, Pak BC, Znamirowski R, Statum S, Takahashi A, Chung CB, Bydder GM. Magic angle effect in magnetic resonance imaging of the Achilles tendon and enthesis. Magn Reson Imaging 2009;27:557-564. 8. Robson MD, Gatehouse PD, Bydder M, Bydder GM. Magnetic resonance: an introduction to ultrashort TE (UTE) imaging. J Comput Assist Tomogr 2003;27:825-846. 9. Juras V, Winhofer Y, Szomolanyi P, Vosshenrich J, Hager B, Wolf P, Weber M, Luger A, Trattnig S. Multiparametric MR Imaging Depicts Glycosaminoglycan Change in the Achilles Tendon during Ciprofloxacin Administration in Healthy Men: Initial Observation. Radiology 2015;275:763-771.Figures
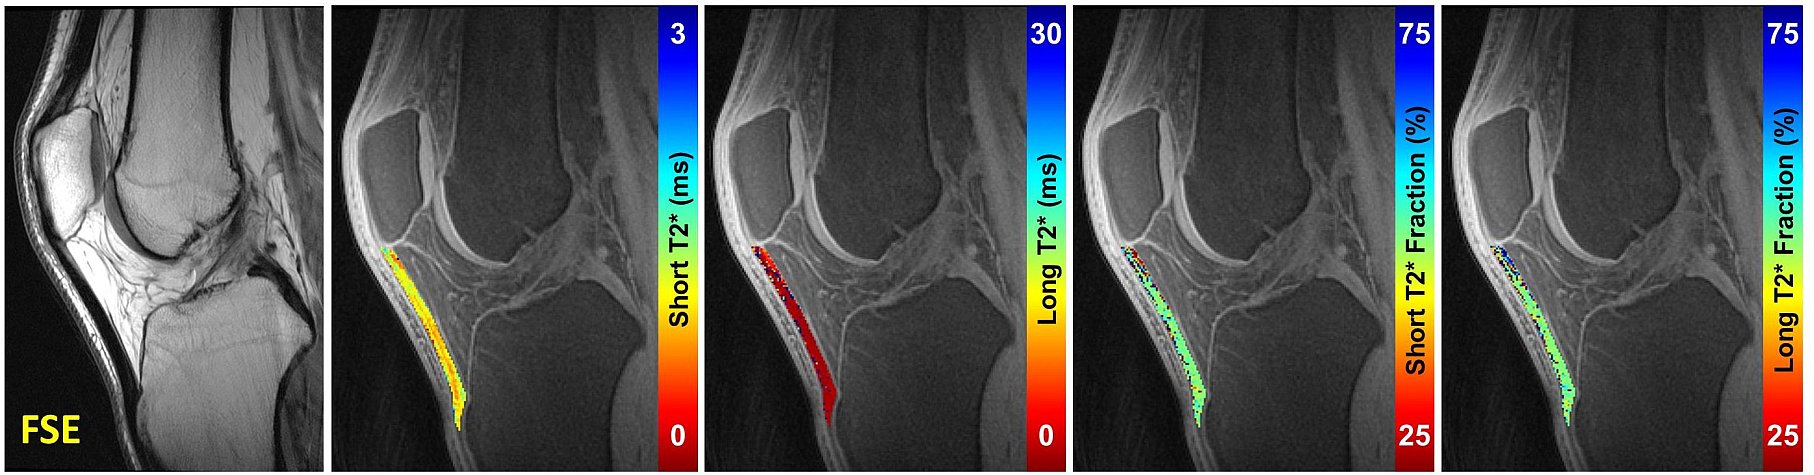
Figure
1. (Left to Right). Mid-sagittal morphologic 2D-FSE image of the knee
displaying the low signal intensity patellar tendon, and quantitative maps of
short T2* values, long T2* values, and short and long T2* fractions overlaid on
source 3D-CONES UTE images.
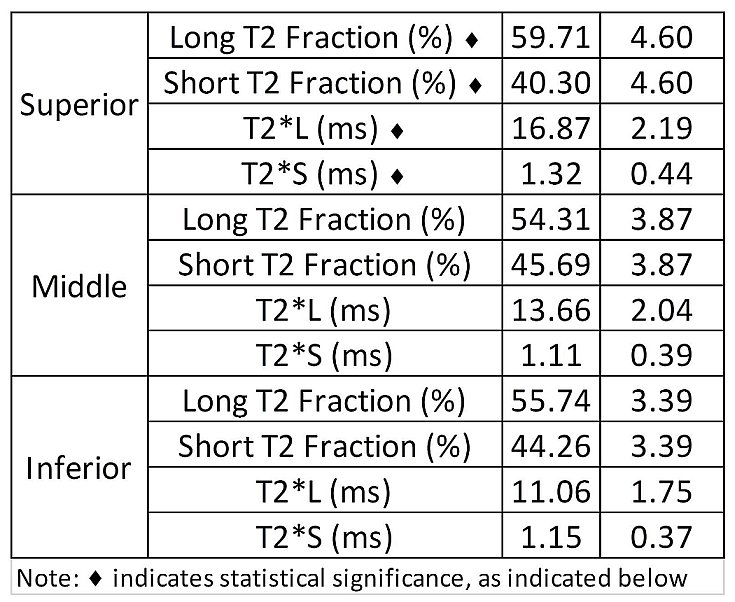
Table 1:
Summary statistics from ANOVA analysis. T2*S, T2*L, Short T2 Fraction (PS) and Long
T2 Fraction (PL) differed by region, p<0.02. T2*S was significantly
prolonged within the superior region as compared to middle and inferior regions
p<0.009. T2*L was also prolonged within the superior region, but only
significantly greater than the inferior region, p=0.013. PS was lowest,
p<0.0001, with corresponding highest PL value in the superior region.