1559
Zonal differences of T1rho and T2 relaxation times of the meniscus: comparison study between normal and osteoarthritis knees1Radiological Sciences, University of California Irvine, Orange, CA, United States, 2Orthopaedic Surgery, University of California Irvine, Orange, CA, United States
Synopsis
We compared the zonal differences of T1rho and T2 relaxation times of the meniscus in normal and osteoarthritis knees. Our study indicates that T1rho and T2 relaxation times in degenerative meniscus decrease and demonstrate more homogenous values throughout the meniscus.
Introduction
T1rho and T2 mapping are novel magnetic resonance imaging (MRI) sequences, which can evaluate collagen content and orientation, proteoglycan content, mobility of tissue water. However, few studies have been published about zonal differentiation of meniscal T1rho and T2 relaxation times in normal and osteoarthritis (OA) knee1,2. The purpose of this study was to investigate patterns of T2 and T1rho changes in normal and advanced OA patients.Methods
A total of 25 subjects were enrolled in this study, with a control of 20 young healthy volunteers (mean age, 29 years, age range, 19-38 years) without knee pain and 5 advanced OA patients scheduled for total knee arthroplasty (KL score of 3 or 4; mean age 70 years, range 62-90 years). The study protocol was approved by the Institutional Review Board, and all subjects gave written informed consent. All MR studies were performed on a 3T scanner (Achieva, Philips Healthcare, Netherlands) with an 8-channel knee coil. Three sagittal images were acquired including fat suppressed (FS) proton density-weighted imaging (PDWI), T1rho mapping, and T2 mapping sequences with true sagittal angulation parallel to the magnetic static field (B0). The acquisition parameters were as follows. FS PDWI: 2D turbo spin-echo; repetition time (TR)/echo time (TE)=4311/30 ms, number of excitation (NEX)=2, and total acquisition time=3 minutes 35 seconds. T1rho: 3D FS PROSET (PRinciple Of Selective Excitation Technique); TR/TE=6.4/3.4 ms, flip angle=10°, echo train length (ETL)=64, NEX=1, spin-lock frequency=575 Hz, time of spin-lock (TSL), 20, 40, 60, and 80 ms, and acquisition time=4 minutes 9 seconds × 4. All images were obtained with field of view (FOV)=140x140 mm, slice thickness/gap=3/0 mm, image matrix=512×512, number of slices=31 and effective in-plane spatial resolution=0.27×0.27 mm. T2 mapping: 2D turbo spin-echo; TR/TE=2700/13, 26, 39, 52, 65, 78, 91 ms, NEX=1 and total acquisition time=13 minutes 26 seconds. Segmentation of the meniscus was performed using MIPAV (Medical Image Processing, Analysis, and Visualization) software. The entire meniscus was segmented manually slice-by-slice by drawing polygon voxels of interest (VOI), number of excitation = 1. Lateral meniscus (LM) and medial meniscus (MM) were divided into anterior horn (LMAH, MMAH), posterior horn (LMPH, MMPH) and body (LMBD, MMBD) segments, respectively. Each meniscus was divided manually into superficial (the first layer of pixels of the VOI along meniscal surface) and deep (the remainder of the pixels of the VOI.) zones for horizontal zonal analysis (Figure 1). For vertical zonal analysis, the anterior and posterior horns of the meniscus were divided manually into three zones from the free edge to peripheral meniscus: white zone (inner 1/3), red-white zone (middle 1/3) and red zone (outer 1/3) (Figure). Average T1rho and T2 relaxation times between normal and OA menisci were assessed respectively. Each zonal distribution was also calculated and statistically analyzed.Results
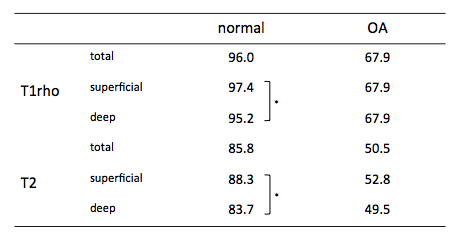
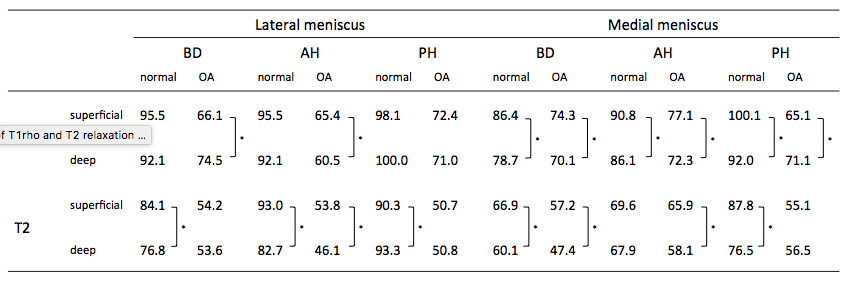
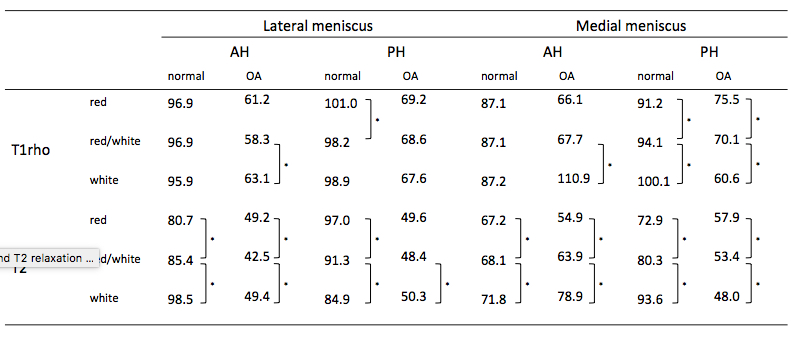
T1rho and T2 relaxation times were significantly higher in normal meniscus than advanced OA meniscus (table 1). In horizontal analysis, while T1rho relaxation times of superficial zone were significantly higher than those of deep zone in normal knee medial meniscus, no tendency was identified in advanced OA meniscus. T2 relaxation times of superficial zone were significantly higher than those of deep zone in most areas of normal meniscus and half of areas of advanced OA meniscus (table 1, 2). In vertical analysis, T1rho relaxation times tended to be random throughout all zones in normal and advanced OA menisci. T2 relaxation times linearly increased significantly from red to white zone in all areas except LMPH in normal meniscus, but only seen in MMAH in advanced OA meniscus (table 3).Conclusion
This study indicates that T1rho and T2 relaxation times in degenerative meniscus decrease and demonstrate more homogenous values throughout the meniscus. These differences may reflect changes related to water, collagen and glycosaminoglycan compositions in advanced OA meniscus.Acknowledgements
This study was supported by the National Center for Research Resources and the National Center for Advancing Translational Sciences, National Institutes of Health, through Grant UL1 TR000153.References
1. Subburaj K, Souza RB, Wyman BT, et al. Changes in MR relaxation times of the meniscus with acute loading: an in vivo pilot study in knee osteoarthritis. J Magn Reson Imaging. 2015; 41:536-43. 2. Calixto NE, Kumar D, Subburaj K, et al. Zonal differences in meniscus MR relaxation times in response to in vivo static loading in knee osteoarthritis. J Orthop Res. 2015; 30: 249-61
Figures
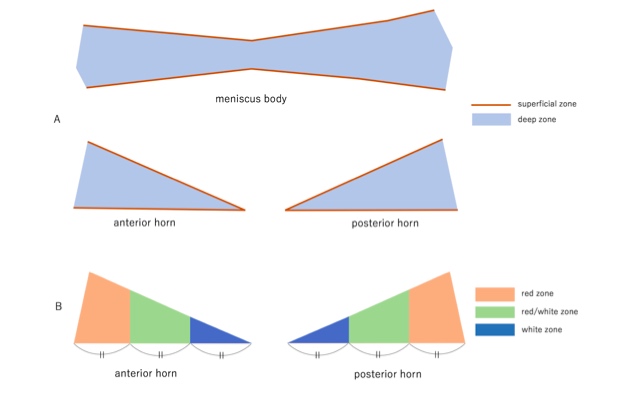
Zonal analysis of the meniscus.
A: In horizontal zonal analysis, superficial zone (brown) is the first layer of pixels of ROI along meniscal surface. Deep zone (blue) is the reminder of the pixels of ROI. B: In vertical zonal analysis, white zone (deep blue) is the inner 1/3, red/white zone (green) is the middle 1/3, and red zone (orange) is outer 1/3 of meniscus.