1558
Quantitative multiparametric relaxation time mapping of experimental model of osteoarthritis in the equine1Department of Applied Physics, University of Eastern Finland, Kuopio, Finland, 2Department of Diagnostic Radiology, Kuopio University Hospital, Kuopio, Finland, 3Research Unit of Medical Imaging, Physics and Technology, University of Oulu, Oulu, Finland, 4Medical Research Center Oulu, Oulu University Hospital and University of Oulu, Oulu, Finland, 5Department of Equine Sciences, Faculty of Veterinary Medicine, Utrecht University, Utrecht, Netherlands, 6Department of Orthopaedics, University Medical Center Utrecht, Utrecht, Netherlands, 7Department of Diagnostic Radiology, Oulu University Hospital, Oulu, Finland
Synopsis
In this study, sensitivity of several quantitative MRI (qMRI) parameters, namely T1, T2, continuous wave (CW) T1ρ, adiabatic T1ρ, adiabatic T2ρ and TRAFF were investigated for their sensitivity to secondary degenerative changes in equine articular cartilage specimens (n=13+6 lesions and controls, respectively) due to presence of surgically induced lesions in the adjacent tissue. Significant differences in relaxation times between ROIs in the secondary affected, lesion repair tissue and adjacent controls area or control animals were detected. The findings suggest that properties of cartilage are altered due to the presence of a lesion in adjacent tissue.
Purpose
Lesions due to acute trauma in articular cartilage are known to result in progressive degeneration in the surrounding tissue as well.1,2 The purpose of this study was to investigate the sensitivity of several quantitative MRI (qMRI) relaxation parameters (T1, T2, continuous wave (CW) T1ρ, adiabatic T1ρ, adiabatic T2ρ and TRAFF)3-8 to degenerative changes in articular cartilage due to adjacent lesions.Methods
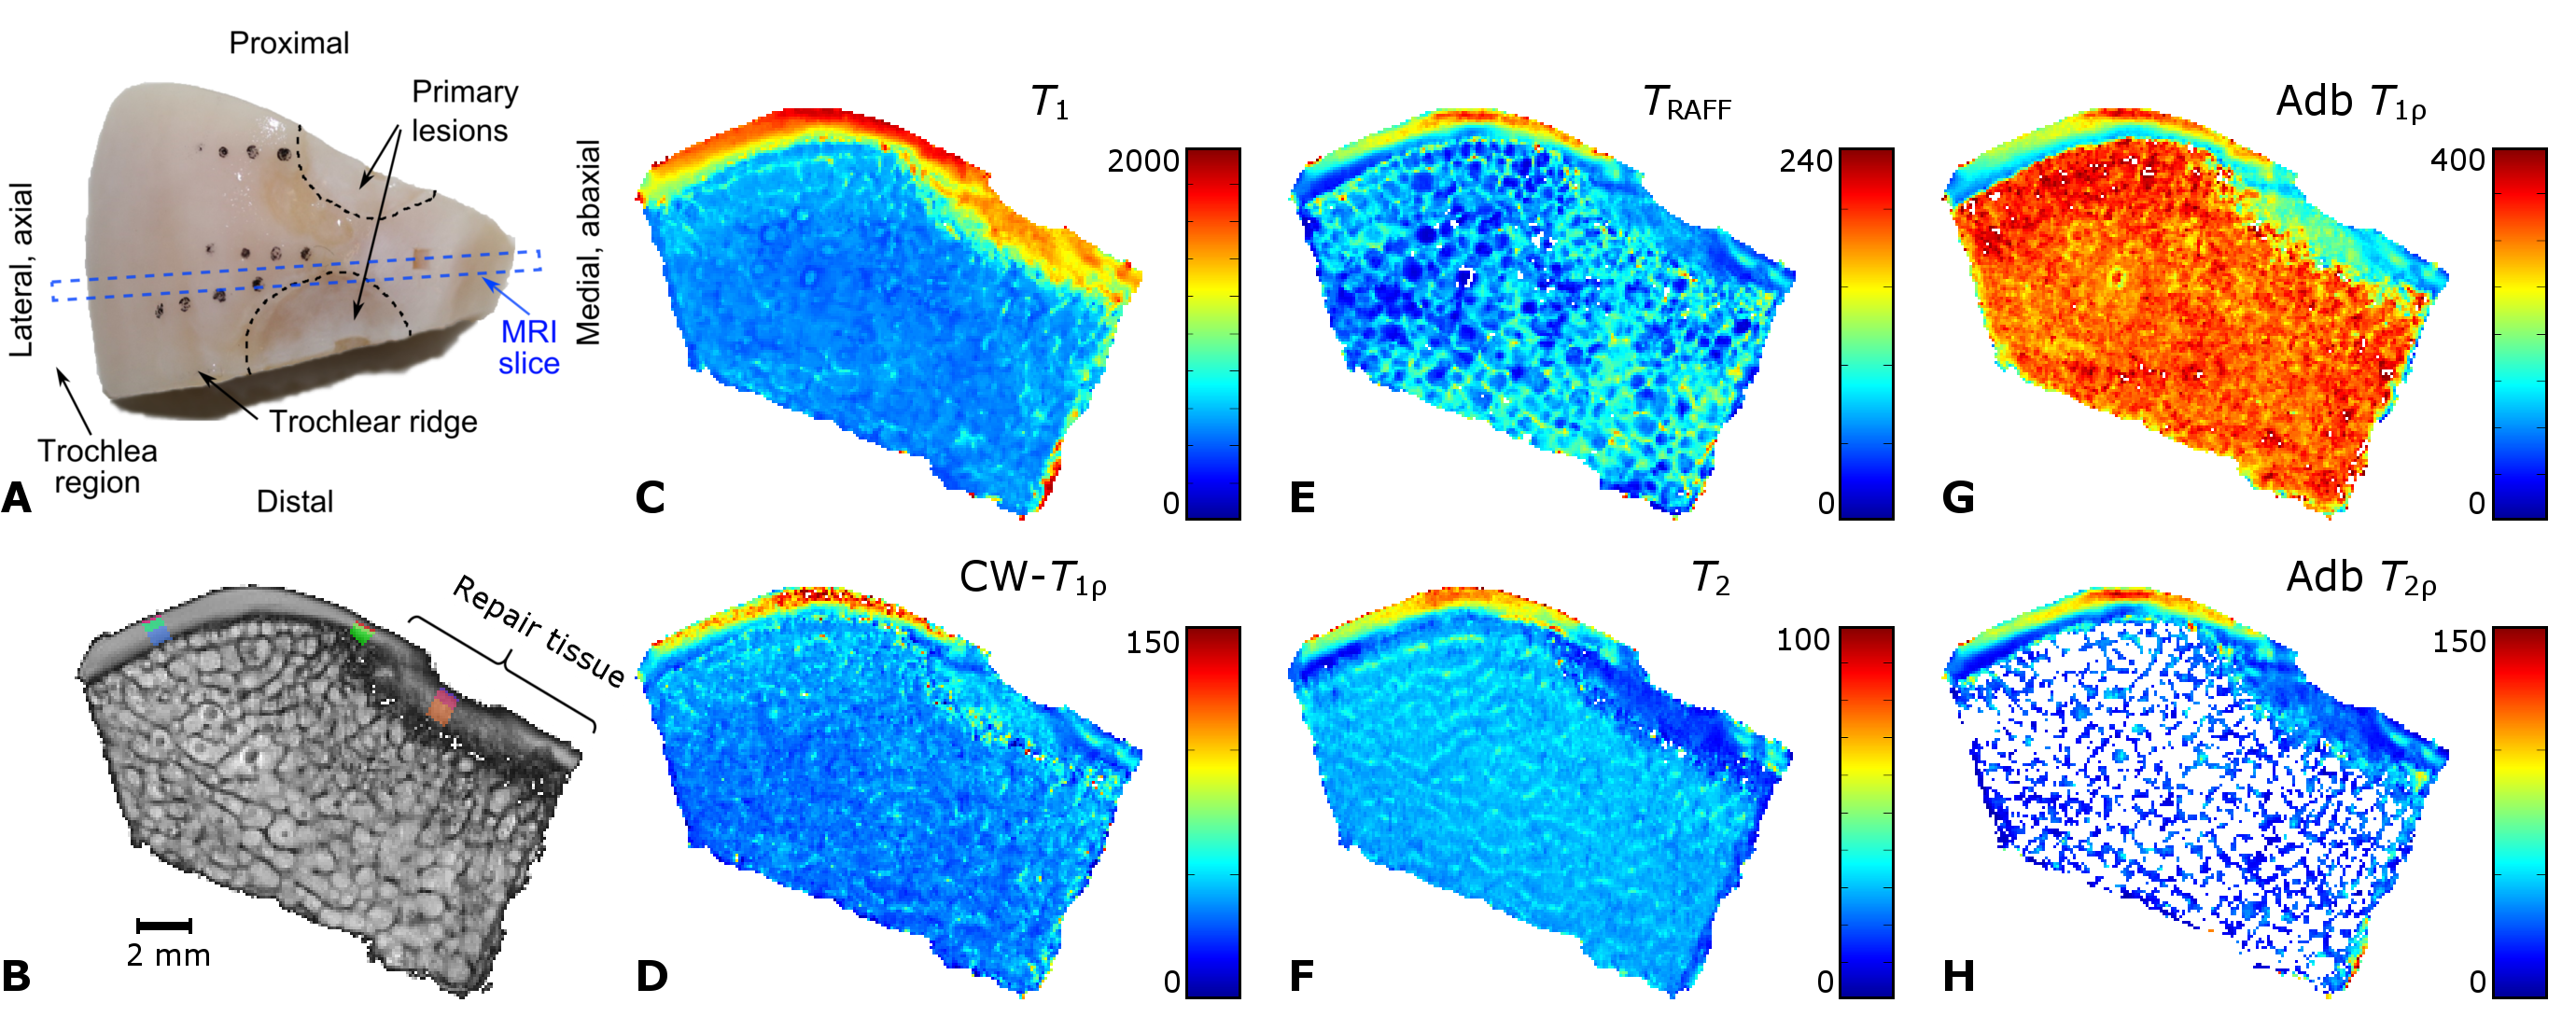
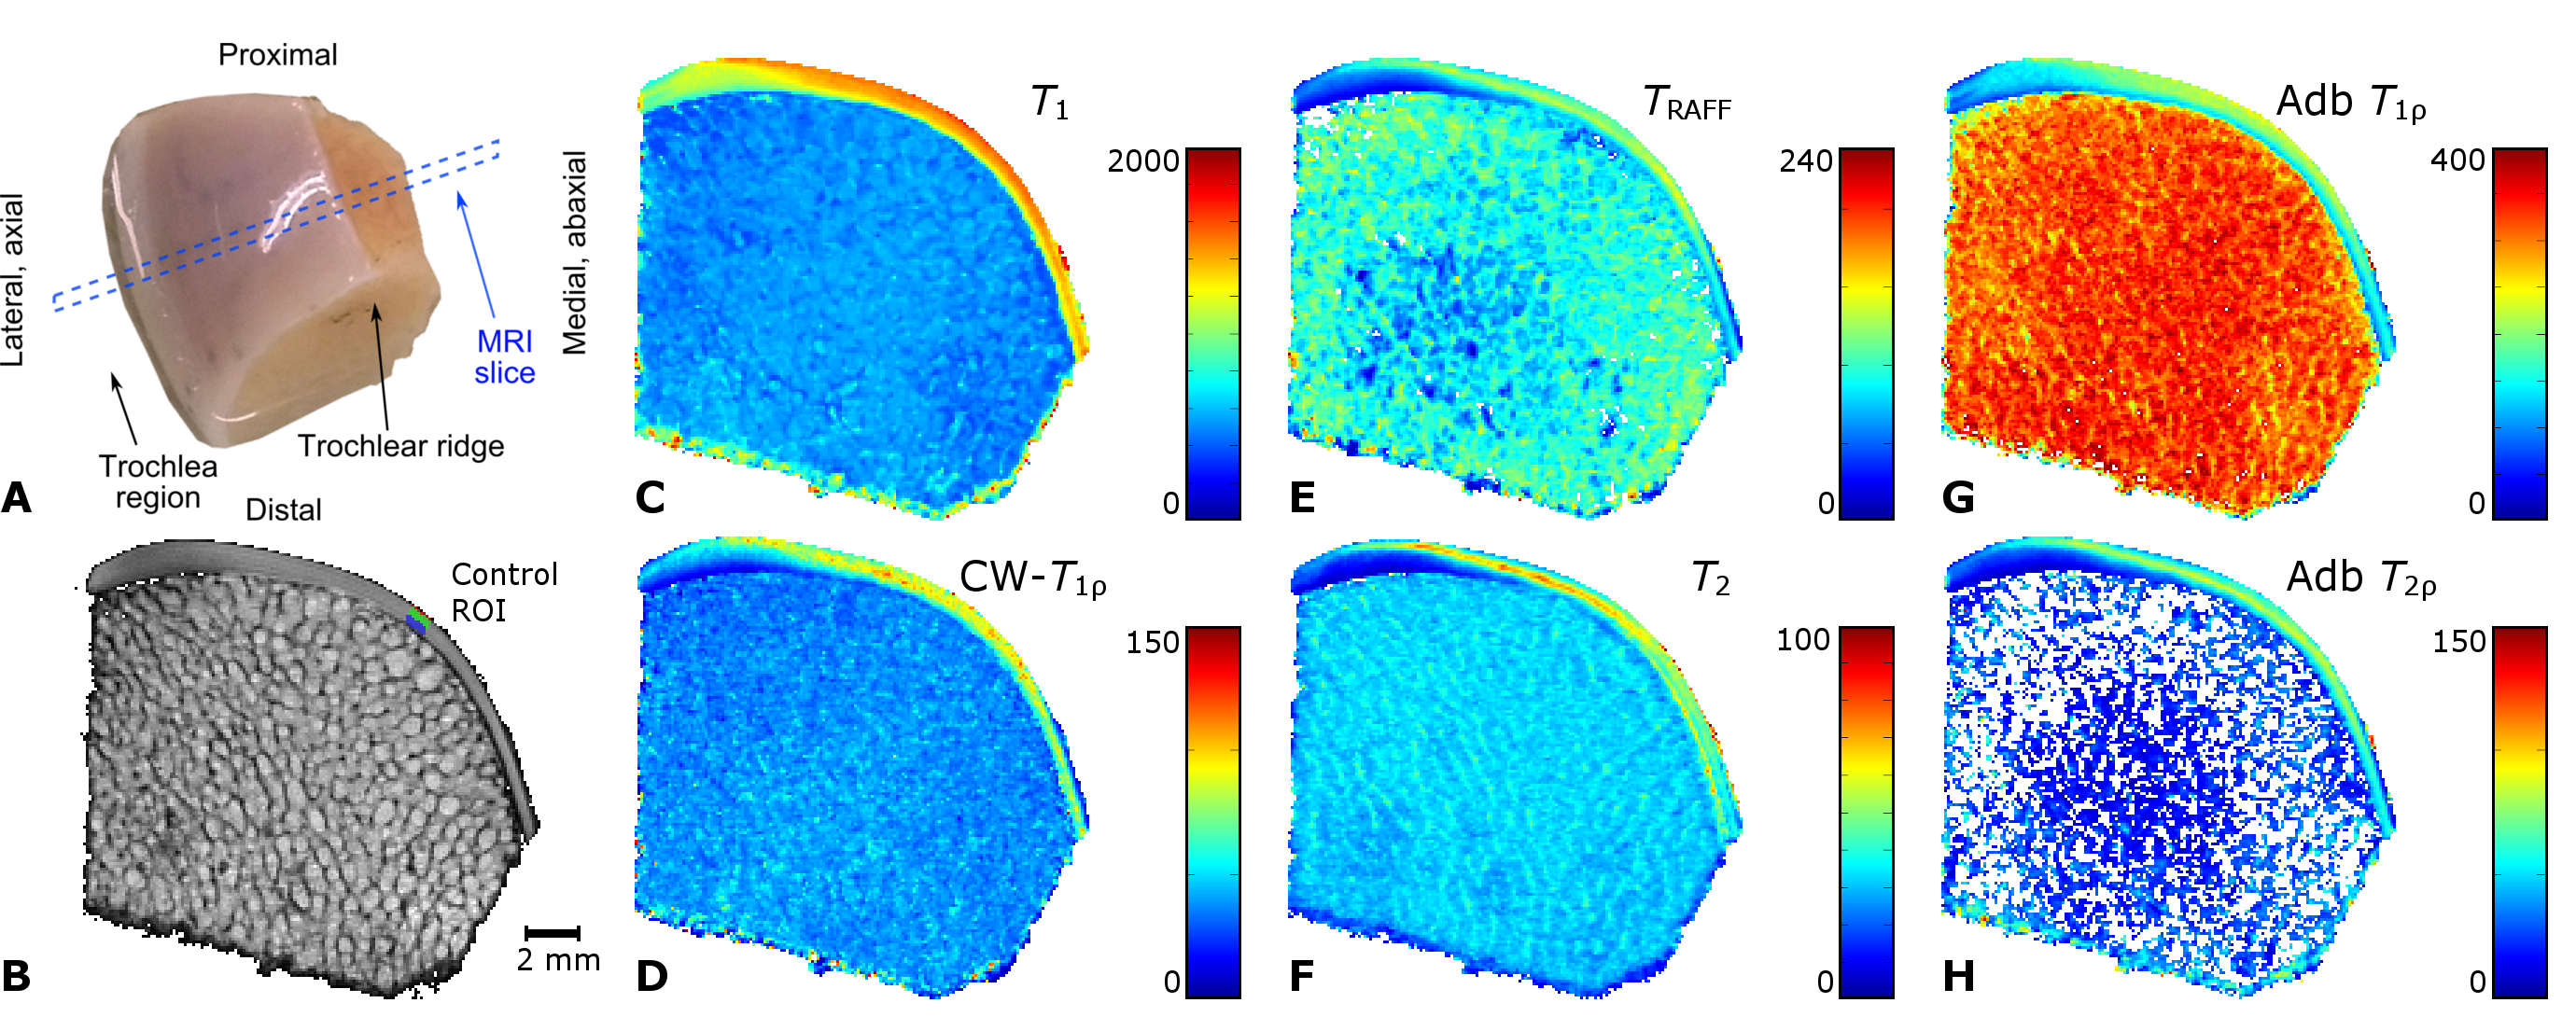
In both knees of Shetland ponies, two 10-mm diameter cartilage lesions were surgically created on the medial femoral ridges to study a variety of potential approaches for cartilage repair. After 12 months of healing, the animals were sacrificed and wedge-shaped tissue blocks from the femoral trochlea (n =13+6, 7 lesion and 3 control animals) were prepared (Figure 1a, 2a). The study had been approved by the local ethics committee of Utrecht University, in compliance with the Dutch Act on Animal Experimentation. The specimens were frozen after harvesting and thawed for the MRI experiments. For MR imaging, the specimens were immersed in perfluoropolyether (Galden HS240, Solvay, Brussels, Belgium) and placed inside a flexible latex container to allow optimal fitting inside the MRI coil. The specimens were oriented in such a way that the articular surface in the imaging region was parallel with the main magnetic field to minimize magic angle effects. The imaging was done at 9.4 T, using a Varian/Agilent DirectDrive console (VnmrJ3.1) and a 19-mm quadrature RF transceiver (RAPID Biomedical GmbH, Rimpar, Germany). QMRI relaxation time measurements for T1, T2, TRAFF, adiabatic T1ρ and T2ρ and CW-T1ρ at 500 Hz spin-lock amplitude were conducted. All the scans were coupled to a fast spin echo (FSE) read-out (TR=5s, ESP=4.3ms, ETL=8, matrix=192x192, FOV=19.2x19.2mm^2 and 1-mm slice thickness).
For analysis, ROIs were
selected in the lesion site (“repair tissue”); immediately next to the lesion in
a visually normal area (“secondary”); in
an area distant to the defect (“adjacent control”); and in control animals
without lesions in a location matching the locations of the “secondary” ROI. In
addition to bulk ROI consisting of full-thickness tissue, the ROIs were divided
into three depth-wise layers: superficial, transitional and deep, all manually
defined to comprise approximately 100 μm, 200 μm and the rest of the cartilage
thickness (average 830±230 µm), respectively (Figure 1b, 2b). Data from the
different ROIs were compared in each layer separately using a non-parametric
Kruskal-Wallis post-hoc test.
Results
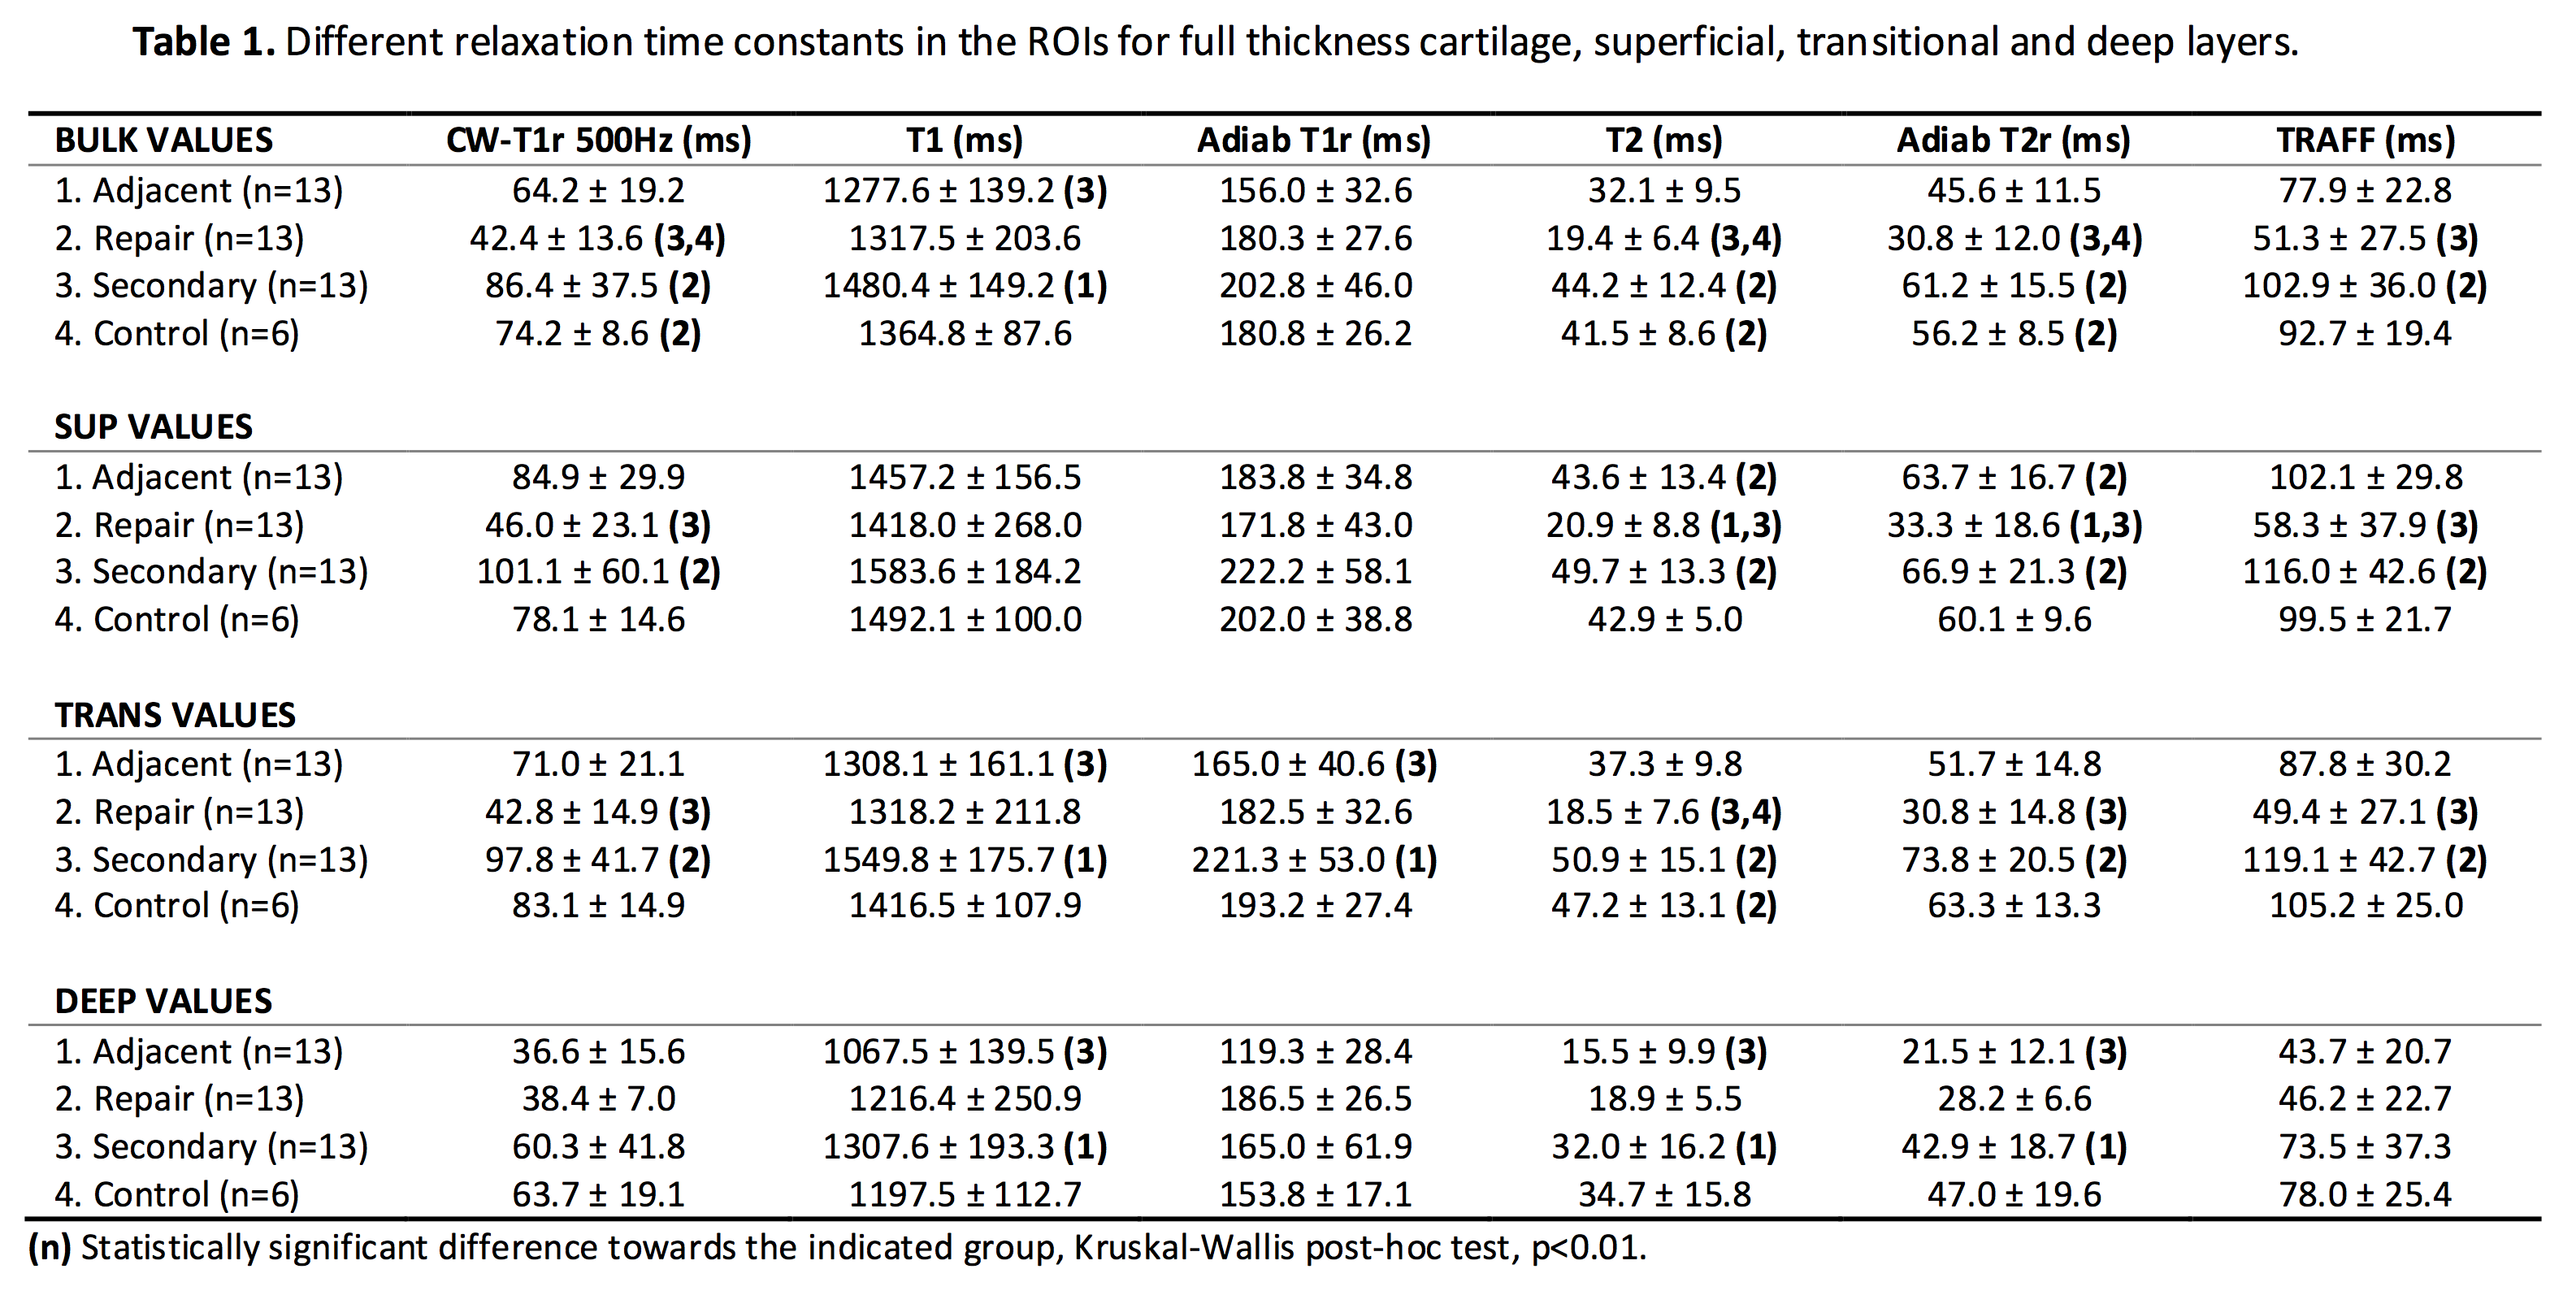
The different relaxation time maps from a representative lesion specimen show the spatial variation of relaxation times in cartilage adjacent to the lesion (Figure 1c-h). All the relaxation times were lower in the region of the repair tissue, suggesting a different structure, compared to the surrounding hyaline cartilage. At the edge of the lesion, where the “secondary” ROI was placed, the relaxation times were longer and gradually decreased towards the other edge of the specimen (towards the central region of the trochlea), where the adjacent control ROI was placed (Figure 1). In the control specimens, generally lower relaxation time values and less spatial variation was observed (Figure 2). In the full-thickness (bulk) layer, statistically significant differences were mostly noted between the repair, secondary and control ROIs (Table 1). In the superficial layer, statistically significant differences were seen between the repair tissue and adjacent control or secondary ROIs (Table 1). In the deep layer, only differences between adjacent control and the secondary ROIs were seen, for T1, T2 and adiabatic T2ρ (Table 1). Finally, in the transitional zone, statistically significant differences between only the secondary ROI and some other ROIs were seen, variably, in different relaxation times (Table 1).Discussion & conclusions
Based on the results, the relaxation times were longer in the secondary region, i.e. the tissue immediately adjacent to the induced lesions and gradually decreased away from the lesions, towards the central area of the trochlea. The ROI analysis demonstrated significant differences between the lesion area (repair tissue) and either control specimens or adjacent cartilage farther away from the lesion. Similarly, differences were seen between the secondary region and either the control specimens or the distant adjacent control tissue. This suggests that the repair tissue is of different quality and properties than the normal or even degenerated articular cartilage. On the other hand, no differences were seen between the control specimens and distant tissue adjacent to the lesion. The findings suggest that properties of cartilage are altered due to the presence of a lesion next to it.1,2 However, while qMRI parameters were able to detect these changes, a best parameter could not be identified, likely calling for combination analyses of multiple parameters.9,10Acknowledgements
Support from the Academy of Finland (grants #285909, #293970 and #297033), Dutch Arthritis Foundation (grants LLP-12 and LLP-22), the Netherlands Institute for Regenerative Medicine (NIRM) and the Jane and Aatos Erkko Foundation is gratefully acknowledged.References
1. Brown TD, Johnston RC, Saltzman CL, Marsh JL, Buckwalter JA. Posttraumatic osteoarthritis: a first estimate of incidence, prevalence, and burden of disease. J Orthop Trauma 2006;20(10):739-744.
2. Buckwalter JA, Mankin HJ. Articular Cartilage, Part II: Degeneration and osteoarthrosis, repair, regeneration, and transplantation. J Bone Joint Surg Am 1997;79(4):612-632
3. Rautiainen J, Nissi MJ, Liimatainen T, Herzog W, Korhonen RK, Nieminen MT. Adiabatic rotating frame relaxation of MRI reveals early cartilage degeneration in a rabbit model of anterior cruciate ligament transection. Osteoarthritis Cartilage 2014;22(10):1444-1452. doi: 10.1016/j.joca.2014.04.023.
4. Rautiainen J, Nissi MJ, Salo EN, Tiitu V, Finnila MA, Aho OM, Saarakkala S, Lehenkari P, Ellermann J, Nieminen MT. Multiparametric MRI assessment of human articular cartilage degeneration: Correlation with quantitative histology and mechanical properties. Magn Reson Med 2014. doi: 10.1002/mrm.25401.
5. Ellermann J, Ling W, Nissi MJ, Arendt E, Carlson CS, Garwood M, Michaeli S, Mangia S. MRI rotating frame relaxation measurements for articular cartilage assessment. Magn Reson Imaging 2013;31(9):1537-1543. doi: 10.1016/j.mri.2013.06.004.
6. Bashir A, Gray ML, Burstein D. Gd-DTPA2- as a measure of cartilage degradation. Magn Reson Med 1996;36(5):665-673.
7. Gold GE, Burstein D, Dardzinski B, Lang P, Boada F, Mosher T. MRI of articular cartilage in OA: novel pulse sequences and compositional/functional markers. Osteoarthritis Cartilage 2006;14 Suppl A:A76-86.
8. Liimatainen T, Sorce DJ, O'Connell R, Garwood M, Michaeli S. MRI contrast from relaxation along a fictitious field (RAFF). Magn Reson Med 2010;64(4):983-994.
9. Lukas VA, Fishbein KW, Lin PC, Schar M, Schneider E, Neu CP, Spencer RG, Reiter DA. Classification of Histologically Scored Human Knee OsteochondralPlugsby Quantitative Analysis of Magnetic Resonance Images at 3T. J Orthop Res 2015. doi: 10.1002/jor.22810.
10. Lin PC,
Reiter DA, Spencer RG. Classification of degraded cartilage through
multiparametric MRI analysis. J Magn Reson 2009;201(1):61-71.
Figures