1557
Compressed Sensing Microscopic MRI in Articular Cartilage at 7T: Quantitative Determination of GAG Concentration using dGEMRIC MethodNian Wang1, Farid Badar2, and Yang Xia2
1Center for In Vivo Microscopy, Department of Radiology, Duke University, Durham, NC, United States, 2Physics and Center for Biomedical Research, Oakland University, Rochester, MI, United States
Synopsis
To evaluate the compressed sensing feasibility of quantification GAG concentration using dGEMRIC method, high resolution T1 mapping of articular cartilage was accelerated using various acceleration factors. It demonstrates that using CS doesn’t introduce major deviations in quantification of GAG concentration even with acceleration factor of 16, which holds great promise in making quantitative imaging techniques more accessible for clinical applications.
Purpose
The negative charged glycosaminoglycans (GAG) in articular cartilage determines the load-bearing properties of the tissue, and the loss of GAG is regarded as an early sign of tissue degradation. MRI T1 method (dGEMRIC) at very high-resolution (less than 100 µm) has seen limited use due to long scan times (1, 2). Compressed sensing (CS) is an accelerated imaging method which enables reconstruction of undersampled data by exploiting image sparsity (3). In this study, we evaluated the feasibility of accelerated high resolution T1 image (17.6 µm) for articular cartilage using compressed sensing with the acceleration factor as high as 16, then calculated the GAG concentration with different acceleration factor (2, 4, 8, 16), and further compared them with the fully sampled data. It’s expected that CS should allow reconstruction of images from undersampled data without introducing major deviations in quantification of GAG concentration.Methods
Canine cartilage-bone blocks (each about 3.5x2.5x6 mm) were harvested from the central part of the humeral head. MRI experiments were conducted at room temperature on a Bruker AVANCE II 300 NMR spectrometer equipped with a 7-Tesla/89-mm vertical-bore superconducting magnet and micro-imaging accessory (Billerica, MA). A homemade 5 mm solenoid coil was used for imaging, where the orientation of the cartilage block with respect to B0 was set at 55˚ (the magic angle). The echo time (TE) of the imaging sequence was 7.2 ms; and the repetition time (TR) of the imaging experiment decreased steadily from 2.0 s without Gd to 0.5 s with 1 mM Gd immersion respectively. The 2D in-plane pixel size was 17.6 µm. The measurement of 2D T1 relaxation time used the inversion-recovery pulse sequence with 5 inversion points (steadily reduced from 0, 0.4, 1.1, 2.2, 4.0 s for tissue without Gd to 0, 0.1, 0.3, 0.5, 1 s for tissue soaked in 1 mM Gd) (4). CS reconstruction was then applied on the k-spaces of all T1-weighted images by minimizing the following function:$${f(x) = \parallel Fx-y\parallel_2^2 + a_{1}\parallel W x \parallel_{1}+a_{2} TV(x)}$$where x is the image and y is its corresponding k-space, F is the FFT, W is the sparse transform, a1 and a2 are weighting factors, is the total variation. Various CS acceleration factors (1, 2, 4, 8, 16, where 1 stands for the fully sampled data) were used to access the accuracy for quantitative GAG content. After all the T1-weighted images were reconstructed, the calculation of T1 mapping in the tissue went through a single exponential equation on a pixel-by-pixel basis for all the different CS acceleration factors.Results and Discussion
Fig 1 showed the calculated T1 images with (T1a) and without (T1b) Gd(DTPA)2- administration at different CS acceleration factors (1 ~ 16), the binary mask for k-space data sampling was also shown. Both T1a and T1b images exhibited good quality even with 16 times acceleration, while the images began to blurred with acceleration factor larger than 4, which may cause by the loss of high frequency in k-space. The red box showed the ROI region used for generating the T1 profiles. The depth-dependent profiles of all T1 images with different CS factors were plotted on the relative tissue depth in Fig 2a (0 = articular surface, 1 = cartilage-bone interface). The CS reconstructed T1 profiles of the tissue before/after immersed in 1 mM Gd solution were highly consistent with the fully sampled T1 profiles (acceleration factor =1). A number of additional features were clearly visible. First, T1b value is always higher than T1a value through the whole tissue depth. Second, T1b profiles is relatively uniform across its tissue depth, while T1 increases from the articular surface to the cartilage-bone interface (the deep tissue), reflecting the GAG concentration profiles in cartilage. Fig 2b showed the GAG concentration profiles at different CS acceleration factors. It’s interesting to note that the GAG profiles were highly consistent with different CS acceleration factors. Furthermore, the GAG concentration also showed strongly depth-dependent: lower at surface zone, monotonically increased to the deep zone of the tissue. The mean GAG concentration of the tissue was plotted as a function of CS acceleration factors (Fig 3). The calculated GAG concentration among different CS acceleration factors showed consistent values (± 2 mg/ml).Conclusion
The preliminary study shows that CS can be applied to decrease the acquisition time of T1 MRI of cartilage at 7T by a factor of 16 without losing significant accuracy in quantification GAG concentration using ROI analysis. Further studies are needed to quantify the voxel-based variation at different CS acceleration factors.Acknowledgements
This project was supported by two R01 grants from the NIH (NIAMS: AR052353, AR069047).References
(1) Bashir A et al. MRM 1996; 36: 665-673. (2) Xia Y et al. MRM 2011; 65: 1733-1737. (3) Lustig M et al. MRM 2007; 68: 1182-1195. (4) Wang N et al. PMB 2013; 58:4535-4547.Figures
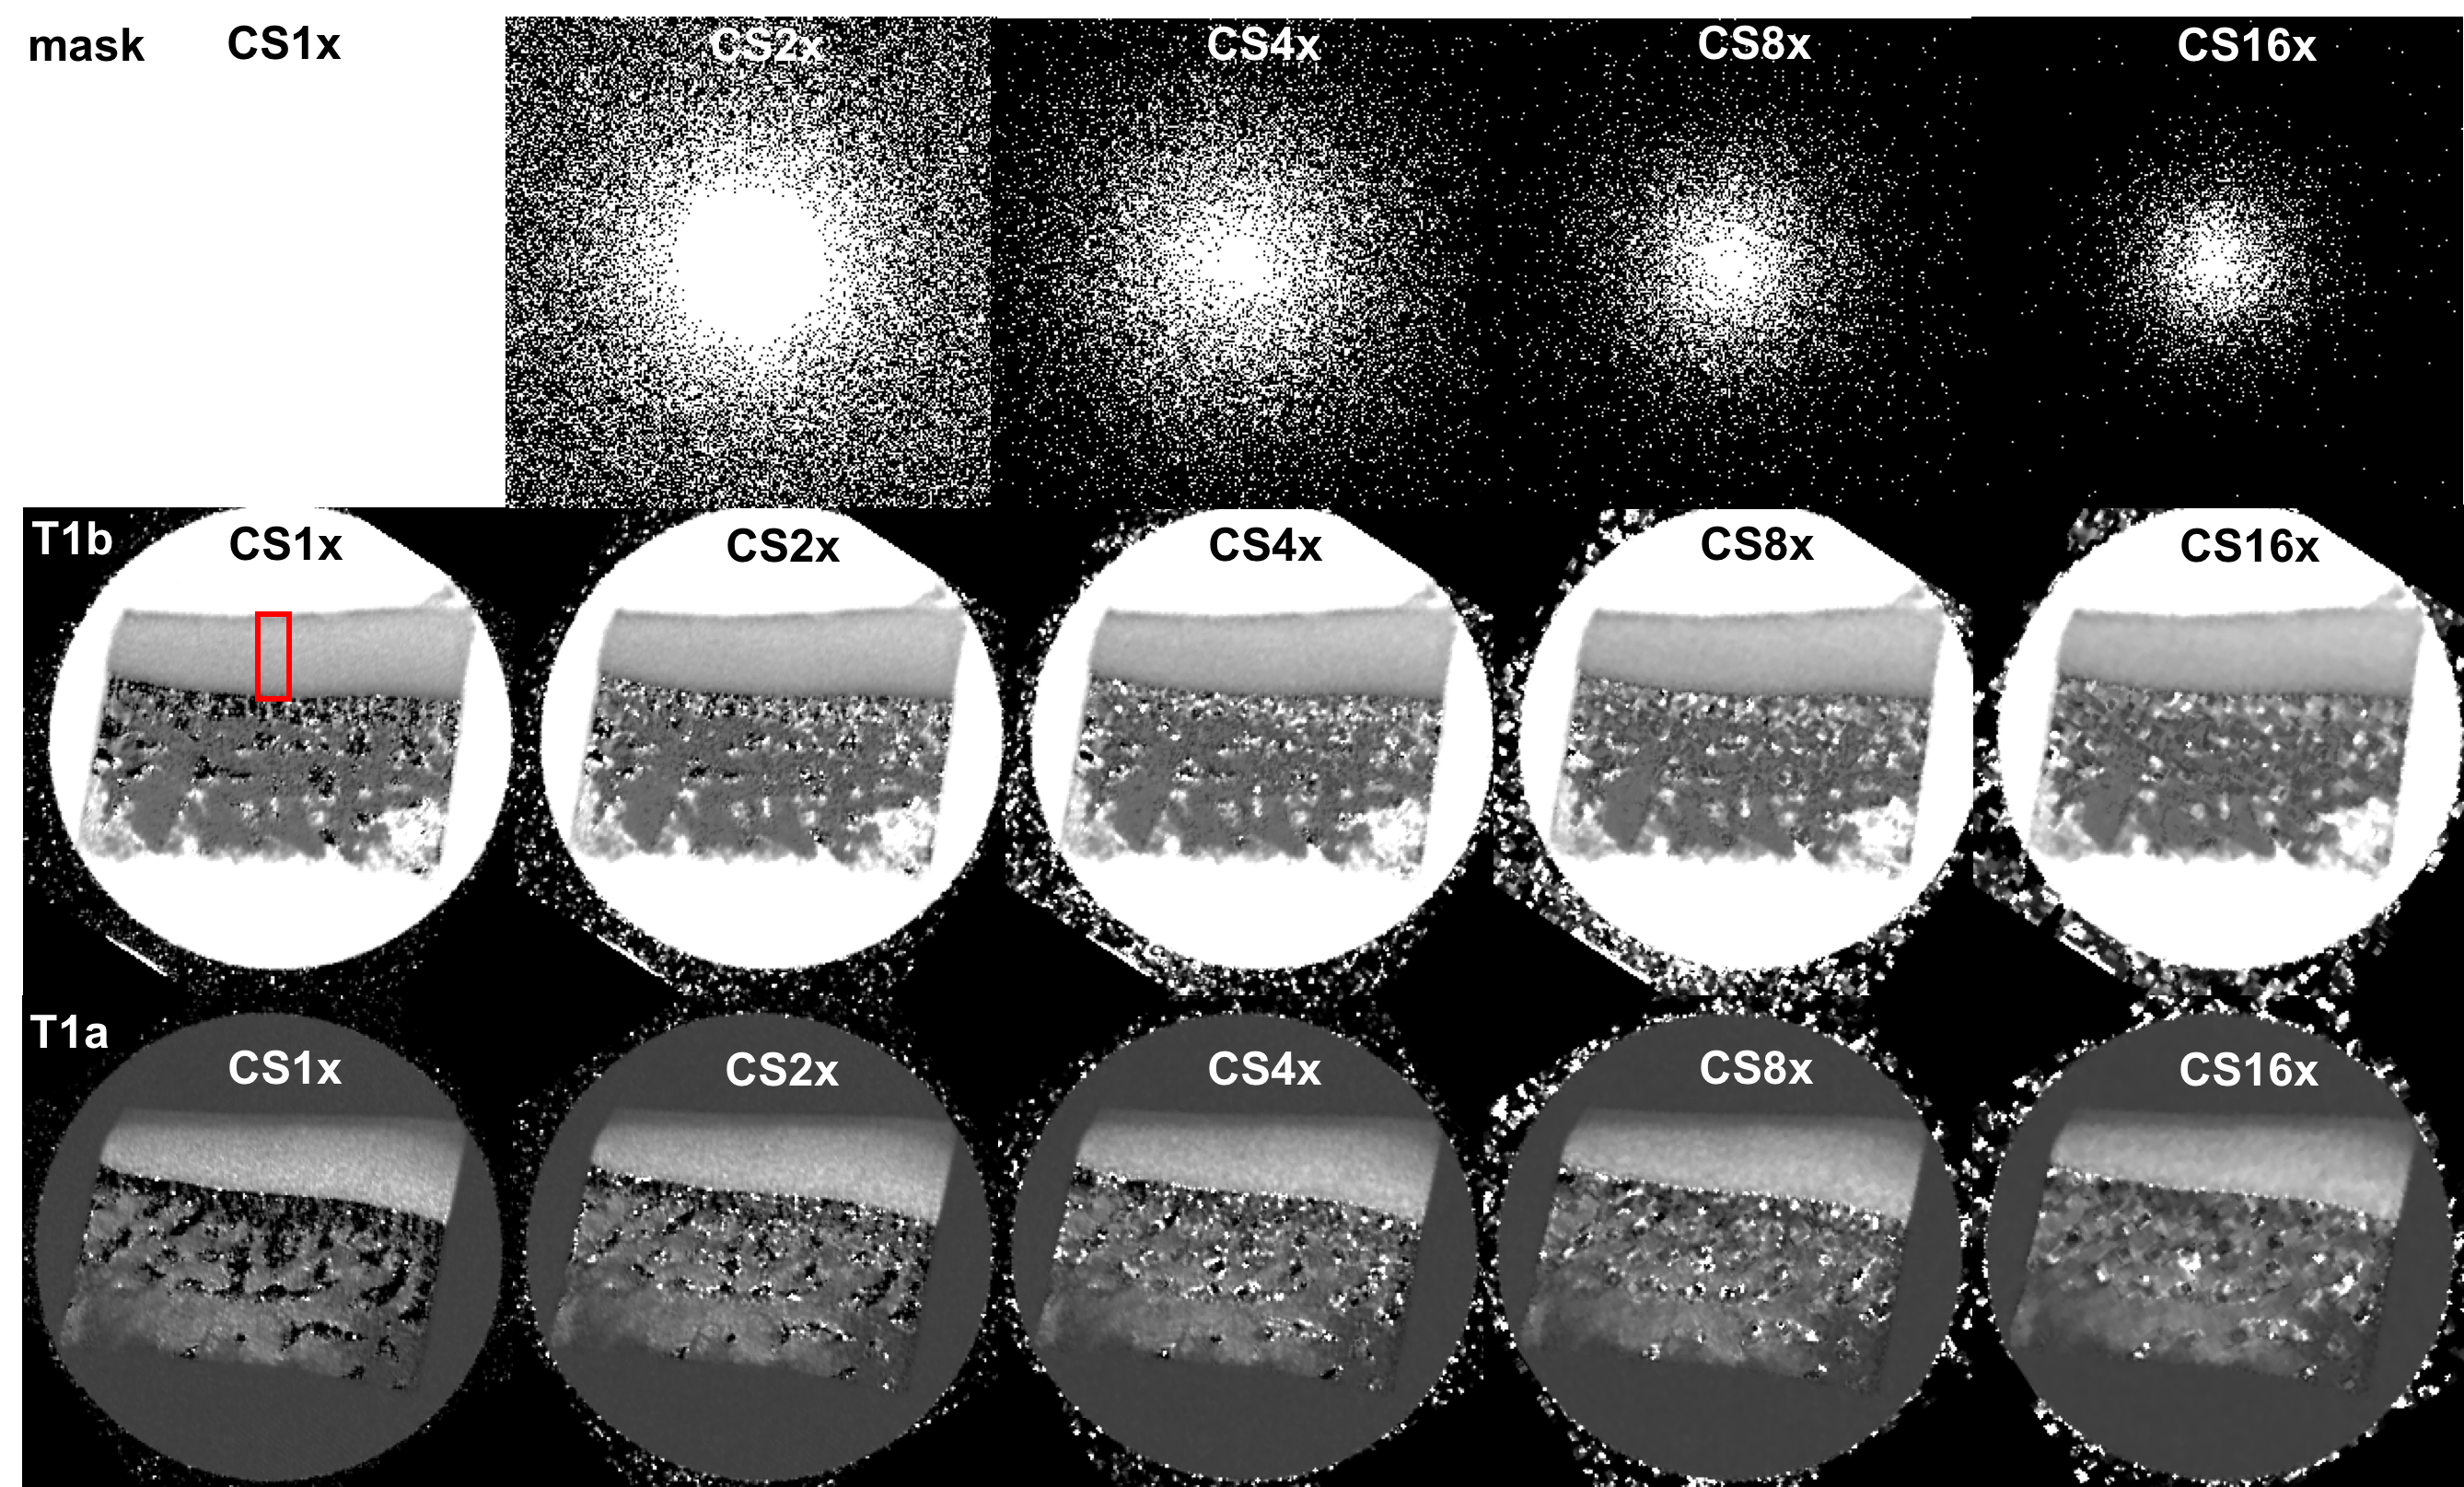
Fig 1. The calculated T1 images with (T1a) and without (T1b) Gd(DTPA)2- administration at different CS acceleration factors (1 ~ 16), the binary mask for k-space data
sampling was also shown.
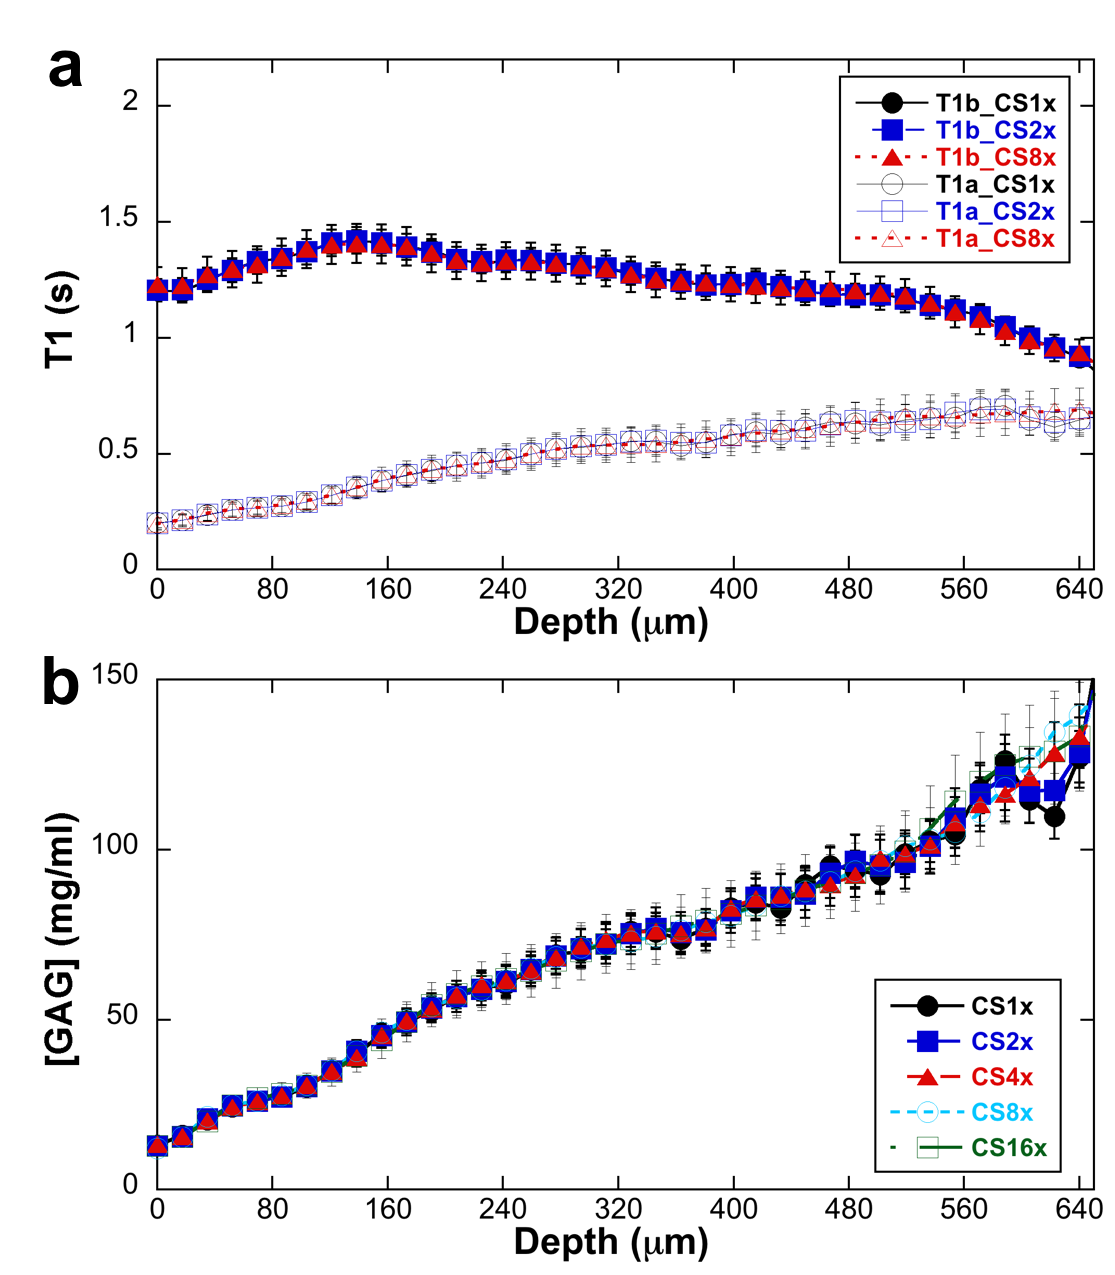
Fig 2. The depth-dependent profiles of
all T1 images with different CS factors were plotted on the relative tissue
depth in Fig 2a (0 = articular surface, 1 = cartilage-bone interface). The GAG concentration profiles at different CS acceleration factors were shown in Fig 2b.
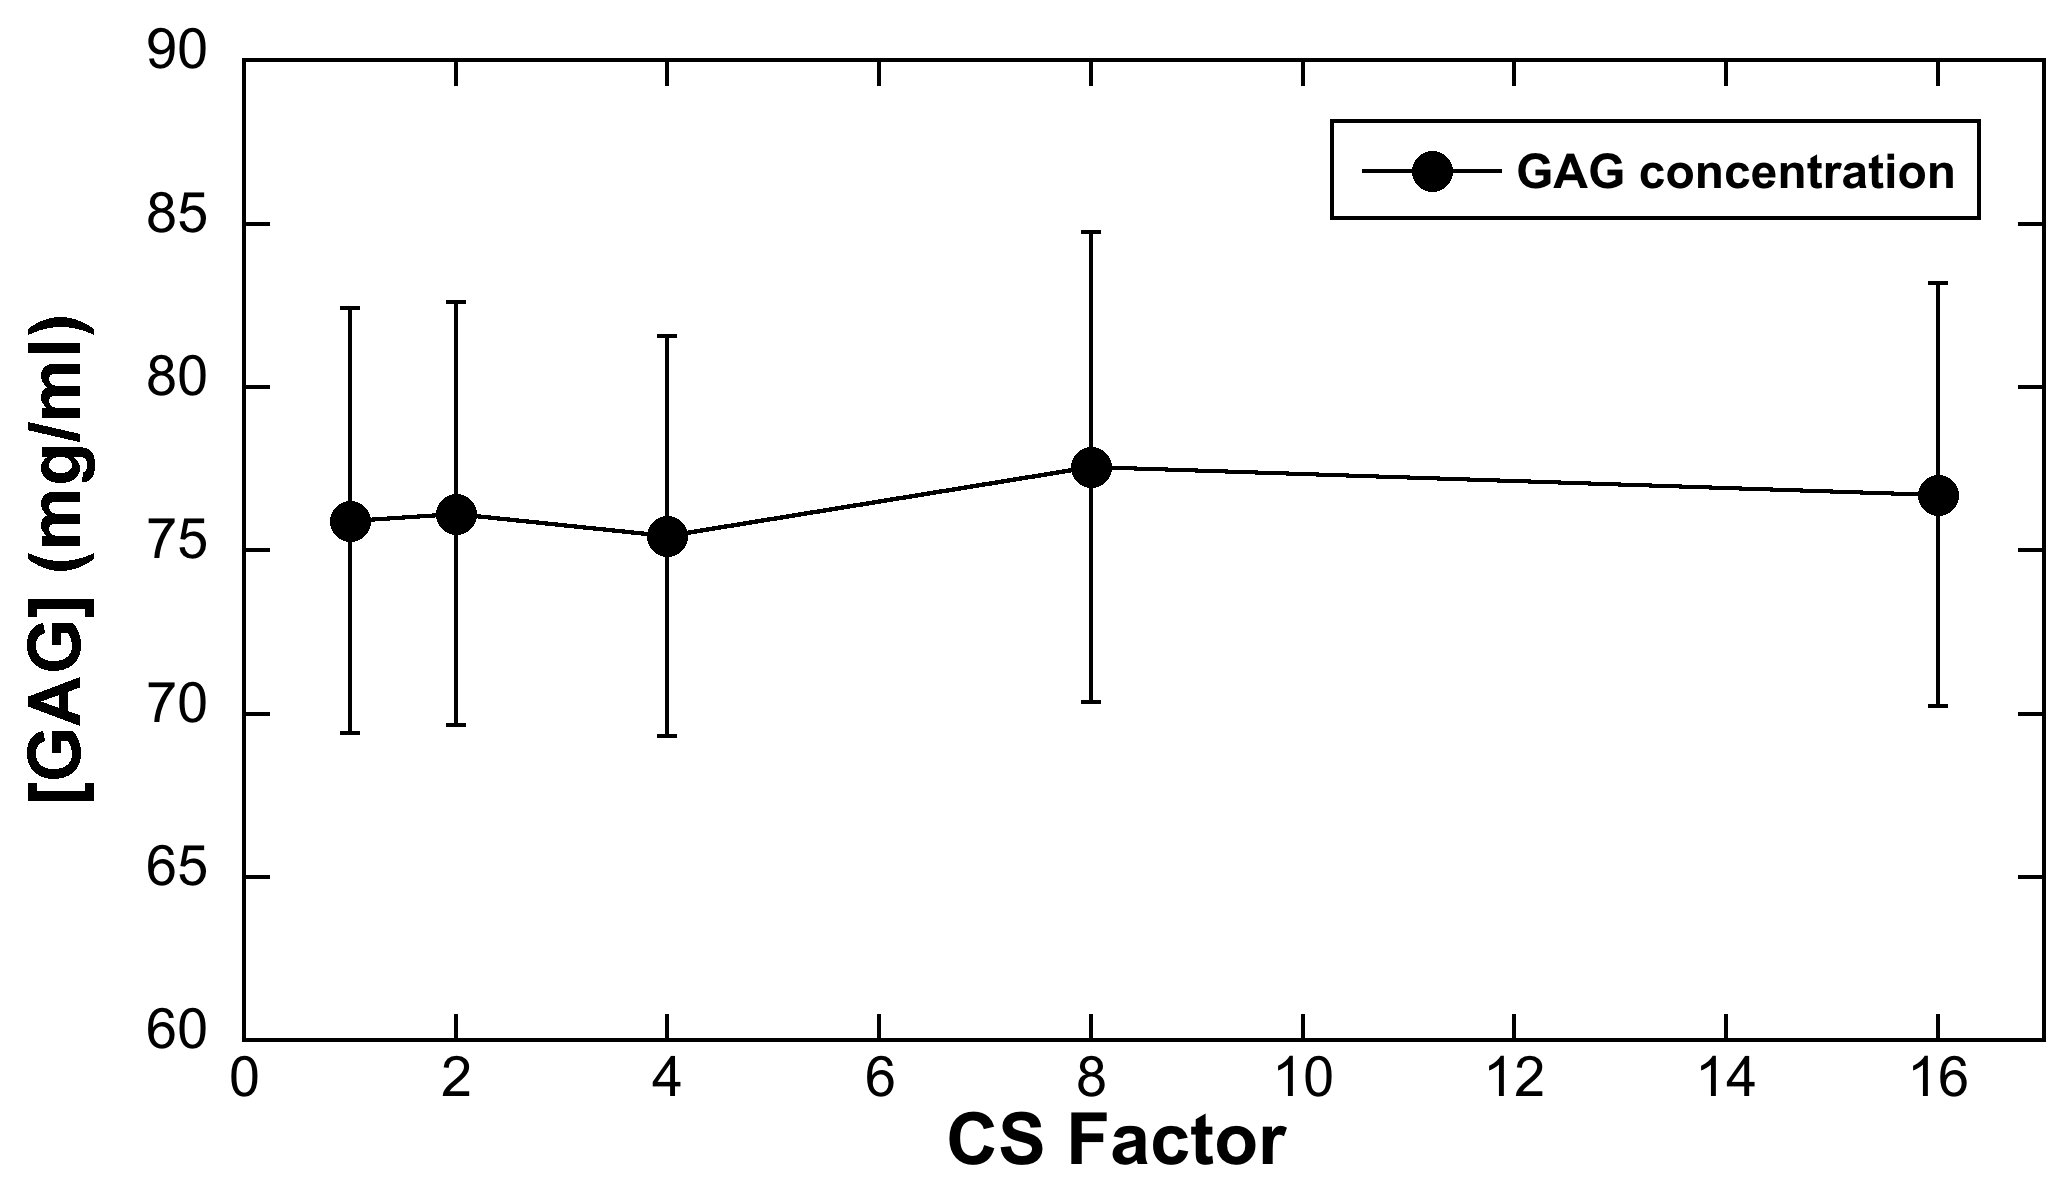
Fig 3. The mean GAG concentration of the tissue plotted as a function of CS acceleration factors. The calculated GAG concentration among different CS acceleration factors showed consistent values (± 2 mg/ml).