1556
In Vivo Multicomponent T1ρ and T2 Relaxation Mapping of Human Knee CartilageAzadeh Sharafi1, Ding Xia1, Gregory Chang 1, and Ravinder Regatte1
1Radiology, New York University, School of Medicine, New York, NY, United States
Synopsis
In this study, we demonstrated the feasibility of in-vivo biexponential T1ρ and T2 relaxation measurement of knee articular cartilage using 3T MRI in clinically feasible scan times in eight healthy volunteers. Our preliminary results demonstrate that the biexponential model better represents the relaxation behavior in articular cartilage and can be used to distinguish different water compartments associated with macromolecules (tightly bound and loosely bound water) in the cartilage.
Purpose
Osteoarthritis (OA) is a degenerative disease that is associated with the loss of proteoglycans, changes in collagen structure and increase of water content1 in its early stages. The change in the biochemistry of cartilage and increase in water content due to OA lead to elevated T1ρ and T2 times1-2. Different water compartments in the cartilage tissue may be better represented by biexponential fitting than monoexponential model. The purpose of this work is to investigate the feasibility of in-vivo biexponential analysis of T1ρ and T2 relaxation times of articular cartilage in the human knee joint using 3T MRI in clinically feasible scan times.Methods
IRB -approved T1ρ and T2 imaging were performed on eight healthy volunteers (mean age: 30 ± 4 years) using a 3T MRI scanner (Prisma, Siemens Healthcare, Germany) with a 15-channel Tx/Rx knee coil (QED, Cleveland OH). A 3D Cartesian turbo-Flash sequence was customized to enable T1ρ and T2 imaging with varying spin-lock and echo time respectively. To compensate the effect of B0 and B1 inhomogeneities, the spin-lock pulse was divided into four segments with alternative phase and a refocusing pulse was applied between two pairs. T1ρ and T2 weighted images were acquired at 10 different TSLs/TEs: 2/4/6/8/10/15/25/35/45/55ms. The sequence acquisition parameters were as follows: TR/TE 1500ms/4ms, flip angle 8°, matrix size 256×128×64, spin-lock frequency=500Hz, slice thickness = 2ms, FOV = 140mm2. Using The GRAPPA3 parallel imaging method with the acceleration factor of AF = 3 the total acquisition time was decreased to 15 minutes for each 3D data set. T1ρ and T2 relaxation times were calculated pixel by pixel over five consecutive slices for each volunteer using mono- and biexponential model (Fig. 1) in different regions of interests: medial-tibia (MT), medial-femoral (MF), lateral-femoral (LF), lateral-tibia (LT), and Patellar (P) cartilagesResults
Biexponential relaxation of T1ρ and T2 were detected in the knee cartilage in five regions of interest on all eight healthy volunteers (Fig. 2). Short/long relaxation components of T1ρ and T2 were estimated to be 6.87±1.17 ms/51.08±4.49ms and 8.27±0.68 ms/45.35±3.79ms, respectively. Similarly, the fractions of short/long T1ρ and T2 were 37.6 ± 1.5 %/62.4 ± 6.8% and 41.3±1.1 %/58.6±4.6% respectively. The monoexponential relaxation of T1ρ and T2 were measured to be 32.62±3.53ms and 26.9±2.27ms, respectively . The experiments showed good repeatability with rms-CV < 20% for both T1ρ and T2 in all regions. The statistical analysis showed that the mono-exponential T1ρ was significantly higher (P < 0.001) than T2 across all regions. Significant differences were observed between medial-tibial and patellar cartilage for monoexponential T1ρ (P = 0.02) as well as mono- (P= 0.02) and biexponential T2 (T2long, P = 0.01, T2short, P=0.04). The biexponential T2 components were also significantly different in medial-tibial and lateral-tibial cartilage (P = 0.025).Discussion and Conclusion
The short relaxation component is related to the tightly bound macromolecular (PG and collagen) water compartments while the long component is related to the loosely bound macromolecular water. The results of our experiments showed that the biexponential fitting may better distinguish the different relaxation times in the cartilage (Fig. 3). The smaller slice thickness and extra temporal points with longer scan times of our study in comparison to the other prior studies lead to a more accurate estimation of T1ρ and T2.Acknowledgements
This study was supported by NIH grants R01-AR060238, R01 AR067156, and R01 AR068966, and was performed under the rubric of the Center of Advanced Imaging Innovation and Research (CAI2R), a NIBIB Biomedical Technology Resource Center (NIH P41 EB017183).References
1. Li, X.; Benjamin Ma, C.; Link, T. M.; Castillo, D. D.; Blumenkrantz, G.; Lozano, J.; Carballido-Gamio, J.; Ries, M.; Majumdar, S., In vivo T1ρ and T2 mapping of articular cartilage in osteoarthritis of the knee using 3 T MRI. Osteoarthritis and Cartilage 2007, 15 (7), 789-797. 2. Regatte, R. R.; Akella, S. V.; Lonner, J.; Kneeland, J.; Reddy, R., T1ρ relaxation mapping in human osteoarthritis (OA) cartilage: comparison of T1ρ with T2. Journal of Magnetic Resonance Imaging 2006, 23 (4), 547-553. 3. Griswold, M. A.; Jakob, P. M.; Heidemann, R. M.; Nittka, M.; Jellus, V.; Wang, J.; Kiefer, B.; Haase, A., Generalized autocalibrating partially parallel acquisitions (GRAPPA). Magnetic resonance in medicine 2002, 47 (6), 1202-1210.Figures
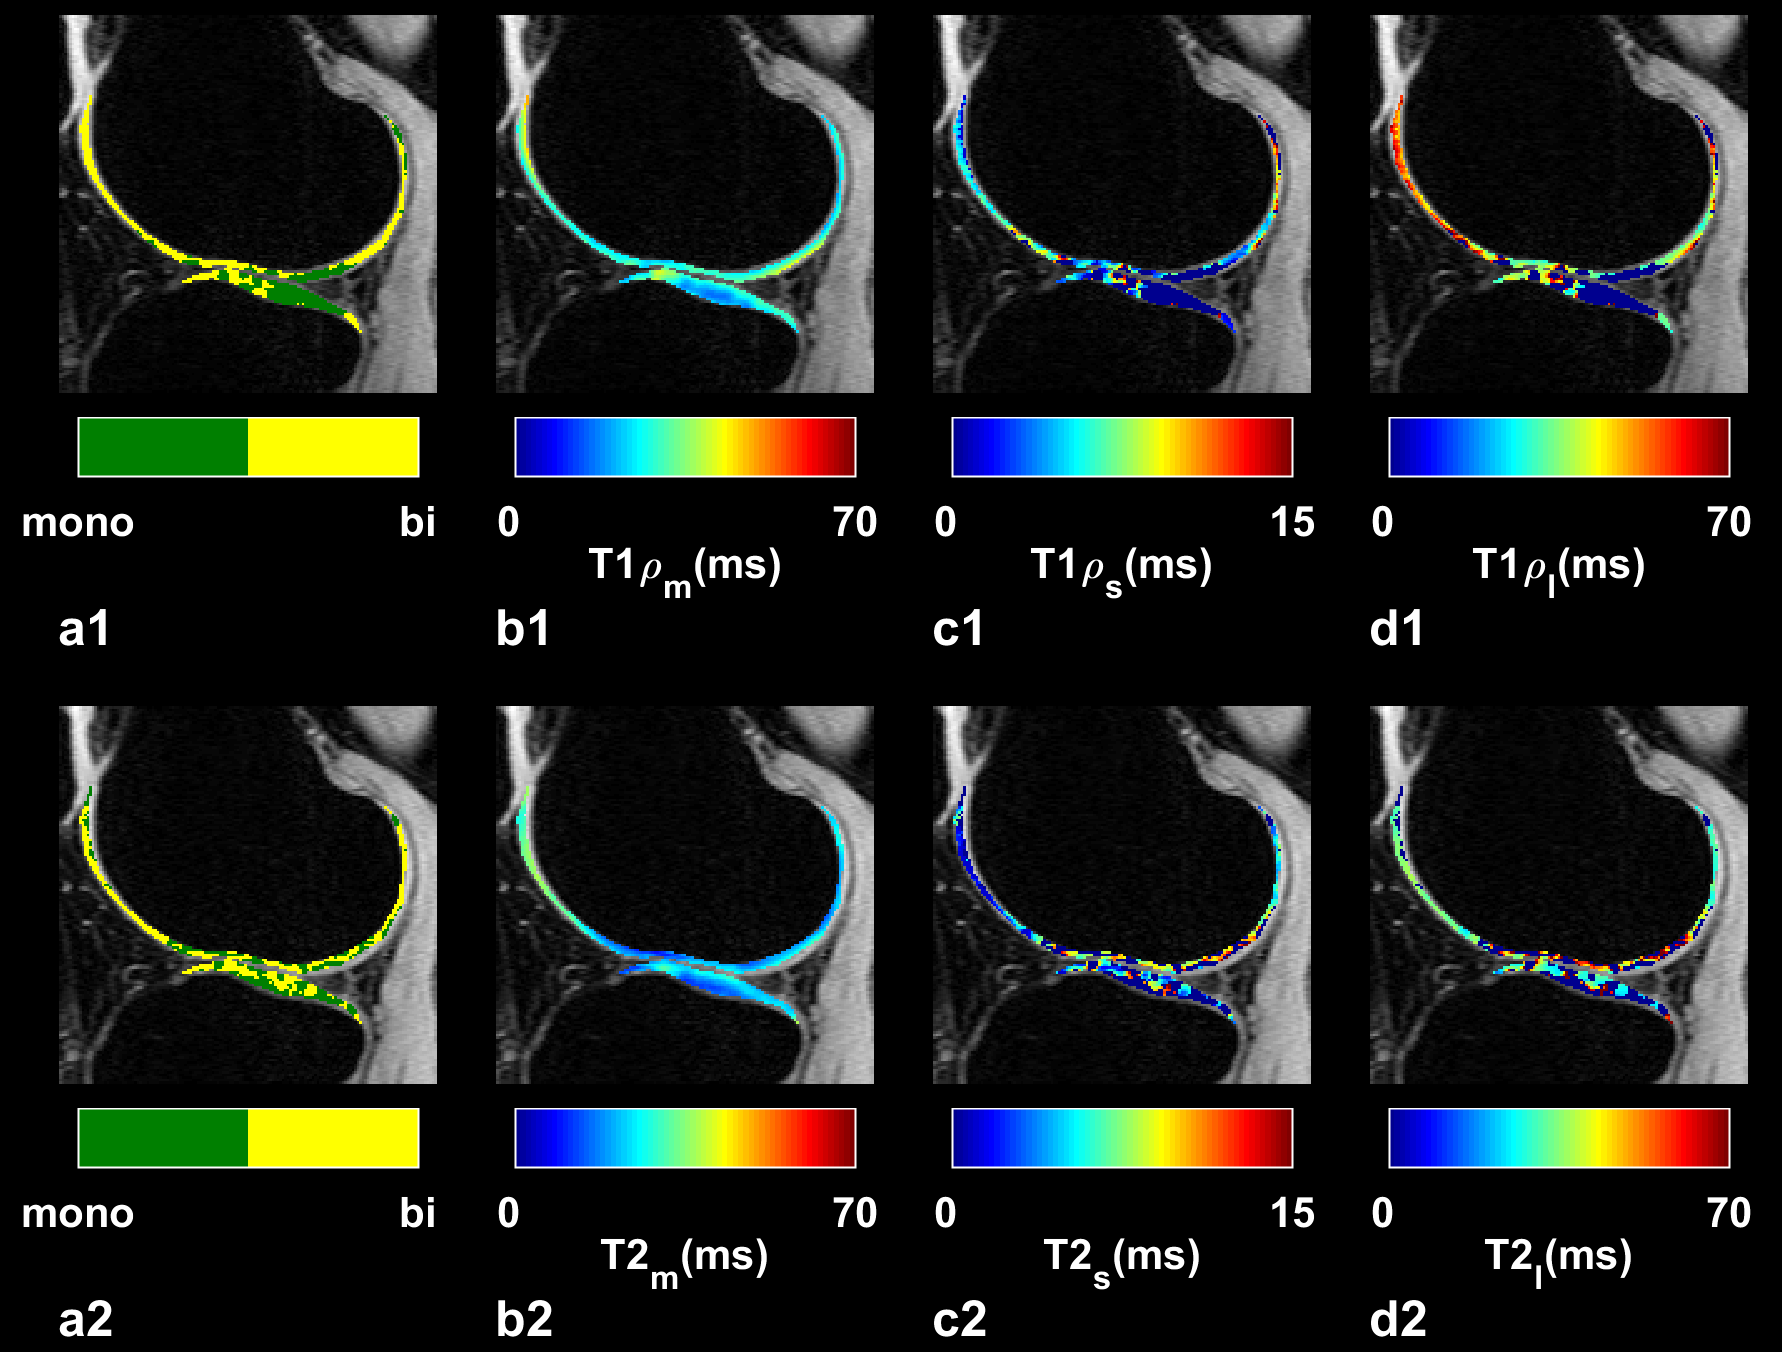
Representative T1ρ (first row) and T2
(second row) relaxation maps. (a) Binary maps show the location of
biexponential pixels. (b) Estimated monoexponential T1ρ, and T2 relaxation. (c) Estimated short and (d) long component maps
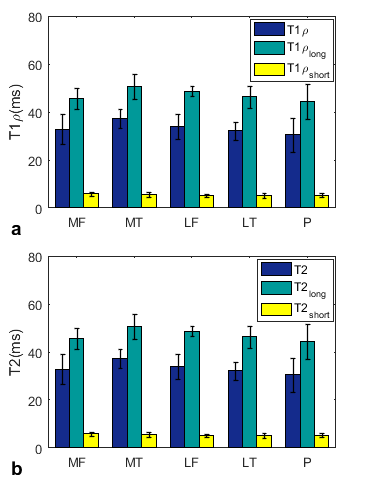
Mean values of (a) T1ρ and (b) T2
relaxation times over 8 volunteers at different region of interests.
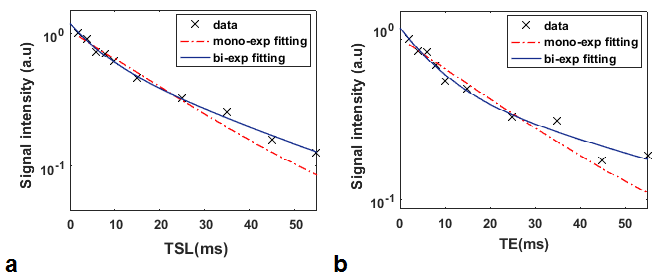
Representative comparison of mono- and
biexponential model for estimating (a) T1ρ and (b) T2
relaxation times. The data are shown in logarithmic scale. The deviation of the
data points from the straight line (mono exponential) shows that the
biexponential model better represents the relaxations than monoexponential
model.