1555
Quantitative susceptibility mapping of articular cartilage at different orientations to investigate susceptibility anisotropy1Department of Applied Physics, University of Eastern Finland, Kuopio, Finland, 2Diagnostic Imaging Center, Kuopio University Hospital, Kuopio, Finland, 3Research Unit of Medical Imaging, Physics and Technology, University of Oulu, 4Department of Medical Physics & Biomedical Engineering, University College London
Synopsis
In this study we examined ex-vivo bovine articular cartilage using quantitative susceptibility mapping (QSM). Our purpose was to find a reliable QSM measurement and estimation protocol and then study how different enzymatic and chemical degradations affect the susceptibility of articular cartilage, in order to establish the feasibility of QSM for the assessment of articular cartilage. Treatments by trypsin (to degrade proteoglycans) and EDTA (to remove calcifications) were found to have minimal effects on the susceptibility. However, a significant depth-wise anisotropy of susceptibility in cartilage was observed. Further studies are warranted to investigate the susceptibility changes in cartilage.
Introduction
Numerous quantitative MRI methods have been demonstrated sensitive to cartilage degeneration1. Recently, the use of quantitative susceptibility mapping (QSM)2 has also been extended to musculoskeletal imaging3-6. As an inherent property of tissue, magnetic susceptibility has potential to serve as a biomarker of osteoarthritis (OA). In present, study we examined the feasibility of QSM for the evaluation of ex vivo articular cartilage under different treatments. As collagen, a major constituent of articular cartilage, is known to have anisotropic susceptibility7, we acquired images at several different orientations to B0 to investigate susceptibility of anisotropy in cartilage.Materials and Methods
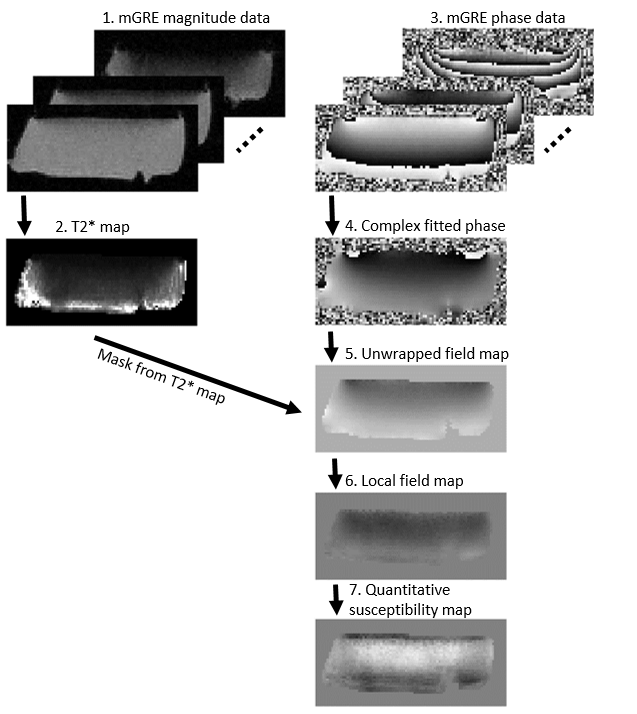
Cylindrical osteochondral (OC) plugs (diameter = 6 mm, n = 9) were prepared from the knees of three skeletally mature bovines; three adjacent plugs were extracted from each knee. To assess the role of calcifications in susceptibility of cartilage, two samples were decalcified with Ethylenediaminetetraacetic acid (EDTA) prior to MRI scans (EDTA binds metallic ions from tissue and is normally used to soften bony specimens for histology). The decalcification process was continued up to three weeks. Two samples were degraded using trypsin to assess the effect of change in cartilage proteoglycan content. MRI was performed at 9.4 T, using a 19-mm-diameter quadrature RF volume transceiver. The samples were immersed in 1HMRI-signal-free perfluoropolyether inside a holder, which allowed rotation of the specimens with respect to B0. Samples were imaged at 5 different orientations (0°, 25°, 45°, 65° and 90°) with respect to B0. At each orientation, 3D-GRE data were acquired at 6 echoes (TE = 2.00-17.25 ms, ΔTE = 3.05 ms, isotropic resolution of 94 µm). For QSM post-processing, a mask that contained all the cartilage was created by thresholding the T2*-map calculated from the same data. First, complex fitting was utilized to calculate field maps8. The fitted field was unwrapped using Laplacian unwrapping9 (σ = 10-10) and then the background field was corrected using the Laplacian Boundary Value (LBV) method10. Finally, susceptibility maps were calculated using truncated k-space division11 (TKD) with δ = 2/3 and corrected for susceptibility underestimation12 (Fig. 1). Histology with hematoxylin and eosin (H&E) staining was performed for all specimens after MRI scans to reveal the structure of the OC specimens and compare with susceptibility maps.Results
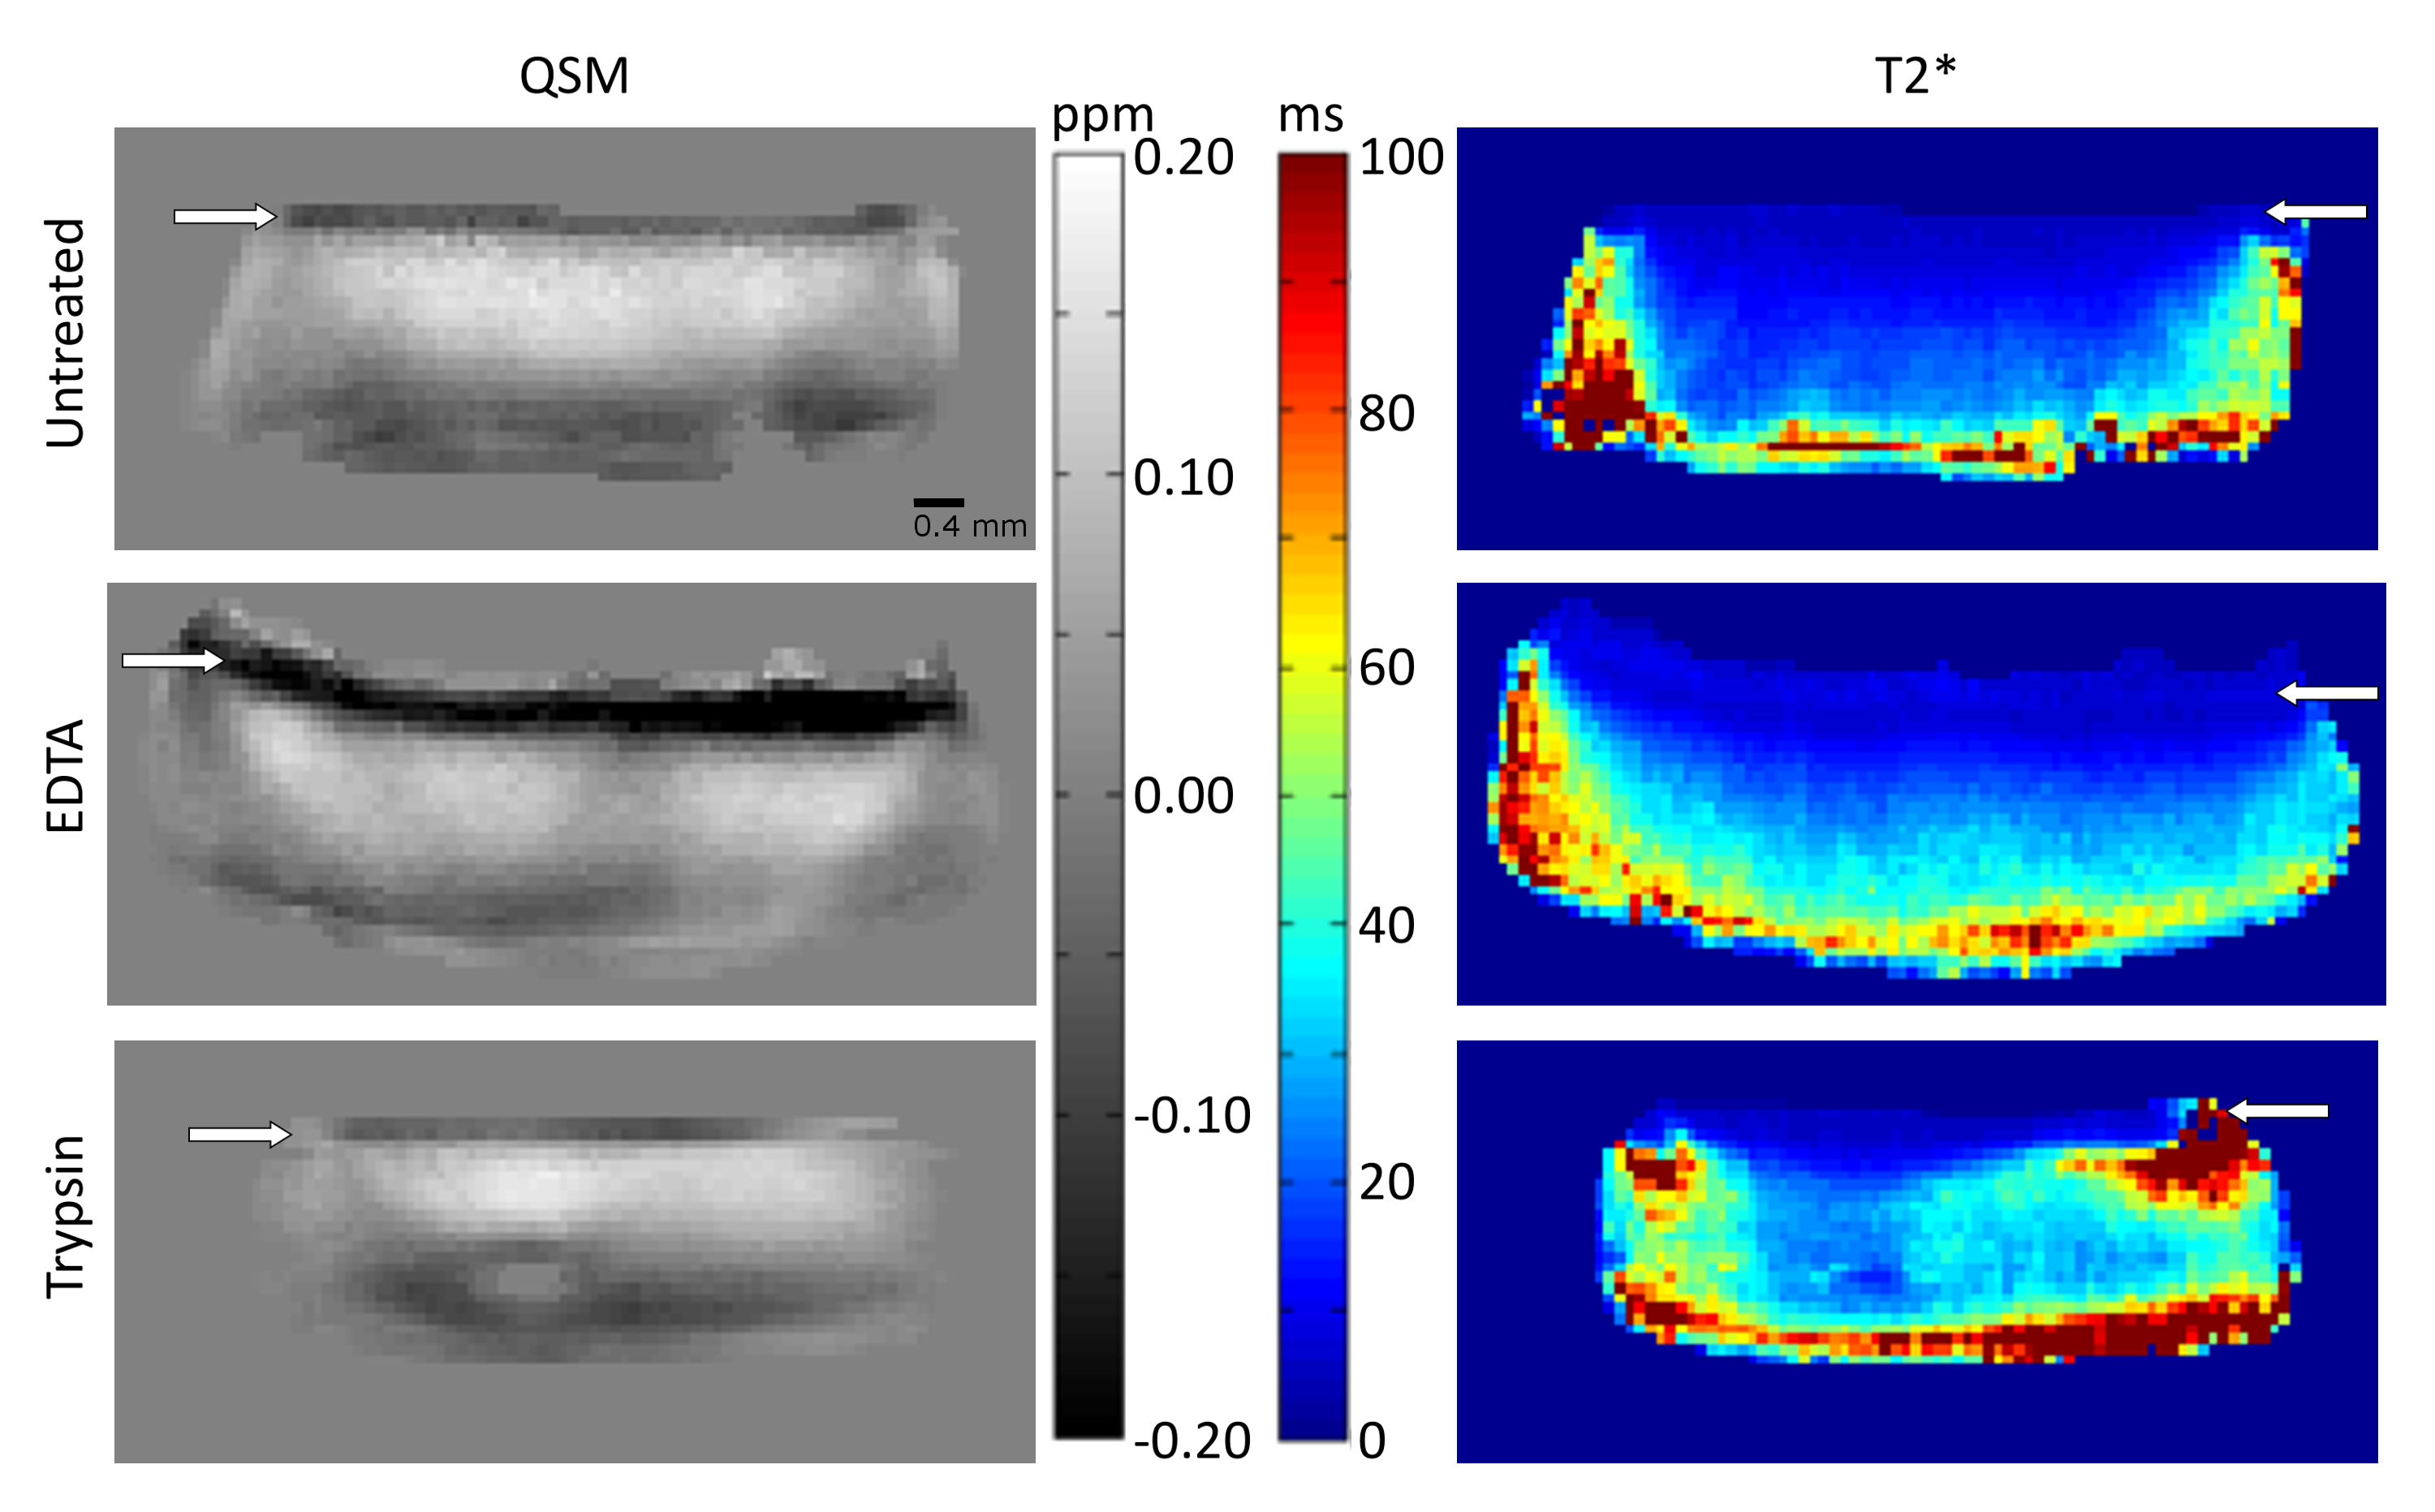
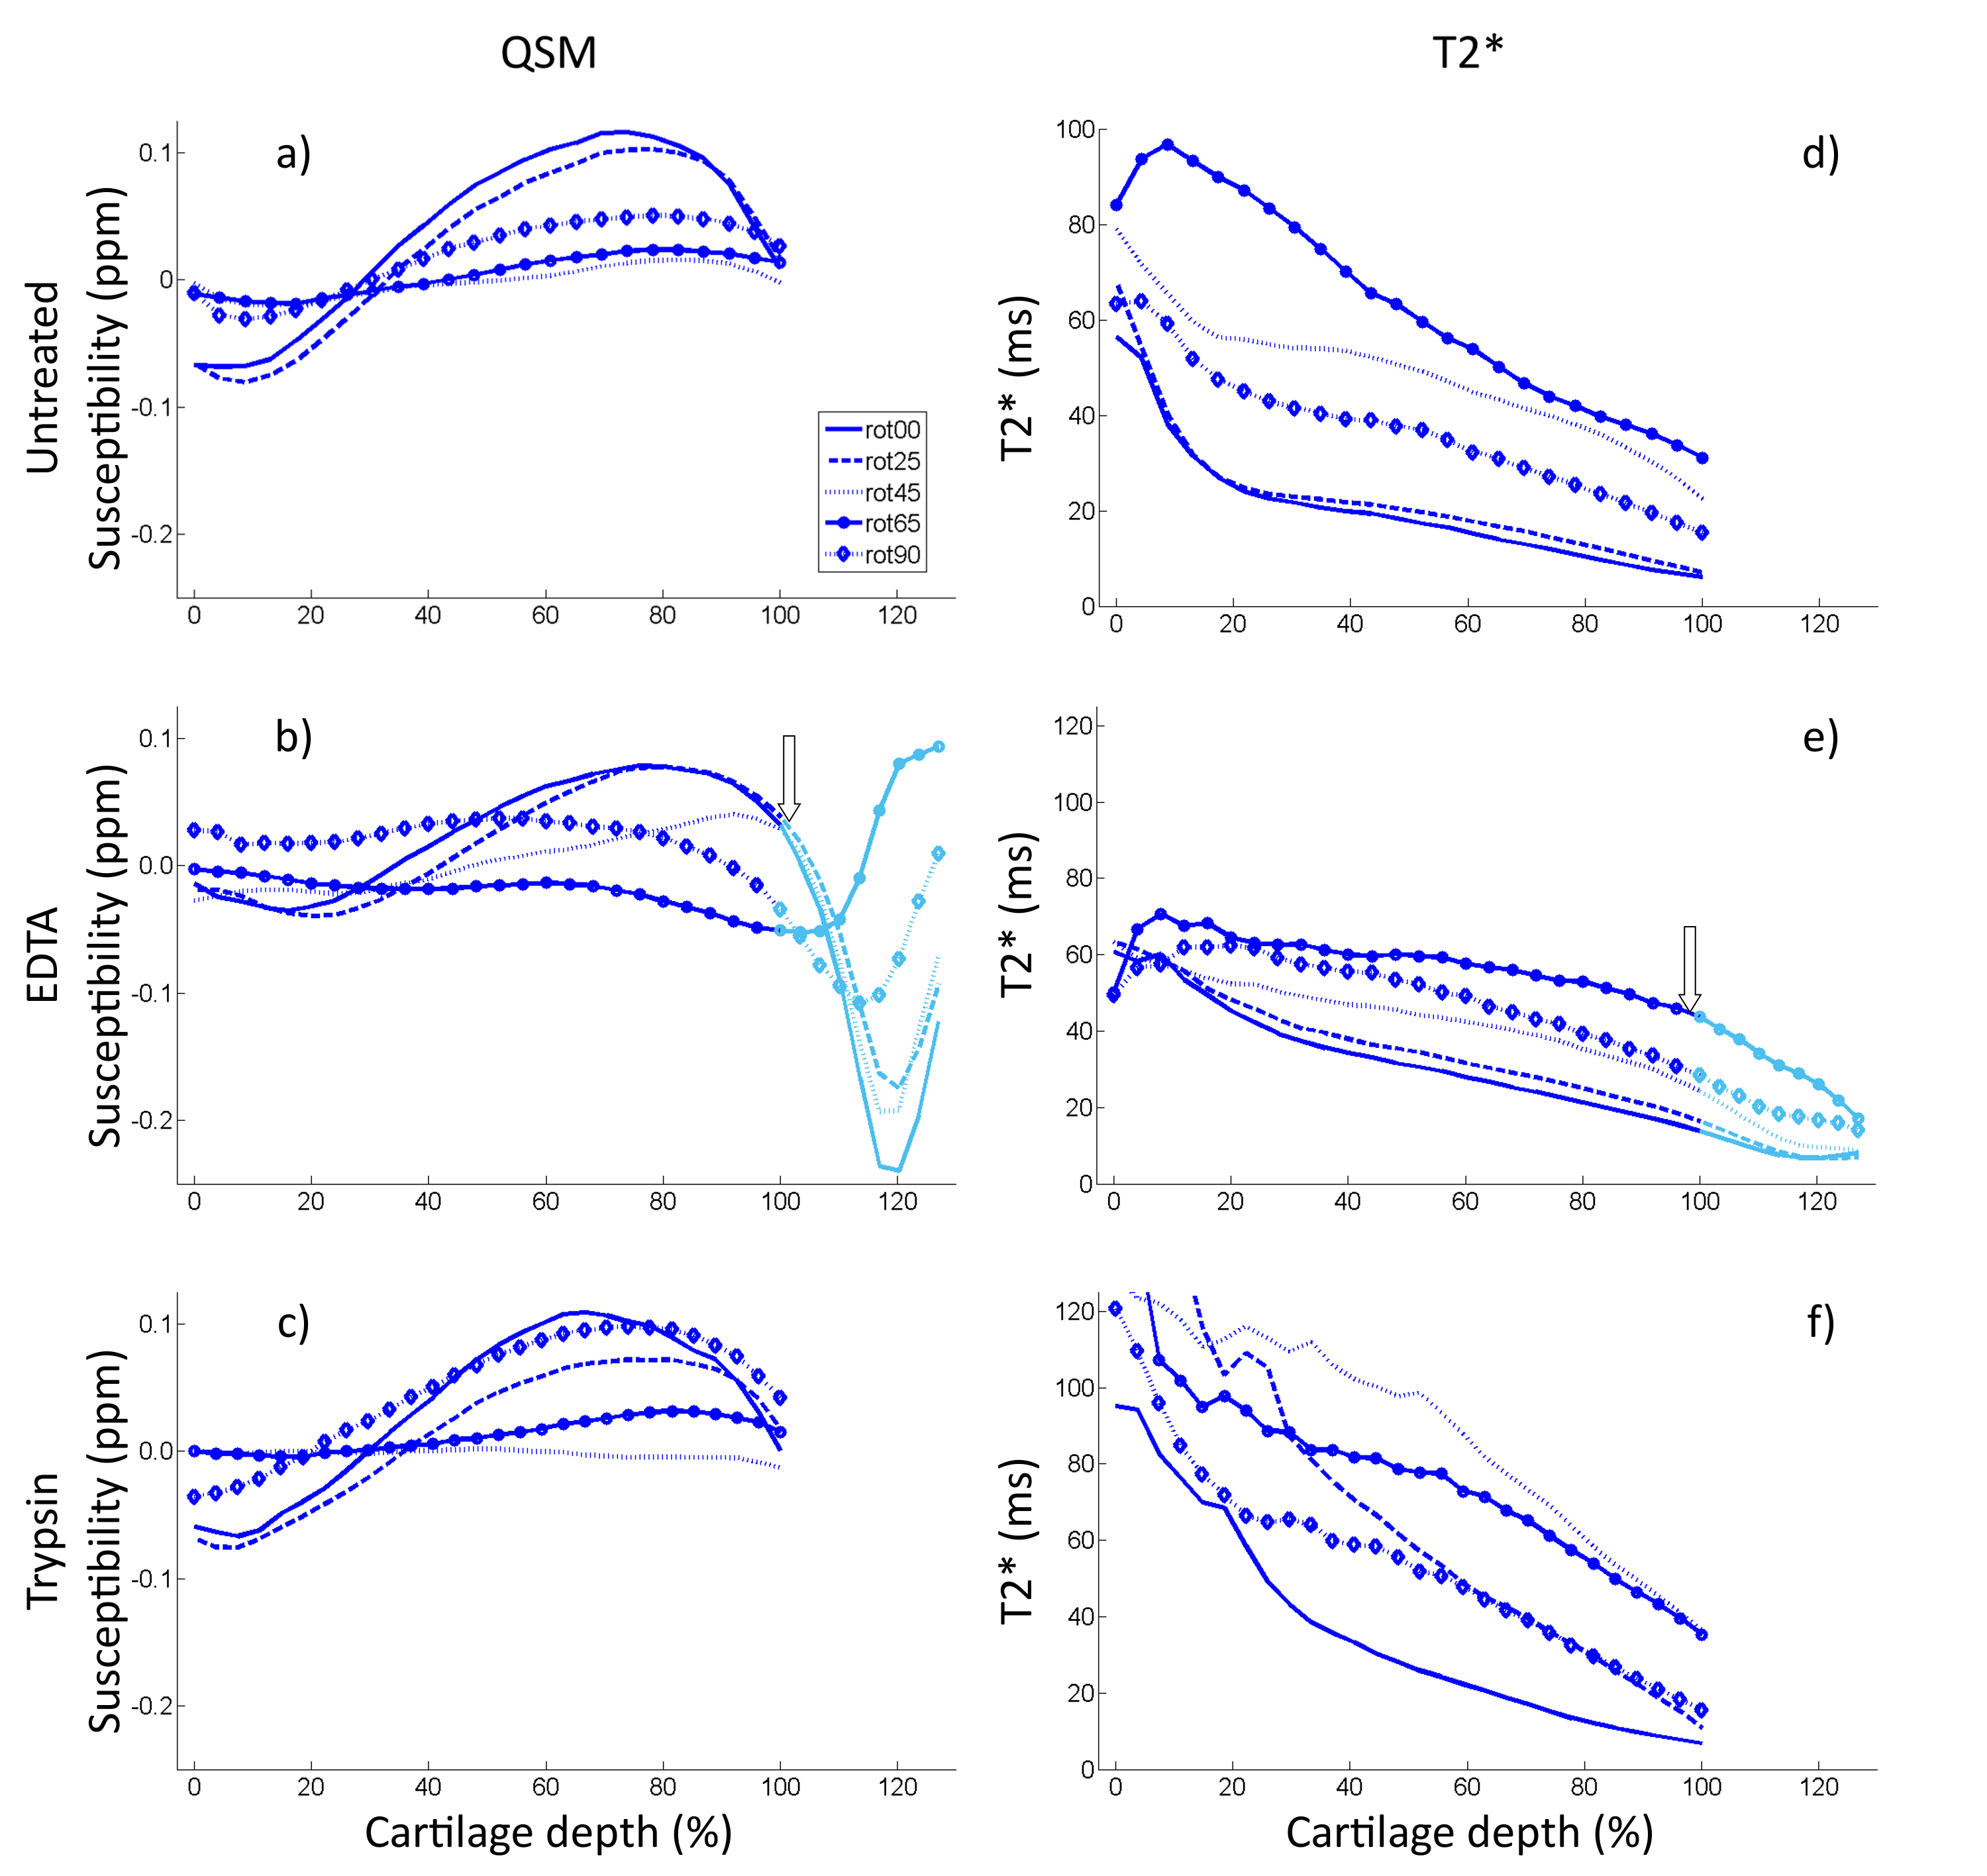
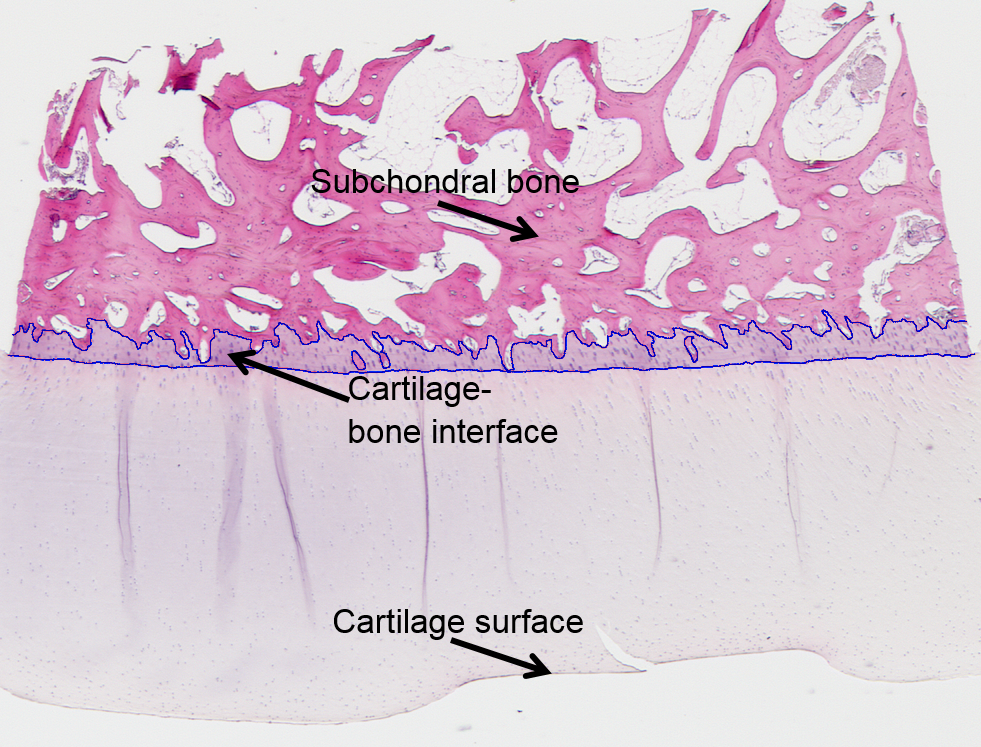
Different treatments had a limited effect on both susceptibility and T2*. Most notable changes were the increases in mid-to-deep cartilage T2* in both EDTA and trypsin treatments (Fig. 2). In EDTA treated samples signal from cartilage-bone interface and subchondral bone became visible and thus both QSM and T2* mapping were performed in the interface also (Fig. 2). Depth-wise susceptibility profiles from cylindrical regions of interest (ROI) in the middle of specimens at different orientations indicated anisotropic susceptibility in both treated and untreated articular cartilage (Fig. 3). At every orientation except 65°, the susceptibility in the untreated and trypsin degraded samples became more paramagnetic with depth from the cartilage surface towards the cartilage-bone interface, with a dip to less paramagnetic values in the deep cartilage (Fig. 3a,e). The susceptibility remained approximately at zero at 45° and 65° (Fig. 3a,e). The decalcified samples showed less increase in susceptibility with depth (Fig. 3c). The cartilage-bone interface, only visible in EDTA treated specimens, appeared diamagnetic in all other orientations except 65°, which seemed paramagnetic instead. T2* was also anisotropic, and in all cases T2* was highest at 65°. EDTA treatment seemed to reduce T2* anisotropy when compared to the untreated and trypsin-treated samples (Fig. 3b,d,f). In the H&E stained histology section (Fig. 4) an area at the cartilage-bone interface corresponding to calcified cartilage can be seen.Conlusions and Discussion
The susceptibility of cartilage changed from superficial to deep cartilage and was discovered to be anisotropic. Anisotropy of the collagen network, also affecting qMRI of cartilage13, is the likely source of the observed anisotropic susceptibility in cartilage7. Increasing calcification in the deep cartilage is expected to cause more diamagnetic susceptibility. However, decalcification treatment with EDTA seemed to make the deep cartilage slightly more diamagnetic at some orientations, suggesting that factors other than calcifications also affect the susceptibility of cartilage. The fact that background field removal makes susceptibility values relative should be taken into account when comparing untreated and treated samples. The susceptibility profiles showed the same characteristics in different samples with the same treatment, implying that the methods used here are stable and that the results are reproducible. Further studies are required to investigate the cause of the observed susceptibility changes in cartilage.Acknowledgements
Support from the Academy of Finland (grants #285909 and #293970) is gratefully acknowledged.References
1. Rautiainen J, Nissi MJ, Salo EN, Tiitu V, Finnilä MA, Aho OM, et al. Multiparametric MRI assessment of human articular cartilage degeneration: Correlation with quantitative histology and mechanical properties. Magnetic Resonance in Medicine. 2014.
2. Wang Y, Liu T. Quantitative susceptibility mapping (QSM): Decoding MRI data for a tissue magnetic biomarker. Magn Reson Med. 2015;73(1):82-101.
3. Dimov AV, Liu Z, Spincemaille P, Du J, Wang Y, editors. Quantitative susceptibility mapping of bone using ultra-short TE sequence 2015: Proc. Intl. Soc. Mag. Reson. Med.
4. He Q, Liu Z, Liu T, Wang Y, Du J, editors. Ultrashort Echo Time Quantitative Susceptibility Mapping (UTE-QSM) of Cortical Bone 2015: Proc. Intl. Soc. Mag. Reson. Med.
5. Nissi MJ, Toth F, Wang L, Carlson CS, Ellermann JM. Improved Visualization of Cartilage Canals Using Quantitative Susceptibility Mapping. PLoS One. 2015;10(7):e0132167.
6. Diefenbach MN, Van AT, Meineke J, Kooijman H, Haase A, Rummeny EJ, et al., editors. On the Feasibility of Quantitative Susceptibility Mapping For Trabecular Bone Volume Density Mapping at 3 T 2016: Proc. Intl. Soc. Mag. Reson. Med.
7. Dibb R, Xie L, Wei H, Liu C. Magnetic susceptibility anisotropy outside the central nervous system. NMR in Biomedicine. 2016.
8. Liu T, Wisnieff C, Lou M, Chen W, Spincemaille P, Wang Y. Nonlinear formulation of the magnetic field to source relationship for robust quantitative susceptibility mapping. Magnetic resonance in medicine. 2013;69(2):467-76.
9. Schofield MA, Zhu Y. Fast phase unwrapping algorithm for interferometric applications. Optics Letters.28(14):3.
10. Zhou D, Liu T, Spincemaille P, Wang Y. Background field removal by solving the Laplacian boundary value problem. NMR in Biomedicine. 2014;27(3):312-9.
11. Shmueli K, de Zwart JA, van Gelderen P, Li TQ, Dodd SJ, Duyn JH. Magnetic susceptibility mapping of brain tissue in vivo using MRI phase data. Magn Reson Med. 2009;62(6):1510-22.
12. Schweser F, Deistung A, Sommer K, Reichenbach JR. Toward online reconstruction of quantitative susceptibility maps: superfast dipole inversion. Magn Reson Med. 2013;69(6):1582-94.
13. Xia Y, Moody JB, Alhadlaq H. Orientational dependence of T2 relaxation in articular cartilage: A microscopic MRI (μMRI) study. Magnetic resonance in medicine. 2002;48(3):460-9
Figures