1554
3D modeling of cartilage surfaces at the knee using clinical magnetic resonance imaging data1Radiology, University of Cambridge, Cambridge, United Kingdom, 2Radiology, Royal National Orthopaedic Hospital, Stanmore, United Kingdom, 3Engineering, University of Cambridge, Cambridge, United Kingdom, 4Division of Trauma & Orthopaedic Surgery, University of Cambridge, Cambridge, United Kingdom
Synopsis
We present a surface-based method for analyzing articular cartilage at the knee using clinical MRI data. This method offers several advantages over existing approaches, including the ability to visualize the spatial distribution of cartilage thickness and compositional parameters, and perform surface-based comparisons between individuals and within individuals over time using statistical parametric mapping. We outline the steps involved in the analysis pipeline and describe initial results in 5 human cadavers and 2 human subjects in vivo, demonstrating the promise of this technique.
Purpose
To develop a surface-based method of analysis and visualization of knee cartilage thickness measurements obtained from clinical MRI data.Introduction
Improved methods of assessing articular cartilage using MRI are desirable to enhance understanding of osteoarthritis (OA) onset and progression and to assess response to putative disease modifying and regenerative treatments targeting cartilage.
Traditional analysis of cartilage using MRI has involved manual segmentation of articular cartilage surfaces. While such techniques have been shown to be accurate and reliable, they suffer from two main drawbacks. First, the manual segmentation is time consuming and represents a considerable resource burden for researchers. Second, the averaging of parameters such as cartilage thickness over relatively large regions of interest (ROIs) may mask clinically important focal changes.
Here we describe a novel technique for semi-automated surface-based measurement of cartilage thickness at the knee using clinical MRI data, adapted from a technique used to measure joint space width in 3D from clinical CT data at the hip1.
Advantages of this technique over existing approaches include the ability to visualize the spatial distribution of thickness measurements or compositional (e.g. T1rho, T2) values across the entire cartilage surface2 and the ability to perform statistically powerful surface-based comparisons – statistical parametric mapping (SPM) – between individuals and within individuals over time.
Methods
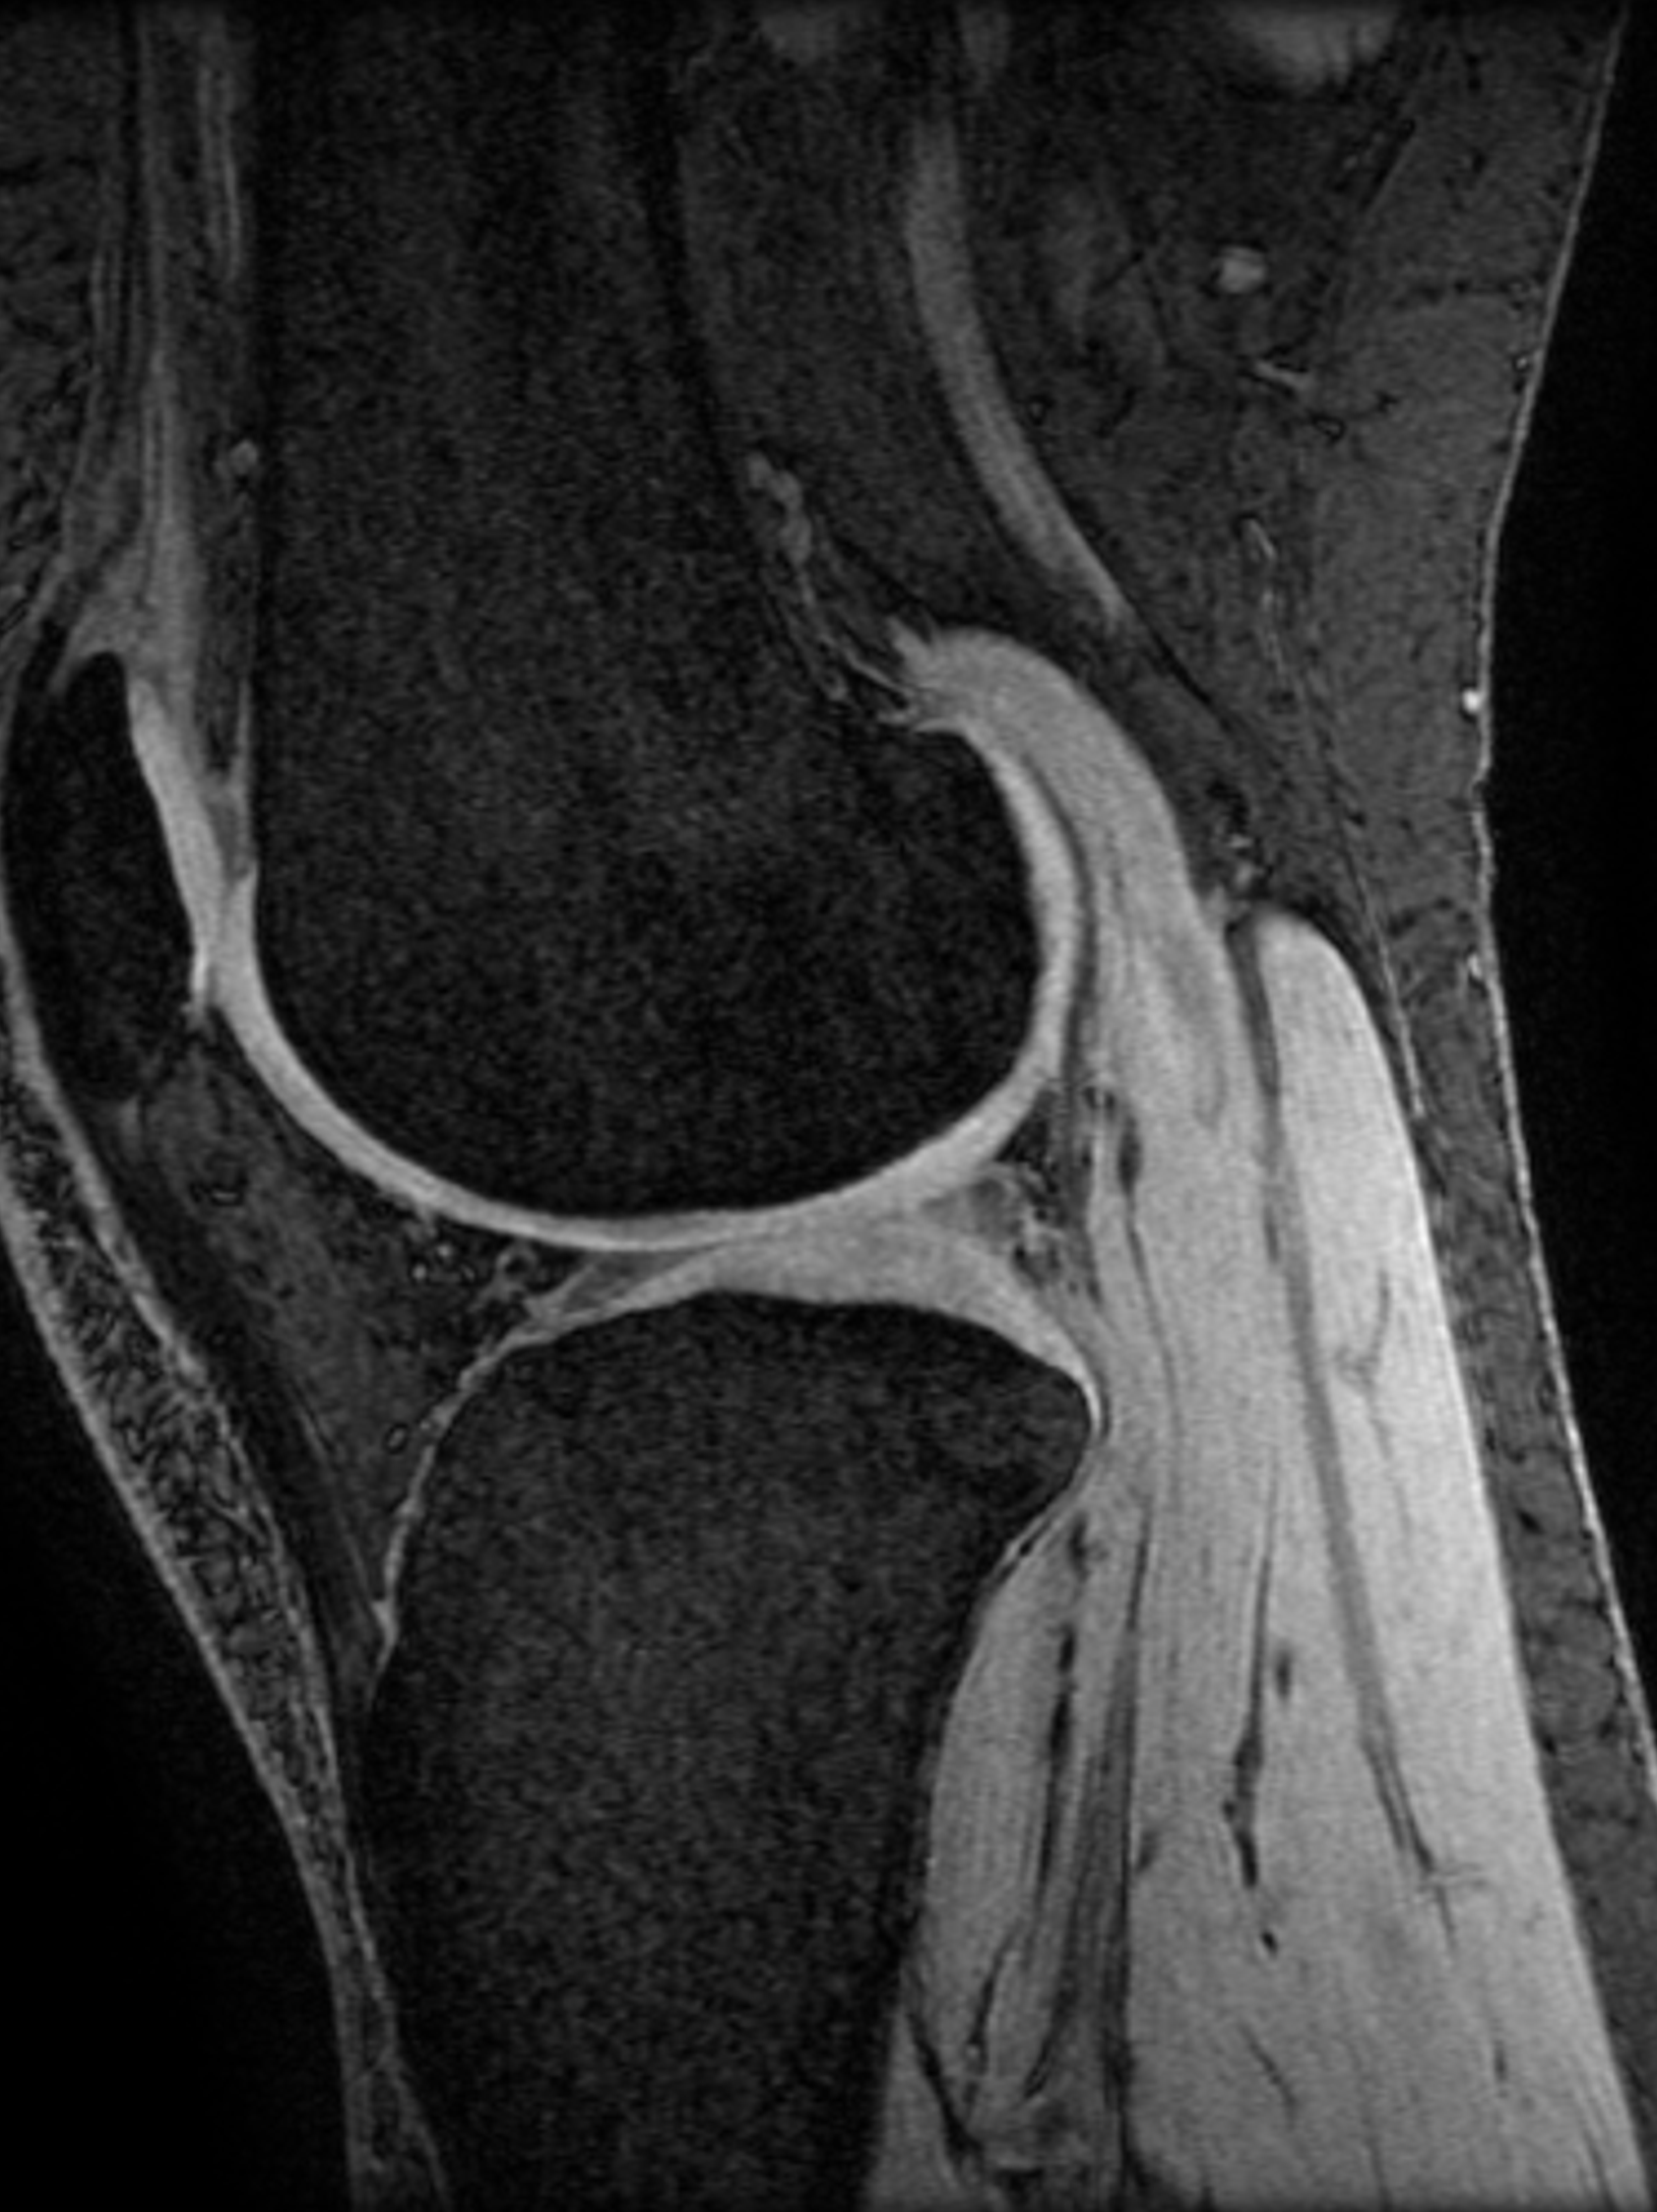
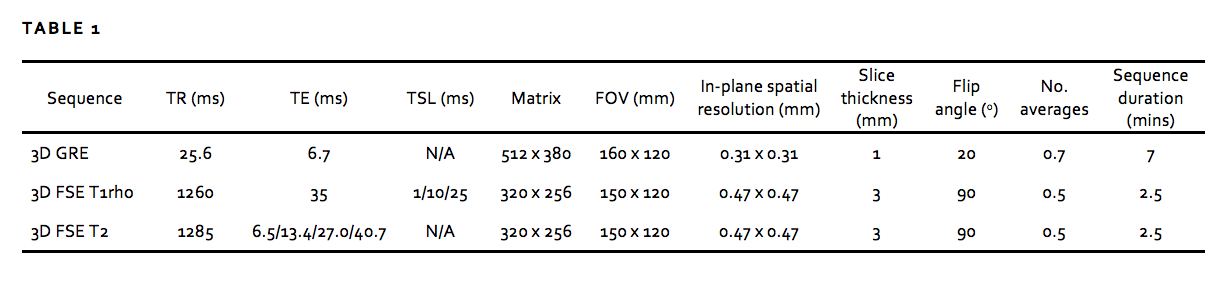
We imaged 5 embalmed human cadaver knees with varying degrees of OA (2 female) and 2 healthy subjects in vivo (both aged 29, 1 female) on a 3T MR platform (GE 750) using an 8-channel knee coil (Invivo). Aiming for optimal spatial resolution and contrast resolution for articular cartilage, we performed a fat-suppressed 3D sagittal gradient echo sequence. An example image is shown in figure 1. For both in vivo subjects, we also performed fat-suppressed 3D fast spin echo T1rho and T2 mapping sequences to evaluate cartilage composition3. MR acquisition parameters are provided in table 1.
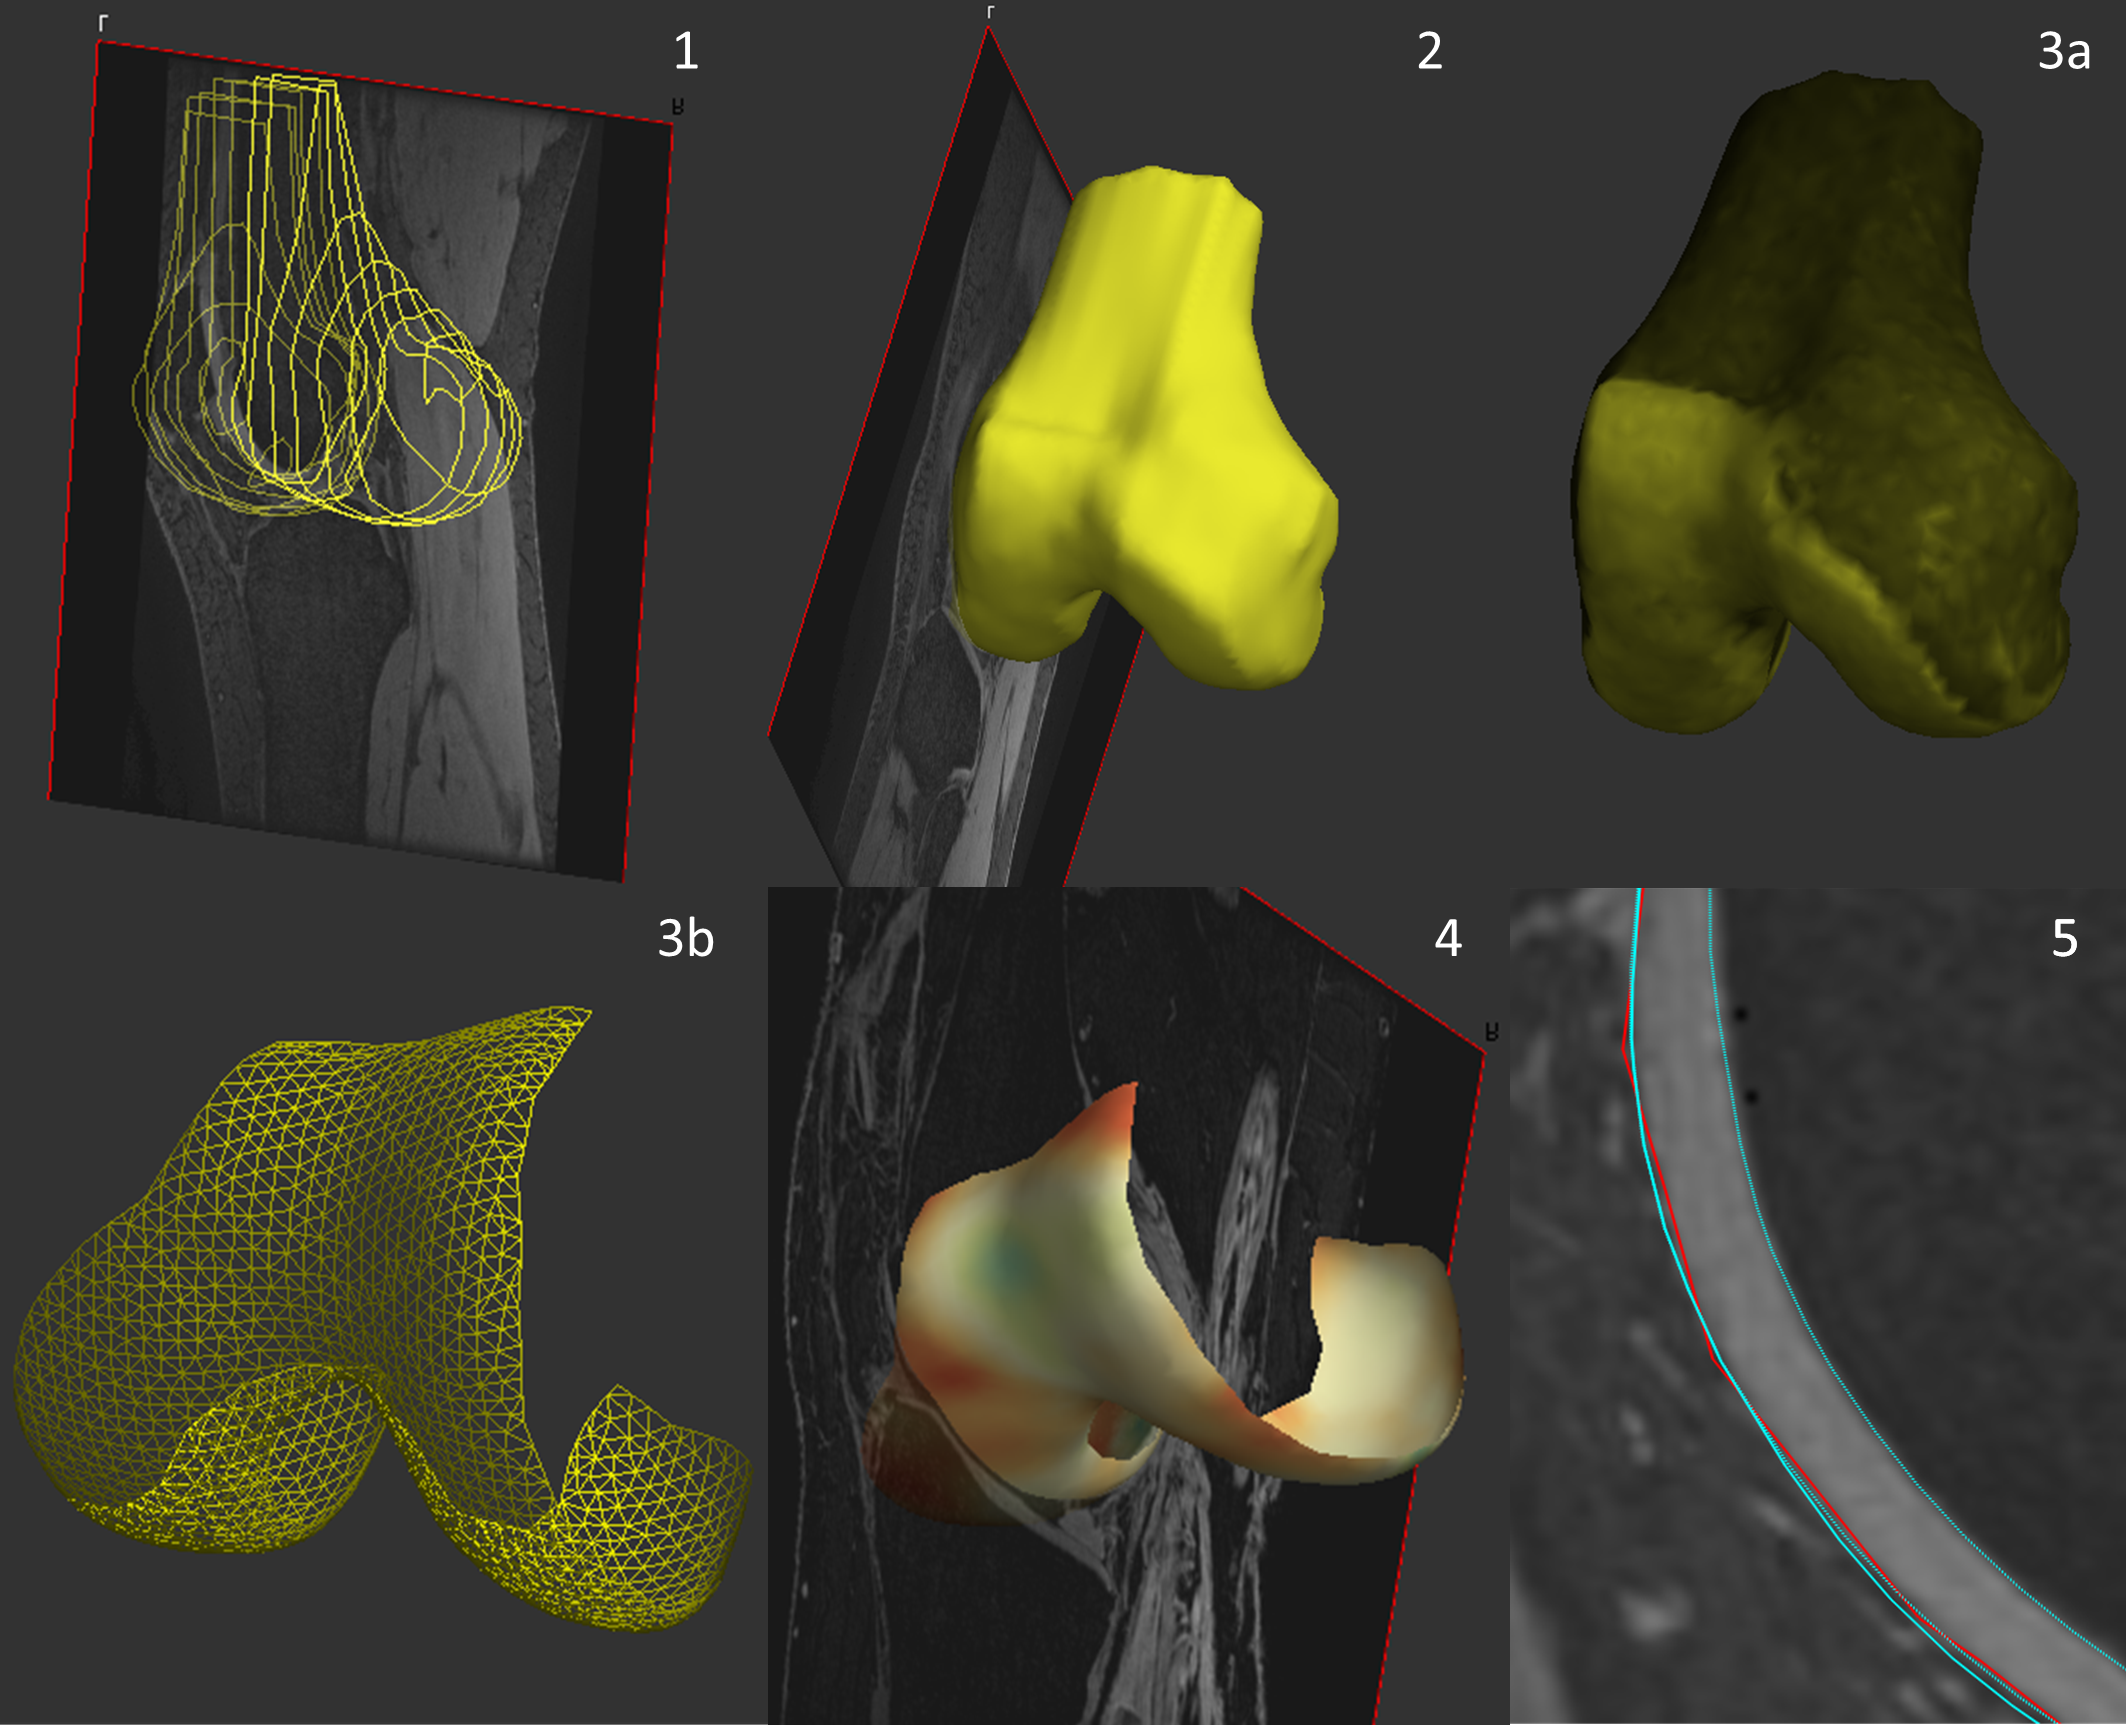
Cartilage analysis is performed using Stradwin, specialized software for surface analysis4 and involves 5 initial steps (figure 2):
1. Approximate manual contour creation (using the outer cartilage border) for femur, tibia, patella. This is only performed on every 5th image (i.e. at 5 mm intervals) as the next step will accurately create the intermediate data.
2. Automatic 3D surface triangulation using the regularized marching tetrahedra method. Volume-preserving surface smoothing allows creation of an accurate surface even from sparse, relatively inaccurate manual contours. This surface acts as a guide for further measurements and does not have to match the cartilage border exactly.
3. Interactive cartilage ‘patch’ segmentation directly onto the 3D surface.
4. Automated cartilage thickness mapping across the patch using a model-based deconvolution of the MRI data sampled along a line orthogonal to the cartilage surface.
5. Generation of cartilage ‘layer objects’ from step 4. This has calculated the location of both cartilage edges with a higher degree of accuracy than the approximate manual contouring performed in step 1.
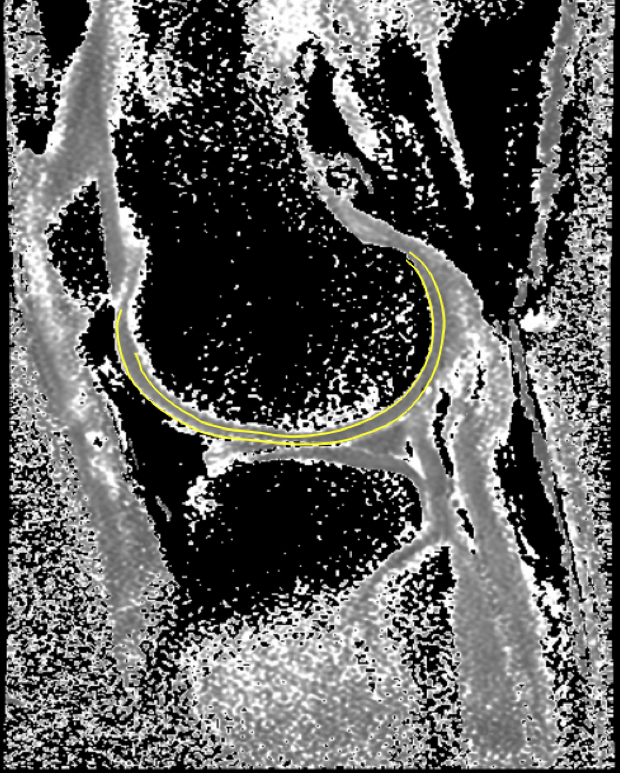
Thickness values can be saved and – with appropriate registration – compared between different subjects or within the same subject over time using SPM. The ‘cartilage layer’ objects can also be imported into other sequences, for example to enable definition of cartilage surfaces on low signal-to-noise ratio compositional maps where accurate delineation is otherwise difficult (figure 3).
Results
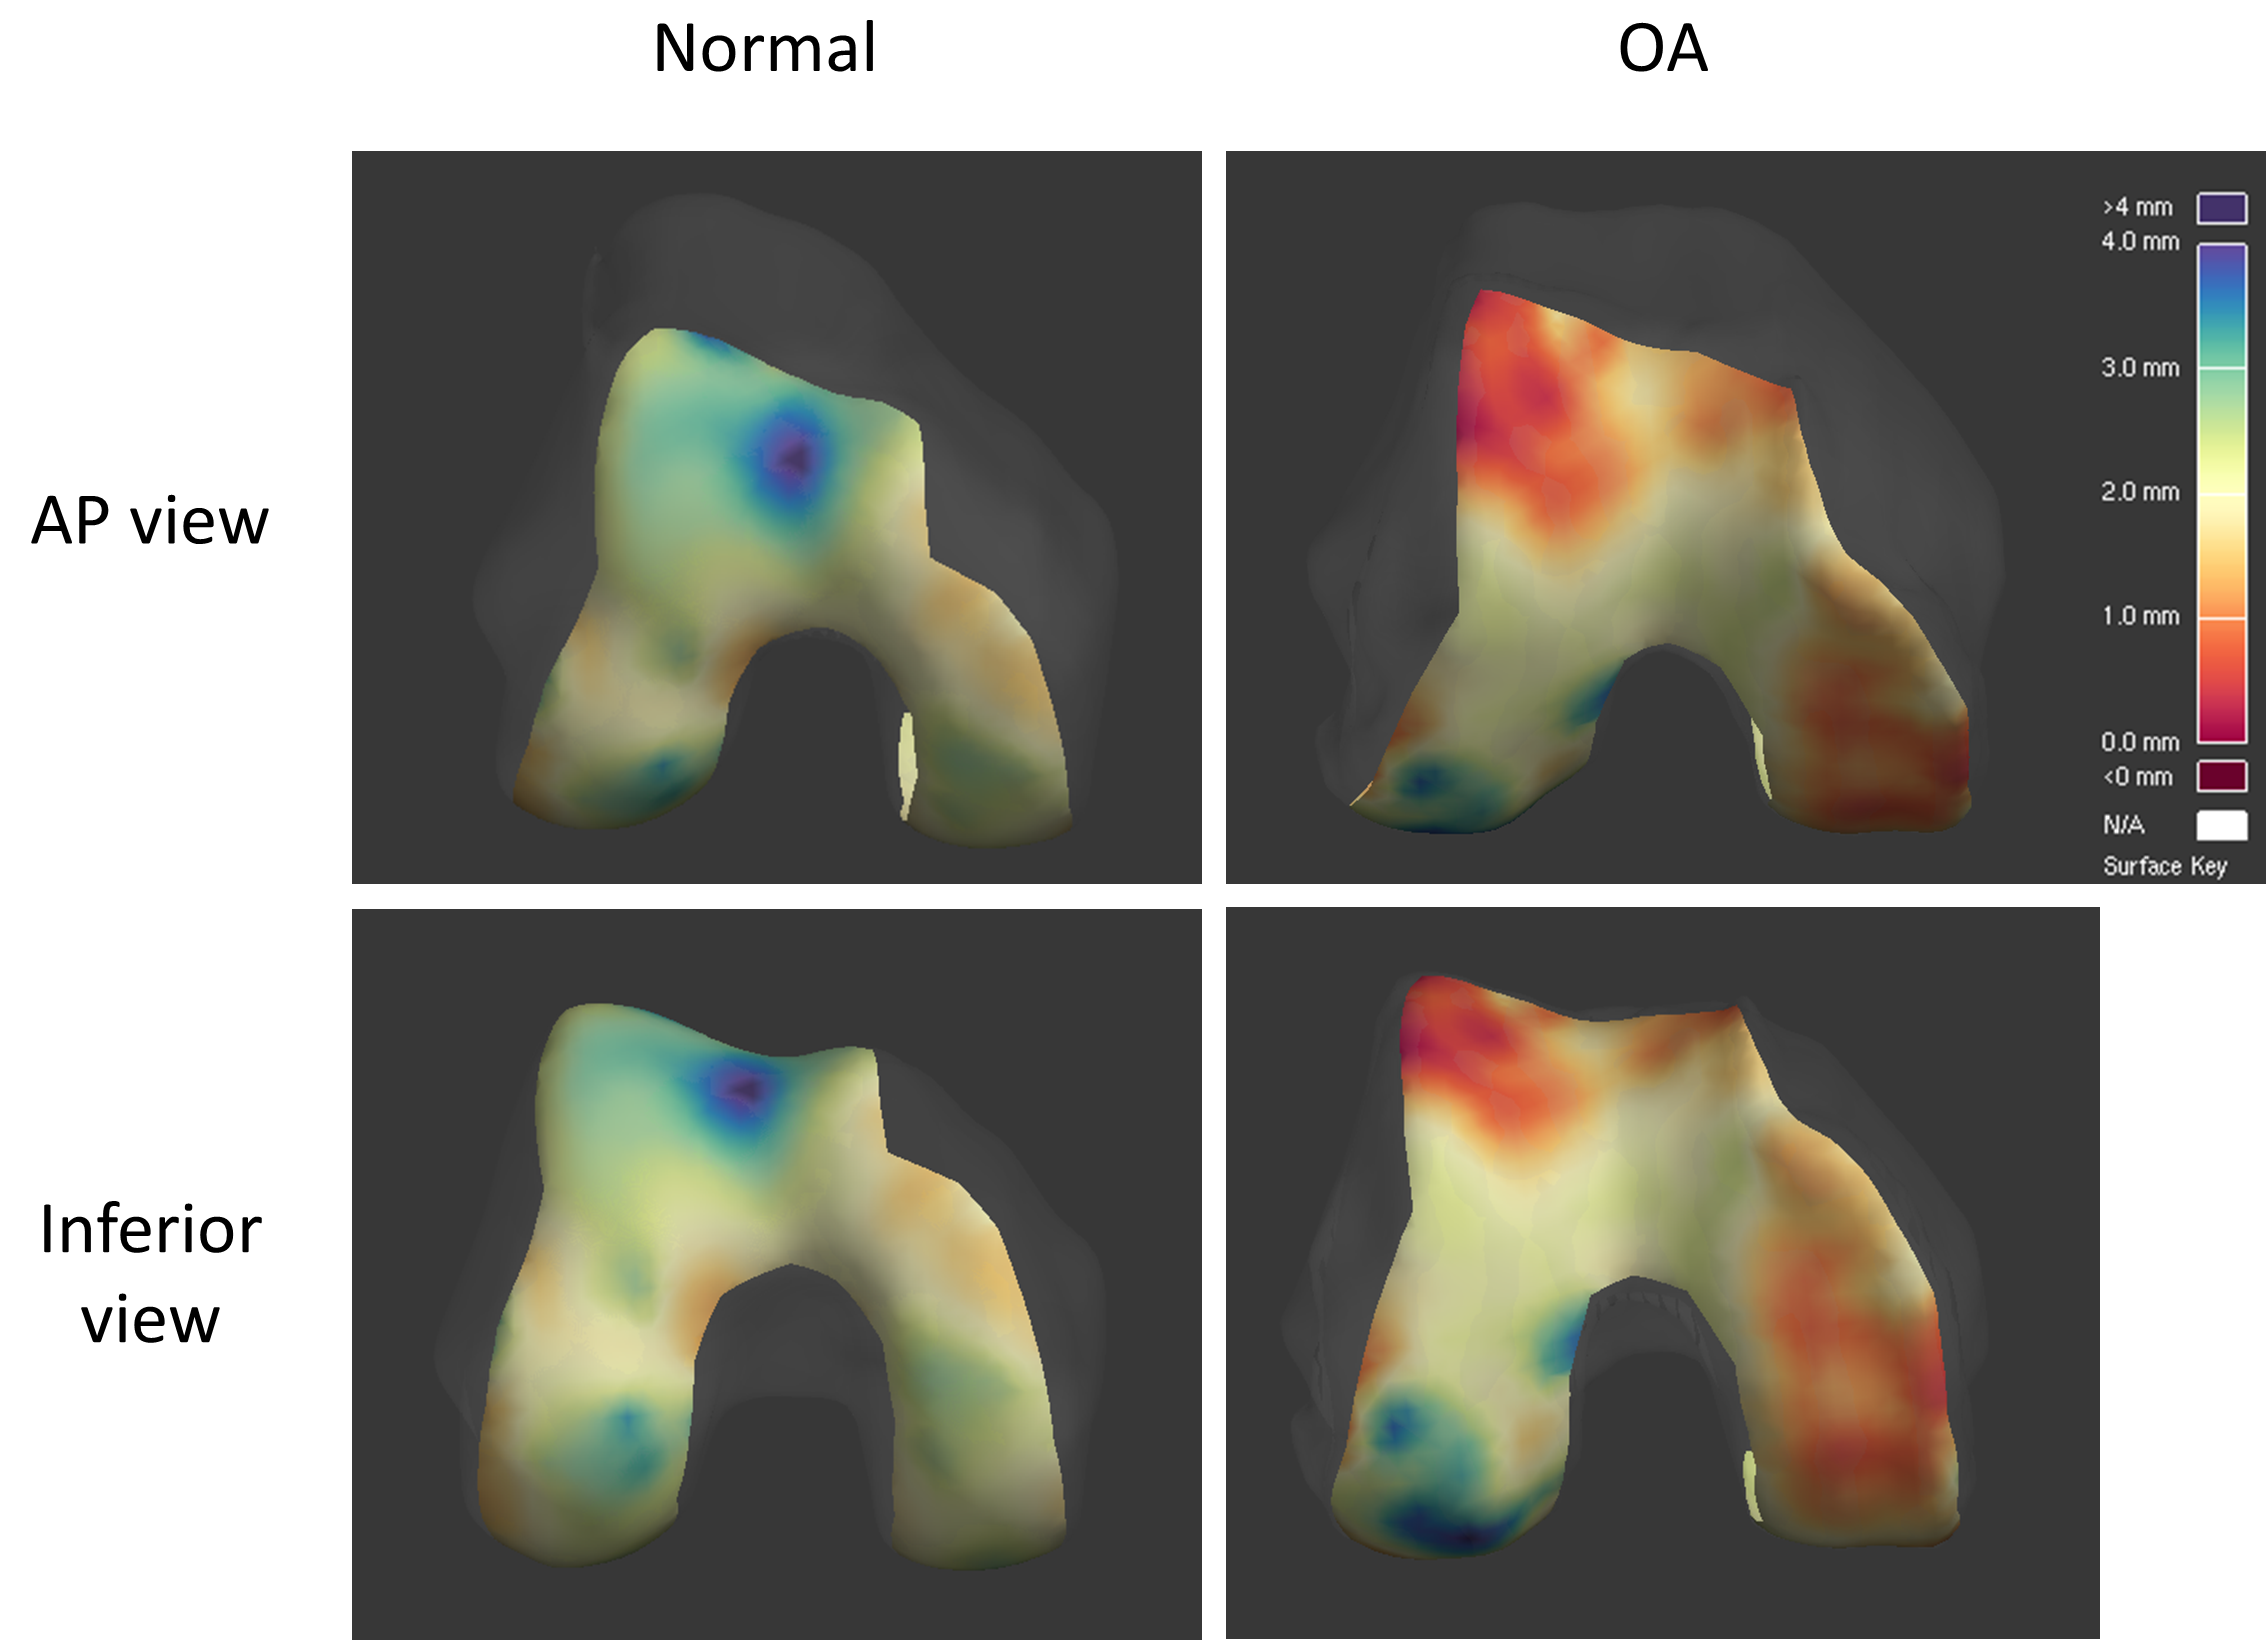
Initial experience has demonstrated that this technique is feasible and simple to perform (approximately 20 minutes per subject to analyze all cartilage regions). Automated cartilage detection agrees subjectively with manual detection. Figure 4 shows thickness maps in a cadaver with no MR features of OA compared to a cadaver with severe medial and patellofemoral compartment OA, illustrating the potential discriminative power of this technique.Discussion
Initial results of this surface-based method for analyzing articular cartilage are promising. Future work will include assessing inter-observer reliability and validating the MR measurements against high-resolution CT measurements of cartilage thickness by disarticulation of the same cadaveric knees used for technique development in MR.Acknowledgements
This work was supported by an Addenbrooke's Charitable Trust Clinical Research Fellowship.References
1. Turmezei TD, Poole KES, Treece GM: 3D measurement of the hip joint space from clinical CT for the assessment and prediction of osteoarthritis. The Lancet 2016;387(S101)
2. Turmezei TD, Gee AH, Poole KES, Treece GM: Joint space mapping: a novel platform for multiparametric quantitative 3D joint analysis from multimodal cross-sectional imaging data. Insights into Imaging 2016;7(S1):S409
3. Kaggie J, Reid S, Houston G, King K, Gallagher F, Graves M: Repeatability of R1rho, R2 and R2* in knee cartilage in: Proc Intl Soc Magn Reson Med 2016;4493
4. http://mi.eng.cam.ac.uk/~rwp/stradwin/. Accessed November 8, 2016
Figures