1553
T1ρ and T2 of Articular Cartilage in the Thumb Carpometacarpal JointMatthew F. Koff1, Parina H. Shah1, Ryan E. Breighner1, Darryl B. Sneag1, Ogonna Nwawka1, and Hollis G. Potter1
1Department of Radiology and Imaging, Hospital for Special Surgery, New York, NY, United States
Synopsis
Radiography is commonly used to evaluate osteoarthritis at the thumb carpometacarpal (CMC) joint, but newer quantitative magnetic resonance imaging (MRI) techniques provide additional information regarding biochemical composition of trapezial (TM ) and 1st metacarpal (MC) articular cartilage. Morphologic MRI and quantitative T1ρ and T2 mapping of the thumb CMC joint was performed. T1ρ and T2 values of the TM and MC were similar, and full ligamentous tears were not found. This pilot study showed that quantitative T1ρ and T2 mapping is feasible at the human thumb CMC joint.
Purpose
The thumb carpometacarpal (CMC) joint, comprised of the trapezium (TM) and 1st metacarpal (MC), is a primary location of osteoarthritis (OA), which affects 20% of women and 6% of men over age 45 (1). Thumb CMC OA is commonly diagnosed and graded using radiographs (2), but radiography suffers from poor grading reliability (3). Magnetic resonance imaging (MRI) utilizes non-ionizing radiation and permits evaluation of not only osseous anatomy, but also soft tissue structures around the thumb CMC joint (4). Quantitative MRI (qMRI) of articular cartilage also provides a numerical basis for evaluation of OA and has shown high measurement repeatability (5). qMRI techniques, such as delayed gadolinium enhanced MRI of cartilage (dGEMRIC), have been applied to the thumb CMC joint (6), but requires the use of exogenous contrast agents. It is advantageous to explore additional qMRI techniques which mitigate these technical challenges. Therefore, the purpose of this study was to evaluate the feasibility of performing non-contrast T1ρ and T2 mapping of the articular cartilage in the thumb CMC joint.Methods
The study was IRB approved with informed written consent. Subjects: 9 volunteers, 3M / 6F, 37.8±11.6 y.o. (mean ± SD), with asymptomatic thumb CMC joints. Image Acquisition: Scanning was performed on a clinical 3T scanner (GE Healthcare) with an 8 channel phased array hand/wrist coil (Invivo, Gainesville, FL). Morphologic multi-planar fast-spin-echo (FSE) images were acquired: echo time (TE): 24 ms, repetition time (TR): 4000 ms, receiver bandwidth (RBW): ±50 kHz, acquisition matrix (AM): 512x352, number of excitations (NEX): 2, field-of-view (FOV): 9 cm, slice thickness (SL): 2-3 mm. Quantitative T1ρ and T2 mapping was performed to evaluate the articular cartilage (7): TR: 7.8 ms, 4 TSLs: 0-60ms, with ΔTSL=20ms, and spin lock frequency=500 Hz, or 7 TEs: 0-45 ms with ΔTE=6.4ms. Both quantitative series utilized: FOV:10 cm, SL: 2 mm, AM: 256 x 160, RBW: ±41.7 kHz. Image Evaluation: The CMC volar oblique and dorsal deltoid ligaments were assessed for abnormal signal intensity or the presence of a tear (8) and the TM and MC articular surfaces were evaluated using a modified Outerbridge score: intact cartilage, partial thickness loss, or full thickness loss. T1ρ and T2 values of the articular cartilages were calculated (Matlab, Natick, MA) using a mono-exponential decay fitting method (9). The articular surfaces were segmented into Dorsal (D), Volar (V), Radial (R), and Ulnar (U) regions as well as separate quadrants (DR, DU, VR, VU) on the TM and MC bones. Statistical Analysis: A Signed Rank test was performed to detect differences of cartilage T1ρ and T2 values for the TM and MC between regions (R/U and D/V). A one way repeated measures analysis of variance was performed to detect differences of T1ρ and T2 values across all quadrants on each bone. Significance was set at p<0.05.Results
All TM and MC articular surfaces had intact cartilage (Figure 1). A majority of dorsal deltoid ligaments were normal (7/9), with the remainder evaluated as “scarred”, while all volar oblique ligaments (9/9) were evaluated as normal. Representative T1ρ and T2 maps are shown in Figure 2. T1ρ and T2 values did not differ between the D/V or R/U regions, or among the quadrants evaluated in the TM or MC (p>0.05 for all comparisons, Figure 3). Regional and quadrant values of T1ρ and T2 tended to be prolonged on the TM as compared to the MC, but was not significant (p>0.05).Discussion
Functional tasks of the thumb CMC joint, such as grasp and fine pinch, may be limited by pain attributable to OA. MRI provides a means to non-invasively and quantitatively evaluate the articular cartilage and surrounding soft tissue joint structures. This study of asymptomatic individuals detected no cartilage degeneration and found no differences of regional or quadrant specific T1ρ or T2 values on either the TM or MC. The uniformity of T1ρ and T2 values may be attributed to the lack of degeneration present. Since cartilage thinning during OA is known to occur primarily within the volar regions of each bone (10,11), we may anticipate concomitant differences of T1ρ and T2. Future evaluations will benefit from increased subject enrollment to permit comparisons between genders and among OA grades.Conclusion
This study showed that quantitative T1ρ and T2 mapping is feasible at the human thumb CMC joint, and provides a normative dataset with which to compare values generated in thumb CMC joints of symptomatic individuals. TM articular cartilage tended to have slightly prolonged T1ρ and T2 values as compared to MC articular cartilage in this asymptomatic cohort.Acknowledgements
The authors would like to acknowledge Roseanne Zeldin RT-(R)(M) Jung Joo RT-(R)(MR) for their assistance with this project.References
1. Peyron JG. Osteoarthritis. The epidemiologic viewpoint. Clin Orthop 1986(213):13-19. 2. Eaton RG, Littler JW. A study of the basal joint of the thumb. Treatment of its disabilities by fusion. J Bone Joint Surg 1969;51A(4):661-668. 3. Berger AJ, Momeni A, Ladd AL. Intra- and interobserver reliability of the Eaton classification for trapeziometacarpal arthritis: a systematic review. CORR 2014;472(4):1155-1159. 4. Hirschmann A, Sutter R, Schweizer A, Pfirrmann CW. The carpometacarpal joint of the thumb: MR appearance in asymptomatic volunteers. Skel Rad 2013;42(8):1105-1112. 5. Li X, Wyatt C, Rivoire J, Han E, Chen W, Schooler J, Liang F, Shet K, Souza R, Majumdar S. Simultaneous acquisition of T1rho and T2 quantification in knee cartilage: repeatability and diurnal variation. JMRI 2014;39(5):1287-1293. 6. Williams A, Shetty SK, Burstein D, Day CS, McKenzie C. Delayed gadolinium enhanced MRI of cartilage (dGEMRIC) of the first carpometacarpal (1CMC) joint: a feasibility study. Osteoarthritis Cartilage 2008;16(4):530-532. 7. Li X, Han ET, Busse RF, Majumdar S. In vivo T(1rho) mapping in cartilage using 3D magnetization-prepared angle-modulated partitioned k-space spoiled gradient echo snapshots (3D MAPSS). Magn Reson Med 2008;59(2):298-307. 8. Connell DA, Pike J, Koulouris G, van Wettering N, Hoy G. MR imaging of thumb carpometacarpal joint ligament injuries. J Hand Surg Br 2004;29(1):46-54. 9. Koff MF, Amrami KK, Felmlee JP, Kaufman KR. Bias of cartilage T(2) values related to method of calculation. Magn Reson Imaging 2008;26(9):1236-1243. 10. Xu L, Strauch RJ, Ateshian GA, Pawluk RJ, Mow VC, Rosenwasser MP. Topography of the osteoarthritic thumb carpometacarpal joint and its variations with regard to gender, age, site, and osteoarthritic stage. J Hand Surg 1998;23A(3):454-464. 11. Koff MF, Ugwonali OF, Strauch RJ, Rosenwasser MP, Ateshian GA, Mow VC. Sequential Wear Patterns of the Articular Cartilage of the Thumb Carpometacarpal Joint in Osteoarthritis. J Hand Surg 2003;28(4):597-604.Figures
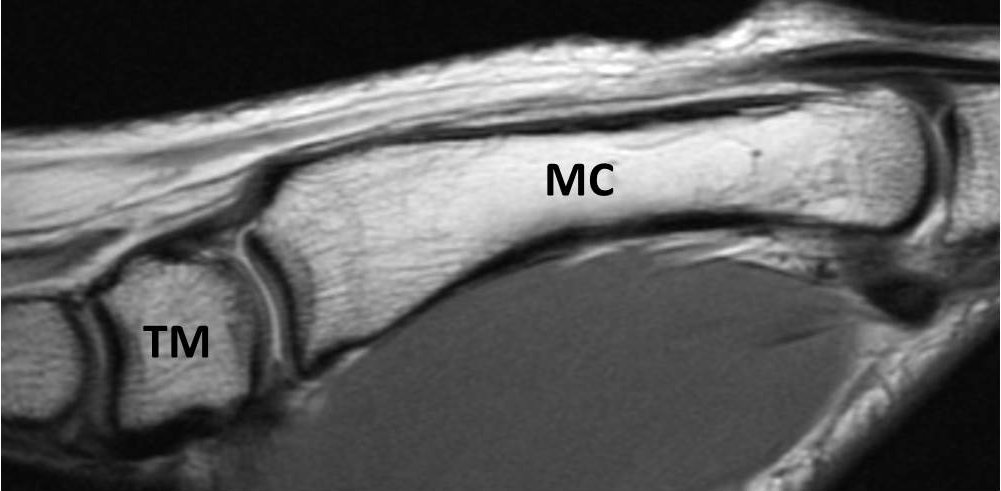
Figure
1. Representative morphologic image of the thumb carpometacarpal joint,
oriented sagittally, displaying the trapezium (TM) and first metacarpal (MC) bones.
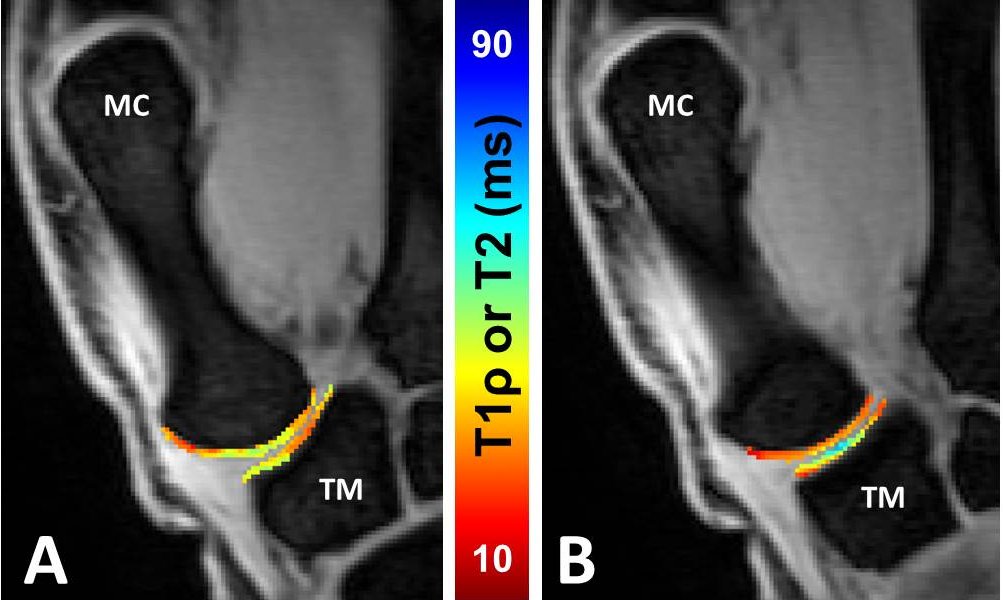
Figure
2.Representative coronal quantitative T1ρ (A) and T2 maps (B) of the thumb trapezium
(TM) and first metacarpal (MC).
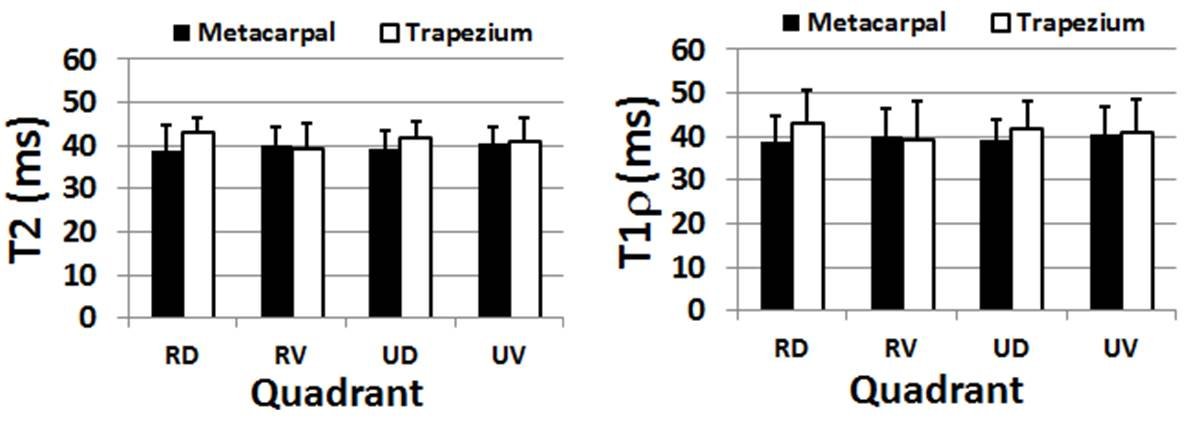
Figure
3. T1ρ values (left) and T2 values (right) of the trapezium and 1st
metacarpal in radial-dorsal (RD), radial-volar (RV), ulnar-dorsal (UD) and ulnar-volar (UV) quadrants. Trapezial T1ρ and T2 values tended to be prolonged relative to the
metacarpal.