1551
The Effect of Fat Saturation on Calculated T2 and T2* Relaxation Times in Articular Cartilage1Mechanical Engineering, Stanford University, Stanford, CA, United States, 2Radiology, Stanford University, CA, United States
Synopsis
This study aimed at identifying differences in T2 and T2* relaxation times in knee cartilage with and without the use of fat suppression. Four volunteers were scanned with 3D cones, 2D multi-echo FSE, and qDESS sequences with and without fat sat. For cones and qDESS, T2* and T2 values increased with use of fat sat. For 2D FSE, values did not change. The results show that use of fat sat can have an effect on quantitative MRI parameters.
Purpose
Osteoarthritis (OA) is a whole joint disease that affects 26.9 million Americans, and costs approximately $5700 per year per patient according to the CDC1. Quantitative MRI parameters such as T2 relaxation times can be used as biomarkers to track early changes in the cartilage collagen matrix associated with OA progression2. However, it is important to understand biases in the quantitative parameters associated with different imaging parameters. It has been shown previously, for example, that calculated T2 in knee cartilage can vary depending on the pulse sequence used3. Fat suppression is used selectively in knee imaging and has been shown to affect quantitative MRI parameters in other areas of the body4. This study investigates the effect of fat sat use on T2 and T2* relaxation times calculated in articular cartilage of the knees.Methods
Four healthy volunteers were scanned on a 3T MRI (GE Healthcare) with a 16-channel flexible phased-array knee coil using a 3D multi-echo, ultra short echo time (UTE) cones sequence5, a 2D multi-echo fast spin-echo (FSE) sequence, and a quantitative double-echo in steady-state (qDESS) sequence, each with and without fat suppression. Imaging parameters used are reported in Table 1. All images were acquired in the sagittal plane. For 2D FSE and cones, T2 and T2* relaxation times were calculated using a monoexponential fit. For qDESS, T2 relaxation times were calculated by fitting the signal ratio of each pixel to a dictionary of T2 values6. Datasets were manually segmented for patellar, femoral, and tibial cartilage, and T2 and T2* values were calculated in cartilage across all slices. Reported differences were calculated by subtracting non-fat sat relaxation times from fat sat relaxation times.Results
T2* relaxation times in the UTE cones sequences and T2 relaxation times in qDESS were greater (Figure 1) with fat suppression than without fat suppression when averaged across all cartilage slices, with T2* and T2 increases of 2.9±0.5 ms and 2.3 ± 0.7 ms, respectively (Figure 2). There was not a consistent increase or decrease in 2D FSE sequences across subjects, however, on average the calculated T2 increased with fat saturation by 0.2±0.5 ms. Although not statistically significant, variation was generally greatest in femoral cartilage (Figure 3).
Discussion
The increase in T2 and T2* when fat suppression is used is consistent with previous studies in the liver, where R2* was reported to decrease when short-T1 inversion recovery (STIR) fat suppression was used4. One possible explanation for the increase in T2 and T2* with fat sat is due to the decrease in image signal-to-noise ratio (SNR). When a chemical fat saturation pulse is applied, in addition to nulling the signal from fat, some water signal is also saturated. This results in a decreased SNR in scans with fat sat pulses. This can particularly affect images acquired with longer echo times with already low SNR, resulting in a flatter exponential fit and a higher fitted value of T2 or T2*. While we were able to observe a trend of higher calculated T2 values when fat suppression is applied, larger studies are needed to observe statistically significant differences and calculate bias due to fat suppression.
Conclusion
In order for quantitative MRI parameters to be clinically useful, they must be calculated in a way that makes them reliably comparable to each other. The results presented here show that fat saturation can affect calculated quantitative MRI parameters. When comparing quantitative MRI parameters, the effect that the sequence used to calculate those parameters has must be considered in addition to the parameter values themselves.Acknowledgements
GE Healthcare, NIH R01EB002524, and NIH K24AR062068.References
1. Osteoarthritis (OA). http://www.cdc.gov/arthritis/basics/osteoarthritis.htm. Accessed 11/8/2016.
2. David-Vaudey E, Ghosh S, Ries M, Majumdar S. T2 Relaxation Time measurements in osteoarthritis. Magnetic Resonance Imaging 2004: vol. 22, Issue 5, 673-682.
3. Matzat SJ, McWalter EJ, Kogan F, Chen W, Gold GE. T2 relaxation time quantitation differs between pulse sequences in articular cartilage. J Magn Reson Imaging. 2015;42:105-113.
4. Meloni A, Tyszka M, Pepe A, Wood J. Effect of Inversion Recovery Fat Supression on Hepatic R2* Quantitation in Transfusional Siderosis. American Journal of Roentgenology. American Journal of Roentgenology. 2015;204: 625-629. 10.2214/AJR.14.12786
5. Gurney, P. T., Hargreaves, B. A. and Nishimura, D. G. (2006), Design and analysis of a practical 3D cones trajectory. Magn. Reson. Med., 55: 575–582. doi:10.1002/mrm.20796
6. Heule, R., Ganter, C. and Bieri, O. (2014), Rapid estimation of cartilage T2 with reduced T1 sensitivity using double echo steady state imaging. Magn. Reson. Med., 71: 1137–1143. doi:10.1002/mrm.24748.
Figures
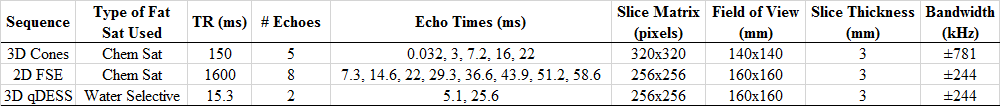
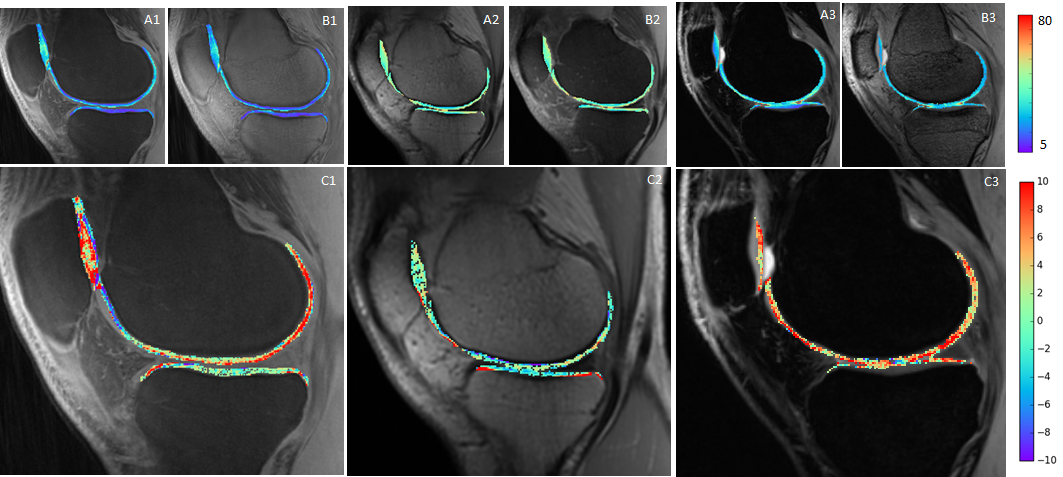
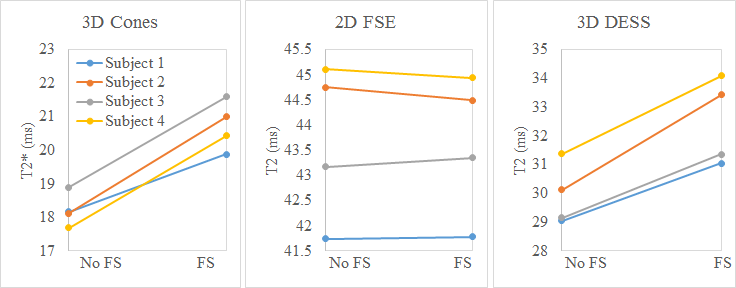
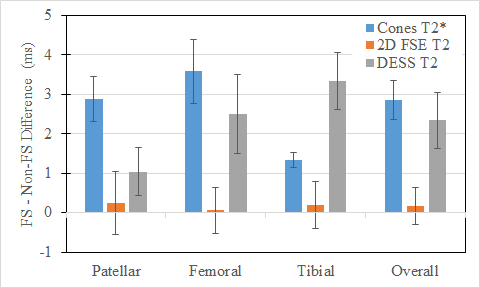
Figure 3. Average differences between patellar, femoral, tibial, and all cartilage for entire volume of each sequence. No significant regional variation was observed in the current dataset.