1550
A prospective natural history study on cartilage composition changes in patients with low-grade cartilage injury1Translational Medicine, Novartis Institutes for Biomedical Research, Basel, Switzerland, 2Biomedical Imaging and Image-guided therapy, Medical University of Vienna, Vienna, Austria, 3Research Unit of Medical Imaging, Physics and Technology, University of Oulu, Oulu, Finland, 4Institutes for Biomechanics, ETH, Zurich, Switzerland, 5Traumatology, Medical University of Vienna, Vienna, Austria
Synopsis
Changes in the macromolecular structure of articular cartilage were monitored in patients with a low-grade cartilage defect by using a comprehensive, compositional MRI approach over a period of 6 months. Preliminary results showed that, while no large change in glycosaminoglycan contents was observed, the bi-layer structure bound to the collagen fiber organization may have been further deteriorated over time.
Introduction
Knee cartilage damage has very limited ability to heal itself. If left untreated, a small cartilage defect can eventually progress into a higher grade lesion (as defined by the ICRS), causing severe pain, inflammation and disability. However, due to the invasiveness of the procedure, subtle morphometric changes may not always be detected by arthroscopic ICRS grading while the defect slowly worsens. This process is typically associated with the breakdown of major matrix molecules, making glycosaminoglycans (GAG) and collagen as disease biomarkers of particular interest for future patient studies on cartilage repair. We have reported that an ICRS Grade I/II cartilage injury in the femoral region could clearly be identified from loosening of the collagen network and loss of GAG content, through a combination of T2 mapping1, 23Na-MRI2 and gagCEST-MRI3. Each method proved to be reproducible with ICC values of ~0.77, ~0.97 and ~0.56, respectively. Here, we present preliminary data showing how sensitive this comprehensive MRI approach might be to detect further progression of cartilage damage.Methods
Imaging sessions were performed at baseline, 8-day, 3 and 6-month on subjects (first 11 completers, out of 15 in total) with ICRS Grade I/II cartilage defects in the femoral condyle region. Cartilage T2 maps were reconstructed from images obtained on two MR Siemens scanners operating at 7T and 3T using a 3D-TESS sequence1. Sodium images were acquired at 7T using a 3D vTE-GRE sequence4. For gagCEST at 7T, a series of ten 60-ms adiabatic full passage hs2 RF pulses followed by spoiling gradients in all 3 directions with interpulse delays of 20 ms preceded the 3D RF-spoiled GRE sequence5. Nineteen scans with equidistant (92 Hz) offsets in the range of ±2.8 ppm around the water resonance and a scan without saturation were collected. Z-spectra were extracted from registered images and their asymmetry (MTRasym) was calculated from integrals over the offset range ±∂ = 0.6–1.8ppm relative to the minimum of each individual Z-spectrum. Regions of interest were defined from PD-FSE morphological images in the suspicious regions for defective and normal appearing cartilage (weight bearing-WBR and non-weight bearing-NWBR regions), and transferred to T2, sodium and gagCEST images for quantitative analysis of the collagen network organization and GAG content. Finally, the functional status of each patient was assessed via the Knee injury and Osteoarthritis Outcome Score (KOOS) questionnaire.Results
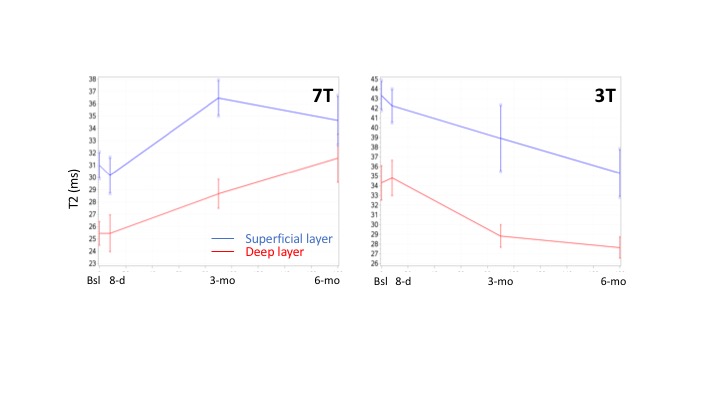
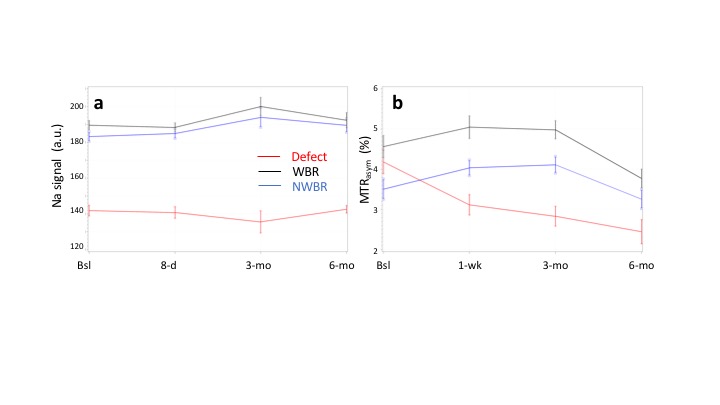
At baseline, slightly higher T2 values were measured in deep and superficial layers of the defective region vs the healthy WBR region, especially at 3T (Deep: ~32.6 vs ~23.1 ms, p=0.018; Superficial: ~41.8 vs ~35.4 ms, p=.075) but also at 7T (Deep: ~24.5 vs ~21.6 ms, p=.433; Superficial: ~29.9 vs ~28.6 ms, p=.559). However, at both fields, corresponding T2 ratios appeared ~15% greater in the cartilage defect vs WBR (3T: 0.79±0.21 vs 0.66±0.09, p=.086; 7T: 0.83±1.32 vs 0.74±0.13, p=.094). Over the 6-month follow-up period, while T2 values increased by up to 20% (p=.069) and 21% (p=.016) at 7T, a T2 decrease by up to 16% (p=.084) and 27% (p=.080) was observed at 3T in deep and superficial layers, respectively (Figure 1). Meanwhile, 23Na-MRI corrected signal intensities were ~25% lower in the defective vs weight-bearing (WBR) and non-weight bearing (NWBR) regions, with no large variation over the whole 6-month period (Figure 2a). Apart from slightly higher MTRasym values at baseline in the defective region vs WBR and NWBR areas, the rest of gagCEST measurements at 8-day, 3-month and 6-month appeared in good agreement with 23Na-MRI results (Figure 2b). Finally, KOOS results did not reveal any meaningful changes over time.Discussion
The discrepancy observed in the direction of T2 changes when measured over 6 months at 7T or 3T, may reflect the influence of the short and long components of T2 relaxation on the assessment of the bi-layer structure. A change in either collagen fiber orientation (i.e. through the short T2 component at 7T, in particular in the deep cartilage zone with anisotropic collagen fiber orientation) or water content in the vicinity of collagen fibers (i.e. through the long T2 component at 3T, in particular in the superficial zone with randomly oriented collagen fibers and increase of water due to surface defects) could explain such a difference; however this warrants further investigation. Regardless, these preliminary results point to a progressive alteration of the bi-layer structure in the defective region (despite stable KOOS), without large changes in GAG levels over the observation period. Such data support the use of MRI as a good alternative to cartilage biopsy for the detection of subtle changes in cartilage composition.Acknowledgements
No acknowledgement found.References
1. Juras V, Laurent D, Zbyn S et al. An assessment of the repeatability and sensitivity of T2 mapping in low-grade cartilage lesions at 3 and 7 tesla. Proc Intl Soc Mag Reson Med (2016)
2. Zbyn S, Mlynarik V, Juras V et al. In vivo evaluation of low-grade cartilage defects in the knee using sodium MRI at 7T.Proc Intl Soc Mag Reson Med (2016)
3. Laurent D, Zbyn S, Mlynarik V, et al. Use of comprehensive MRI to assess cartilage composition in patients with acute cartilage injury.Proc Intl Soc Mag Reson Med (2016)
4. Deligianni X., et al., High-Resolution Fourier-Encoded Sub-Millisecond Echo Time Musculoskeletal Imaging. Magn Reson Med. 2013;70,1434-39.
5. Mlynarik V, Zbyn S, Schreiner M, et al. Comparison of gagCEST and sodium MRI in evaluating knee cartilage in vivo at 7 tesla. Proc Intl Soc Mag Reson Med (2016)
Figures