1549
Cartilage T2 Relaxation Times in Both Knees of Healthy Individuals1Human Biology, Stanford University, Stanford, CA, United States, 2Radiology, Stanford University, Stanford, CA, United States, 3Electrical Engineering, Stanford University, Stanford, CA, United States, 4Bioengineering, Stanford University, Stanford, CA, United States
Synopsis
The ACL-injured population is predisposed to developing radiographic Osteoarthritis post injury. Quantitative biomarkers such as T2 relaxation times evaluate the macromolecular composition of the cartilage matrix. Assessing the variation in this quantitative measure between knees of healthy individuals can help us identify degenerative difference brought on by injury. Using projection maps and pre-defined compartments, we measured the T2 relaxation times and quantified intrinsic differences between the knees of a group of healthy volunteers using coefficient of variation. This study demonstrates that there are similar T2 relaxation times for the left and right knees of healthy individuals.
Purpose
Osteoarthritis (OA) is a degenerative joint disease1, which is expected to affect 25% of U.S. adult population by 20302. It has been shown that up to 51% of ACL-injured individuals develop radiographic OA 12 years post-injury3. In assessing injury related longitudinal changes to the cartilage extracellular matrix, it is important to understand what variations exist between uninjured knees. Studies using advanced MRI techniques, such as T2 and T1rho imaging as non-invasive biomarkers4,5, have compared the injured and contralateral knees of an ACL-injured population6,7. These comparisons have typically been made under the assumption that both knees have similar starting quantitative measures before injury. To date, no study has run a comparison between the left and right knees of a healthy population. This study aims to compare the T2 relaxation times of the cartilage between both knees in a group of healthy volunteers.Methods
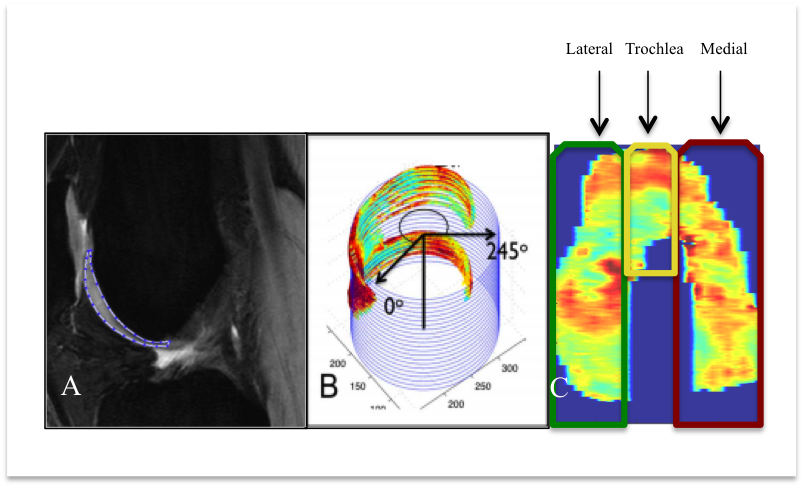
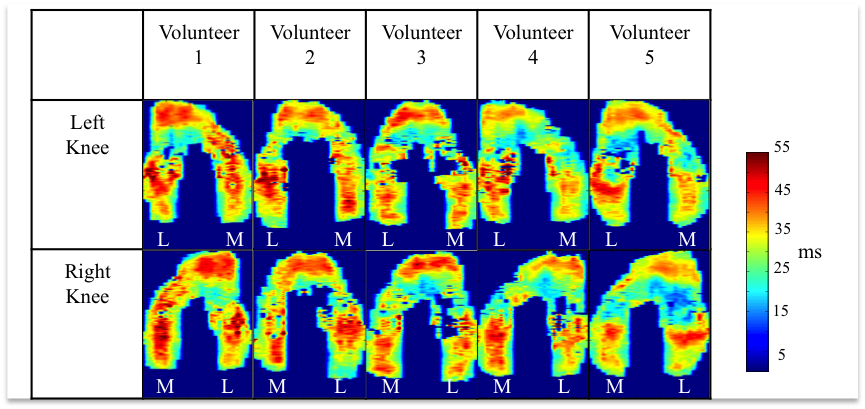
Five volunteers with no history of knee pain or injury had their left and right knees scanned at 3T (GE Healthcare, Milwaukee, WI) using a 16-channel Flex knee coil. A quantitative double-echo in steady-state (DESS) sequence was used along with complex signal models for T2 mapping8. We acquired sagittal scans with a 16cm FOV, 256x256 matrix, TR of 17.6ms, TEs of 5.1ms and 30.1ms, 3mm slice thickness and 2:43min scan time. The femoral cartilage was manually segmented using the morphological DESS images (Fig. 1A) and T2 relaxation times were extracted from the determined T2 maps. Projection maps were created using a best-fit cylinder to the full cartilage volume9 and these maps were split into the medial, lateral and trochlear compartments (Fig. 1B & C and Fig. 2). The mean and standard deviation for each compartment in each knee was calculated as well as the global mean and standard deviation (across all compartments). The coefficient of variation was calculated between the T2 relaxation times of the left and right knees for each region.Results
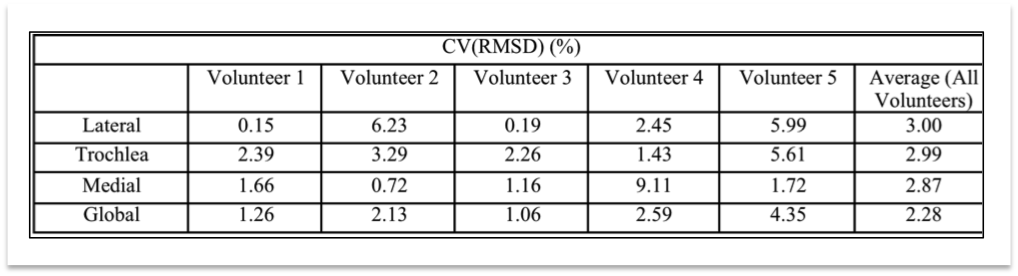
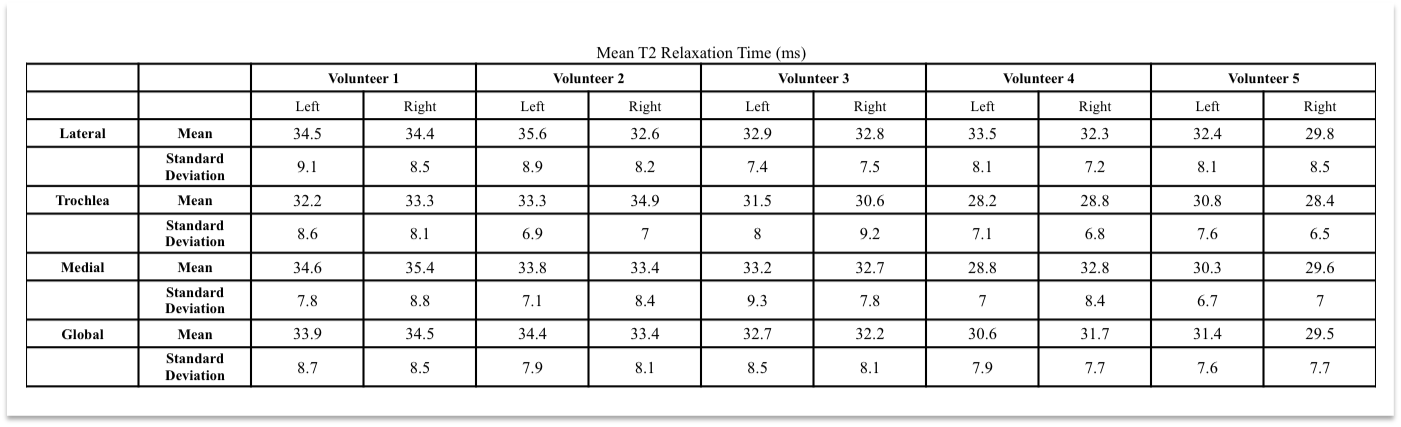
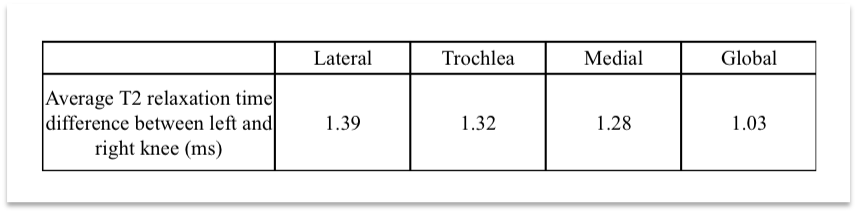
Calculated coefficients of variation were less than 10% (Table 1). The average T2 relaxation time differences between the left and right knees (ms) were 1.39 [range: 0.0723 - 3.01] for the lateral compartment, 1.32 [range: 0.575 -2.35] for the trochlear compartment, 1.28 [range: 0.340 - 3.97] for the medial compartment, and 1.03 [range: 0.487 - 1.87] for the global femoral cartilage (Table 3).Discussion
The coefficients of variation between the left and right knees of our healthy volunteers are well within short-term reproducibility CV values previously reported for cartilage T2 relaxation times in a healthy volunteer group10. Although no prior study has looked at the intrinsic side-to-side differences in an uninjured population, one prior study found that healthy subjects had mean T2 values of 32.1–35.0 ms, while patients with mild and severe OA had mean T2 values of 34.4–41.0 ms11. It was also found that healthy subjects had lower T2 values by 4-6 ms than subjects with severe OA11. Our T2 relaxation times are lower than the published T2 relaxation times in knees with mild and severe OA and are consistent with the healthy knees from the literature. Within our healthy volunteer group, none of the averaged compartment differences were more than 1.39ms (Table 3), which is below the OA T2 differences reported in literature. Further studies are needed to evaluate whether other quantitative measures of femoral cartilage, such as T1rho, are similar between a healthy patient’s left and right knee. A larger population of subjects would be helpful.Conclusion
The reported CV values for the T2 femoral cartilage relaxation times between the left and right knees demonstrate the similarity of both knees across multiple compartments.Acknowledgements
R01 EB002524, K24AR062068, R01 AR0063643, Arthritis Foundation, GE HealthcareReferences
1. Braun H. J., Gold G. E. Bone. 2012; 51(2):278–288. doi: 10.1016/j.bone. 2011.11.019.
2. Hootman JM, Helmick CG. Arthritis Rheum. 2006; 54:226-9.
3. Lohmander LS, Ostenberg A, Englund M, Roos H. Arthritis Rheum 2004; 50(10):3145–3152.
4. T. Baum, G.B. Joseph, D.C. Karampinos, P.M. Jungmann, T.M. Link, J.S. Bauer. Osteoarthritis Cartilage, 21 (2013), pp. 1474–1484.
5. Duvvuri, U., Reddy, R., Patel, S. D., Kaufman, J. H., Kneeland, J. B. and Leigh, J. S. (1997), Magn. Reson. Med., 38: 863–867. doi:10.1002/mrm.1910380602
6. Haughom B, Schairer W, Souza RB, Carpenter D, Ma CB, Li X. Knee. 2012;19(4):482–7. doi:10.1016/j.knee.2011.06.015.
7. Pedoia, V., Su, F., Amano, K., Li, Q., McCulloch, C. E., Souza, R. B., Link, T. M., Ma, B. C. and Li, X. (2016), J. Orthop. Res.. doi:10.1002/jor.23398
8. Staroswiecki E, Granlund KL, Alley MT, Gold GE, Hargreaves BA. Magn Reson Med 2012;1096:1086–1096.
9. Monu, U., Jordan, C., Samuelson, B., Hargreaves, B., Gold, G., & Mcwalter, E. Osteoarthritis and Cartilage. 2016. doi:10.1016/j.joca.2016.09.015.
10. Jordan CD, McWalter EJ, Monu UD, Watkins RD, Chen W, Bangerter NK, Hargreaves BA, Gold GE. Osteoarthritis and Cartilage 2014; 22(10): 1559–1567.
11. T.C. Dunn, Y. Lu, H. Jin, M.D. Ries, S. Majumdar. Radiology, 232 (2) (2004), pp. 592–598.
Figures