1547
Biomechanical T2-mapping in osteoarthritis with 3D-TESS at 7T MRI1Department of Biomedical Imaging and Image-guided Therapy, High Field MR Centre, Medical University of Vienna, Vienna, Austria, 2Department of Orthopedic Surgery, Medical University of Vienna, Vienna, Austria, 3Department of Radiology, Division of Radiological Physics, University of Basel Hospital, Basel, Switzerland, 4Christian Doppler Laboratory for Clinical Molecular MR Imaging, Vienna, Austria
Synopsis
Biochemical MRI of hyaline cartilage shows promising results for the evaluation of OA. In this study we implemented in-vivo compression and a fast 3D-TESS sequence at 7T for cartilage transversal relaxation time (T2)-mapping of healthy volunteers and patients with risk factors for the development of early osteoarthritis of the knee (OA). Results show a location-dependent and differing behavior of T2-values under compression between the two groups, further increasing the value of T2-values as possible biomarker for OA.
Introduction
The quantification of T2-values in MRI
provides information of water content and collagen architecture of hyaline
cartilage and is sensitive to changes induced by compression (1). Therefore, T2-values may serve as a biomarker for
the early detection of OA, opening new diagnostic possibilities for this
burdening disease. However, degenerative processes in OA-progression and
complex changes of cartilage components, especially under dynamic loading
conditions, complicate the interpretation of resulting T2-values, necessitating
more detailed insights.
Arthroscopic
partial meniscectomy (APM) is a common surgery for the treatment of meniscal
injury (2), but, by itself, was
shown to pose a risk factor for developing OA(3-5) and to change local
cartilage composition (6) in as early as 6 months after surgery.
In our study, we evaluated the in-vivo
alterations of T2-values in hyaline knee cartilage of healthy volunteers and
patients one year after APM under defined cycles of compression at 7T. The ultra-high
field strengths allowed us to exploit the higher resolution and to greatly
reduce acquisition time by implementing a three-dimensional-triple-echo-steady-state
sequence (3D-TESS)(7).Methods
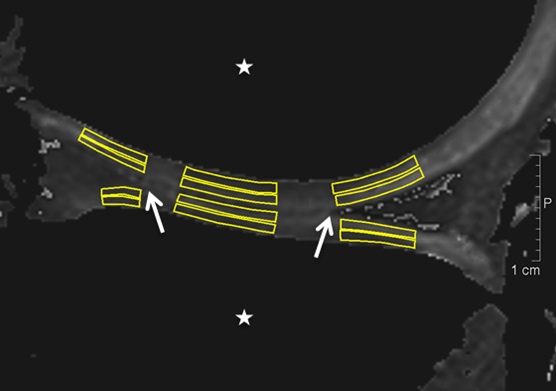
Ten healthy volunteers and ten patients participated in the study. To evaluate the health state of volunteers, we applied exclusion criteria, assessed the Knee-injury-and-Osteoarthritis-Outcome-Score (KOOS)-questionnaire in both groups and conducted a morphological evaluation on fat-suppressed proton density weighted images. We scanned all subjects in a supine position under “no load – load – no load”-conditions (Figure 1) using force corresponding to 250 Newton induced by an MR-compatible compression device at 7T with a 28-channel knee coil. The scanned knees were in extension and fastened to the compression device. The subject’s pelvis was fixed to the MRI table by a dedicated belt and the foot of the examined side was positioned rotationally neutral on the footplate of the compression device. T2-maps were calculated from 3D-TESS-images, and regions-of-interest (ROIs) were drawn on two consecutive slices (Figure 2). T2-values were measured in each ROI and cartilage zone. The differences between loading conditions in the volunteer and patient groups, respectively, were evaluated with a repeated measures ANOVA and pairwise post-hoc tests with a Bonferroni-correction. Further, a Mixed-Model-ANOVA was applied for comparison of the volunteer and patient groups during equal loading stages. P-values of ≤0.05 were considered as statistically significant.Results
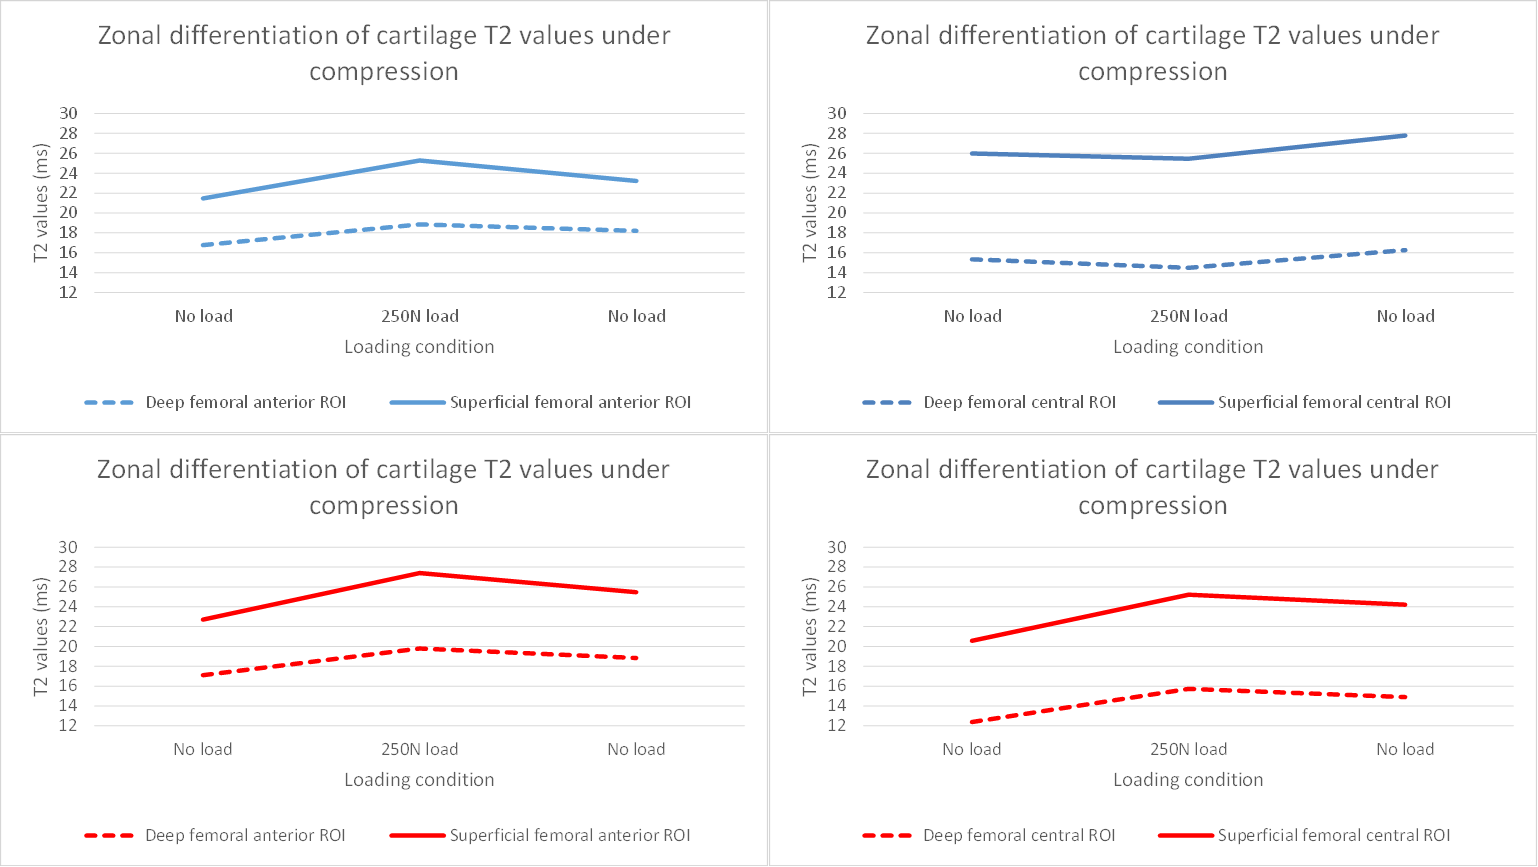
In both groups, we observed on average 50% higher T2-values in the superficial ROIs than in the deep ROIs (p=0.0001 and p=0.001).
In healthy volunteers, a significant increase of T2-values was observed in ROIs adjacent to compressed cartilage compared to non-loaded conditions in the superficial and deep femoral anterior ROIs (15%, p=0.003; 11%, p=0.017), superficial and deep tibial anterior ROIs (16%, p=0.003; 13%, p=0.02) and superficial tibial posterior ROI (17%, p=0.025). The other ROIs adjacent to compressed cartilage showed also a trend towards increased T2-values, however, this was not significant (Figure 3).
In healthy volunteers, all the ROIs in the load bearing central region showed a decrease in T2 values in both superficial and deep femoral and tibial cartilage, however, this was not significant.
In patients, a significant increase of T2-values could be shown in ROIs adjacent to compressed cartilage, comparable to healthy volunteers. However, ROIs in the load bearing central region of patients also showed a significant increase of T2-values instead of a decrease as shown in healthy volunteers.
In both groups, there was no significant change of T2-values in the control-ROI during the whole compression-cycle (<1% and <3%, respectively).
Discussion
In our study, we could show a difference in the change of T2-values
under real-time compression between healthy volunteers and patients after APM. In
healthy volunteers, decreased T2-values in the load bearing centre of cartilage
and increased T2-values in adjacent cartilage may indicate distribution of
water in cartilage under compression. Our results are in accordance with a
recently published in-vitro study (8),
demonstrating the possibility of non-invasively measuring complex physiological
processes in knee cartilage.
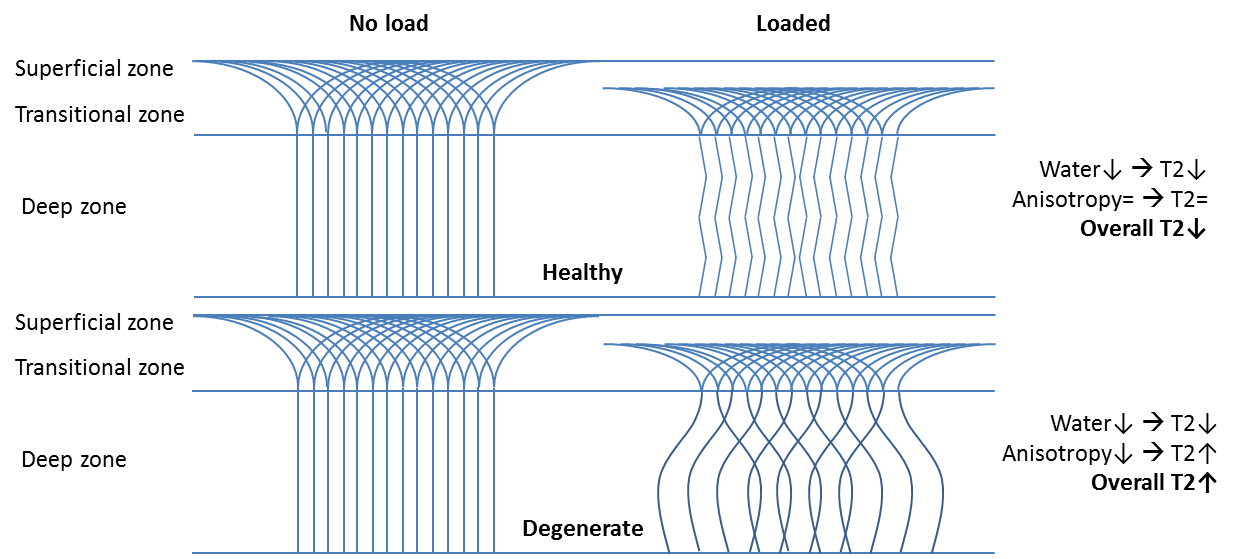
In comparison, this decrease of T2-values could not be witnessed in the
patients group. A possible explanation may be the differing behaviour of
collagen bundles under compression in degenerate cartilage (Figure 4).Conclusion
Healthy cartilage and cartilage of patients with riskfactors for the development of early OA show differing biomechanical behaviour of T2-values.
In our study, we could show the location-dependent change of T2-values under compression which was recently reported by an in-vitro-study (8).
Acquisition time was reduced by 74% compared to sequences used in previous knee cartilage compression studies (3D-TESS 1:58min, CPMG 7:35min(1)).
3D-TESS at 7T allows fast monitoring of in-vivo knee cartilage T2-values under compression. It may provide new insights to the biomechanical physiology and pathology of knee cartilage.
Acknowledgements
No acknowledgement found.References
1. Schoenbauer E, Szomolanyi P, Shiomi T, Juras V, Zbyn S, Zak L, et al. Cartilage evaluation with biochemical MR imaging using in vivo Knee compression at 3T-comparison of patients after cartilage repair with healthy volunteers. J Biomech. 2015 Jun 30. PubMed PMID: 26184585.
2. Kim S, Bosque J, Meehan JP, Jamali A, Marder R. Increase in outpatient knee arthroscopy in the United States: a comparison of National Surveys of Ambulatory Surgery, 1996 and 2006. J Bone Joint Surg Am. 2011 Jun 1;93(11):994-1000. PubMed PMID: 21531866.
3. Eichinger M, Schocke M, Hoser C, Fink C, Mayr R, Rosenberger RE. Changes in articular cartilage following arthroscopic partial medial meniscectomy. Knee Surg Sports Traumatol Arthrosc. 2015 Feb 20. PubMed PMID: 25697283.
4. McDermott ID, Amis AA. The consequences of meniscectomy. J Bone Joint Surg Br. 2006 Dec;88(12):1549-56. PubMed PMID: 17159163.
5. Papalia R, Del Buono A, Osti L, Denaro V, Maffulli N. Meniscectomy as a risk factor for knee osteoarthritis: a systematic review. Br Med Bull. 2011;99:89-106. PubMed PMID: 21247936.
6. Souza RB, Wu SJ, Morse LJ, Subburaj K, Allen CR, Feeley BT. Cartilage MRI relaxation times after arthroscopic partial medial meniscectomy reveal localized degeneration. Knee Surg Sports Traumatol Arthrosc. 2015 Jan;23(1):188-97. PubMed PMID: 24792070.
7. Heule R, Ganter C, Bieri O. Triple echo steady-state (TESS) relaxometry. Magnetic Resonance in Medicine. 2014;71(1):230-7.
8. Nebelung S, Sondern B, Oehrl S, Tingart M, Rath B, Pufe T, et al. Functional MR Imaging Mapping of Human Articular Cartilage Response to Loading. Radiology. 2016 Aug 26:160053. PubMed PMID: 27564133.
9. Wang N, Kahn D, Badar F, Xia Y. Molecular origin of a loading-induced black layer in the deep region of articular cartilage at the magic angle. Journal of magnetic resonance imaging : JMRI. 2015 May;41(5):1281-90. PubMed PMID: 24833266. Pubmed Central PMCID: 4233195.
10. Mosher TJ, Dardzinski BJ. Cartilage MRI T2 relaxation time mapping: overview and applications. Seminars in musculoskeletal radiology. 2004 Dec;8(4):355-68. PubMed PMID: 15643574.
Figures