1545
Knee dGEMRIC at 7 T: Validation against 1.5 T and comparison of T1 mapping methods1Dept. of Translational Medicine, Lund University, Malmö, Sweden, 2Dept. of Orthopedics, Skåne University Hospital, Lund, Sweden, 3Dept. of Medical Imaging and Physiology, Skåne University Hospital, Lund, Sweden
Synopsis
dGEMRIC (delayed Gadolinium Enhanced Magnetic Resonance Imaging of Cartilage) is a well-established technique for cartilage quality assessment in osteoarthritis at 1.5 T. The aim of this study was to establish dGEMRIC at 7 T by validation against 1.5 T and comparison of three T1 mapping methods: inversion recovery, variable flip angle and look locker. Both healthy volunteers and patients with early signs of osteoarthritis were scanned at both field strengths postcontrast. We conclude that dGEMRIC is feasible at 7 T and that inversion recovery is the preferred T1 mapping approach at 7 T.
Purpose
dGEMRIC (delayed Gadolinium Enhanced Magnetic Resonance Imaging of Cartilage) is a well-established technique for cartilage quality assessment in osteoarthritis at clinical field strengths.1 The method is robust,2 but requires injection of contrast agent and a cumbersome examination procedure. New non-contrast-agent-based techniques for cartilage quality assessment are currently being developed at 7 T.3 However, dGEMRIC is an important reference technique during this development. The aim of this work was to establish dGEMRIC as a method at 7 T by validation against 1.5 T and comparison of three T1 mapping methods: inversion recovery (IR), variable flip angle (VFA), and look locker (LL).4Methods
The lateral and medial condyle of the knee of 8 healthy volunteers and 3 patients with early signs of osteoarthritis as observed during arthroscopy were examined at both 1.5 T (Philips Ingenia) and 7 T (Philips Achieva AS). The examinations started from 120 minutes after injection (0.2 mmol/kg, Magnevist) with either 7 T (6 subjects) or 1.5 T (5 subjects) first. Time between scans was kept as short as possible. At both field strengths, a series of 2D IR acquisitions (TI = 50, 100, 200, 400, 800, 1600, and, at 7 T only, also 3800 ms) were used to measure a single sagittal slice in each femoral condyle. The remaining imaging parameters at 1.5 T/7 T were set to: TE = 7 ms, TR = 2000 ms/4000 ms, echo train length = 11, and pixel bandwidth = 402 Hz/338 Hz. AT 7 T, either 3D VFA or 3D LL T1 mapping was additionally performed and a DREAM B1 mapping sequence was acquired.5 For VFA, flip angles 7° and 39°, TE = 2.7 ms, TR = 30 ms and BW = 338 Hz was used. For LL, 24 TI times (24 ms-3474 ms), flip angle = 6°, TE = 2.7 ms, TR = 5000 ms, echo train length = 15, and BW = 338 Hz was used and each excitation pulse was separated by 5.1 ms. All sequences were acquired with a voxel size of 0.7x0.7x3 mm3.
T1 maps were reconstructed from all three methods. For LL and VFA, both B1 uncorrected and B1 corrected images were constructed. B1 correction was based on an average B1 within a region-of-interest (ROI) in the cartilage tissue of interest. For all methods, the average T1 was estimated in a single ROI drawn in each lateral and medial data set, respectively, covering the load-bearing part of the femoral cartilage. The final T1 values were corrected for BMI differences.6
Results
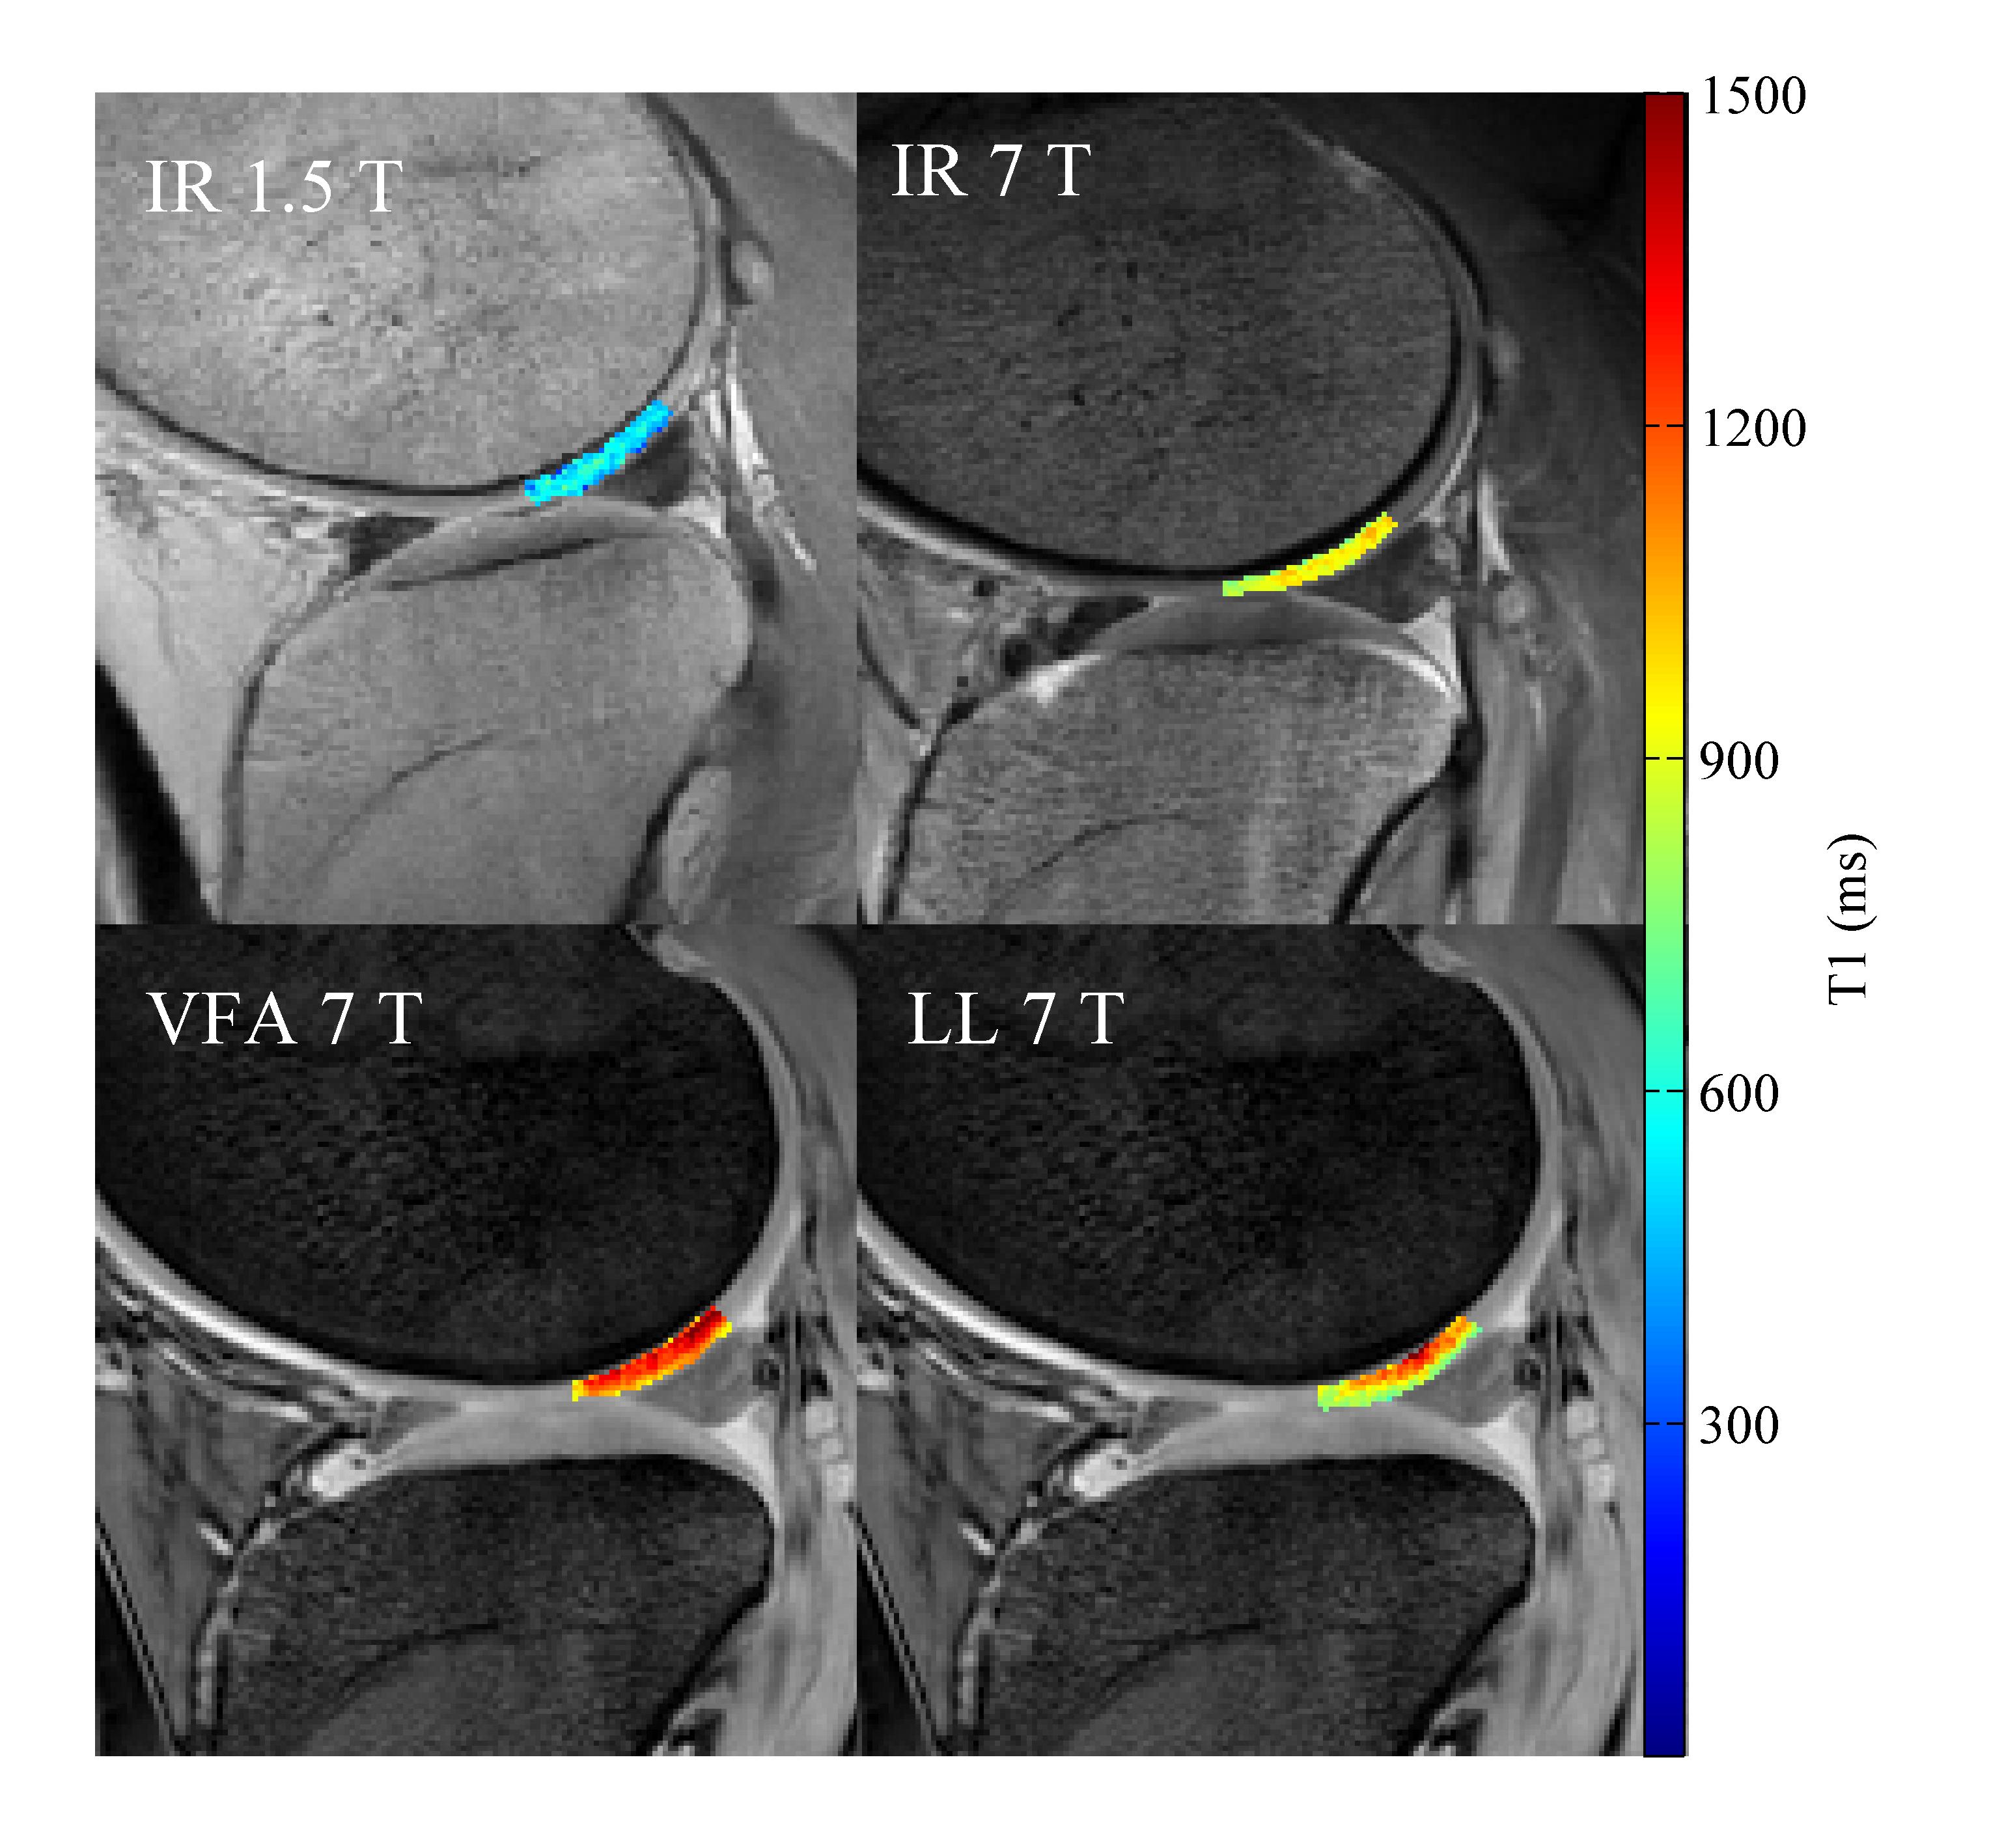
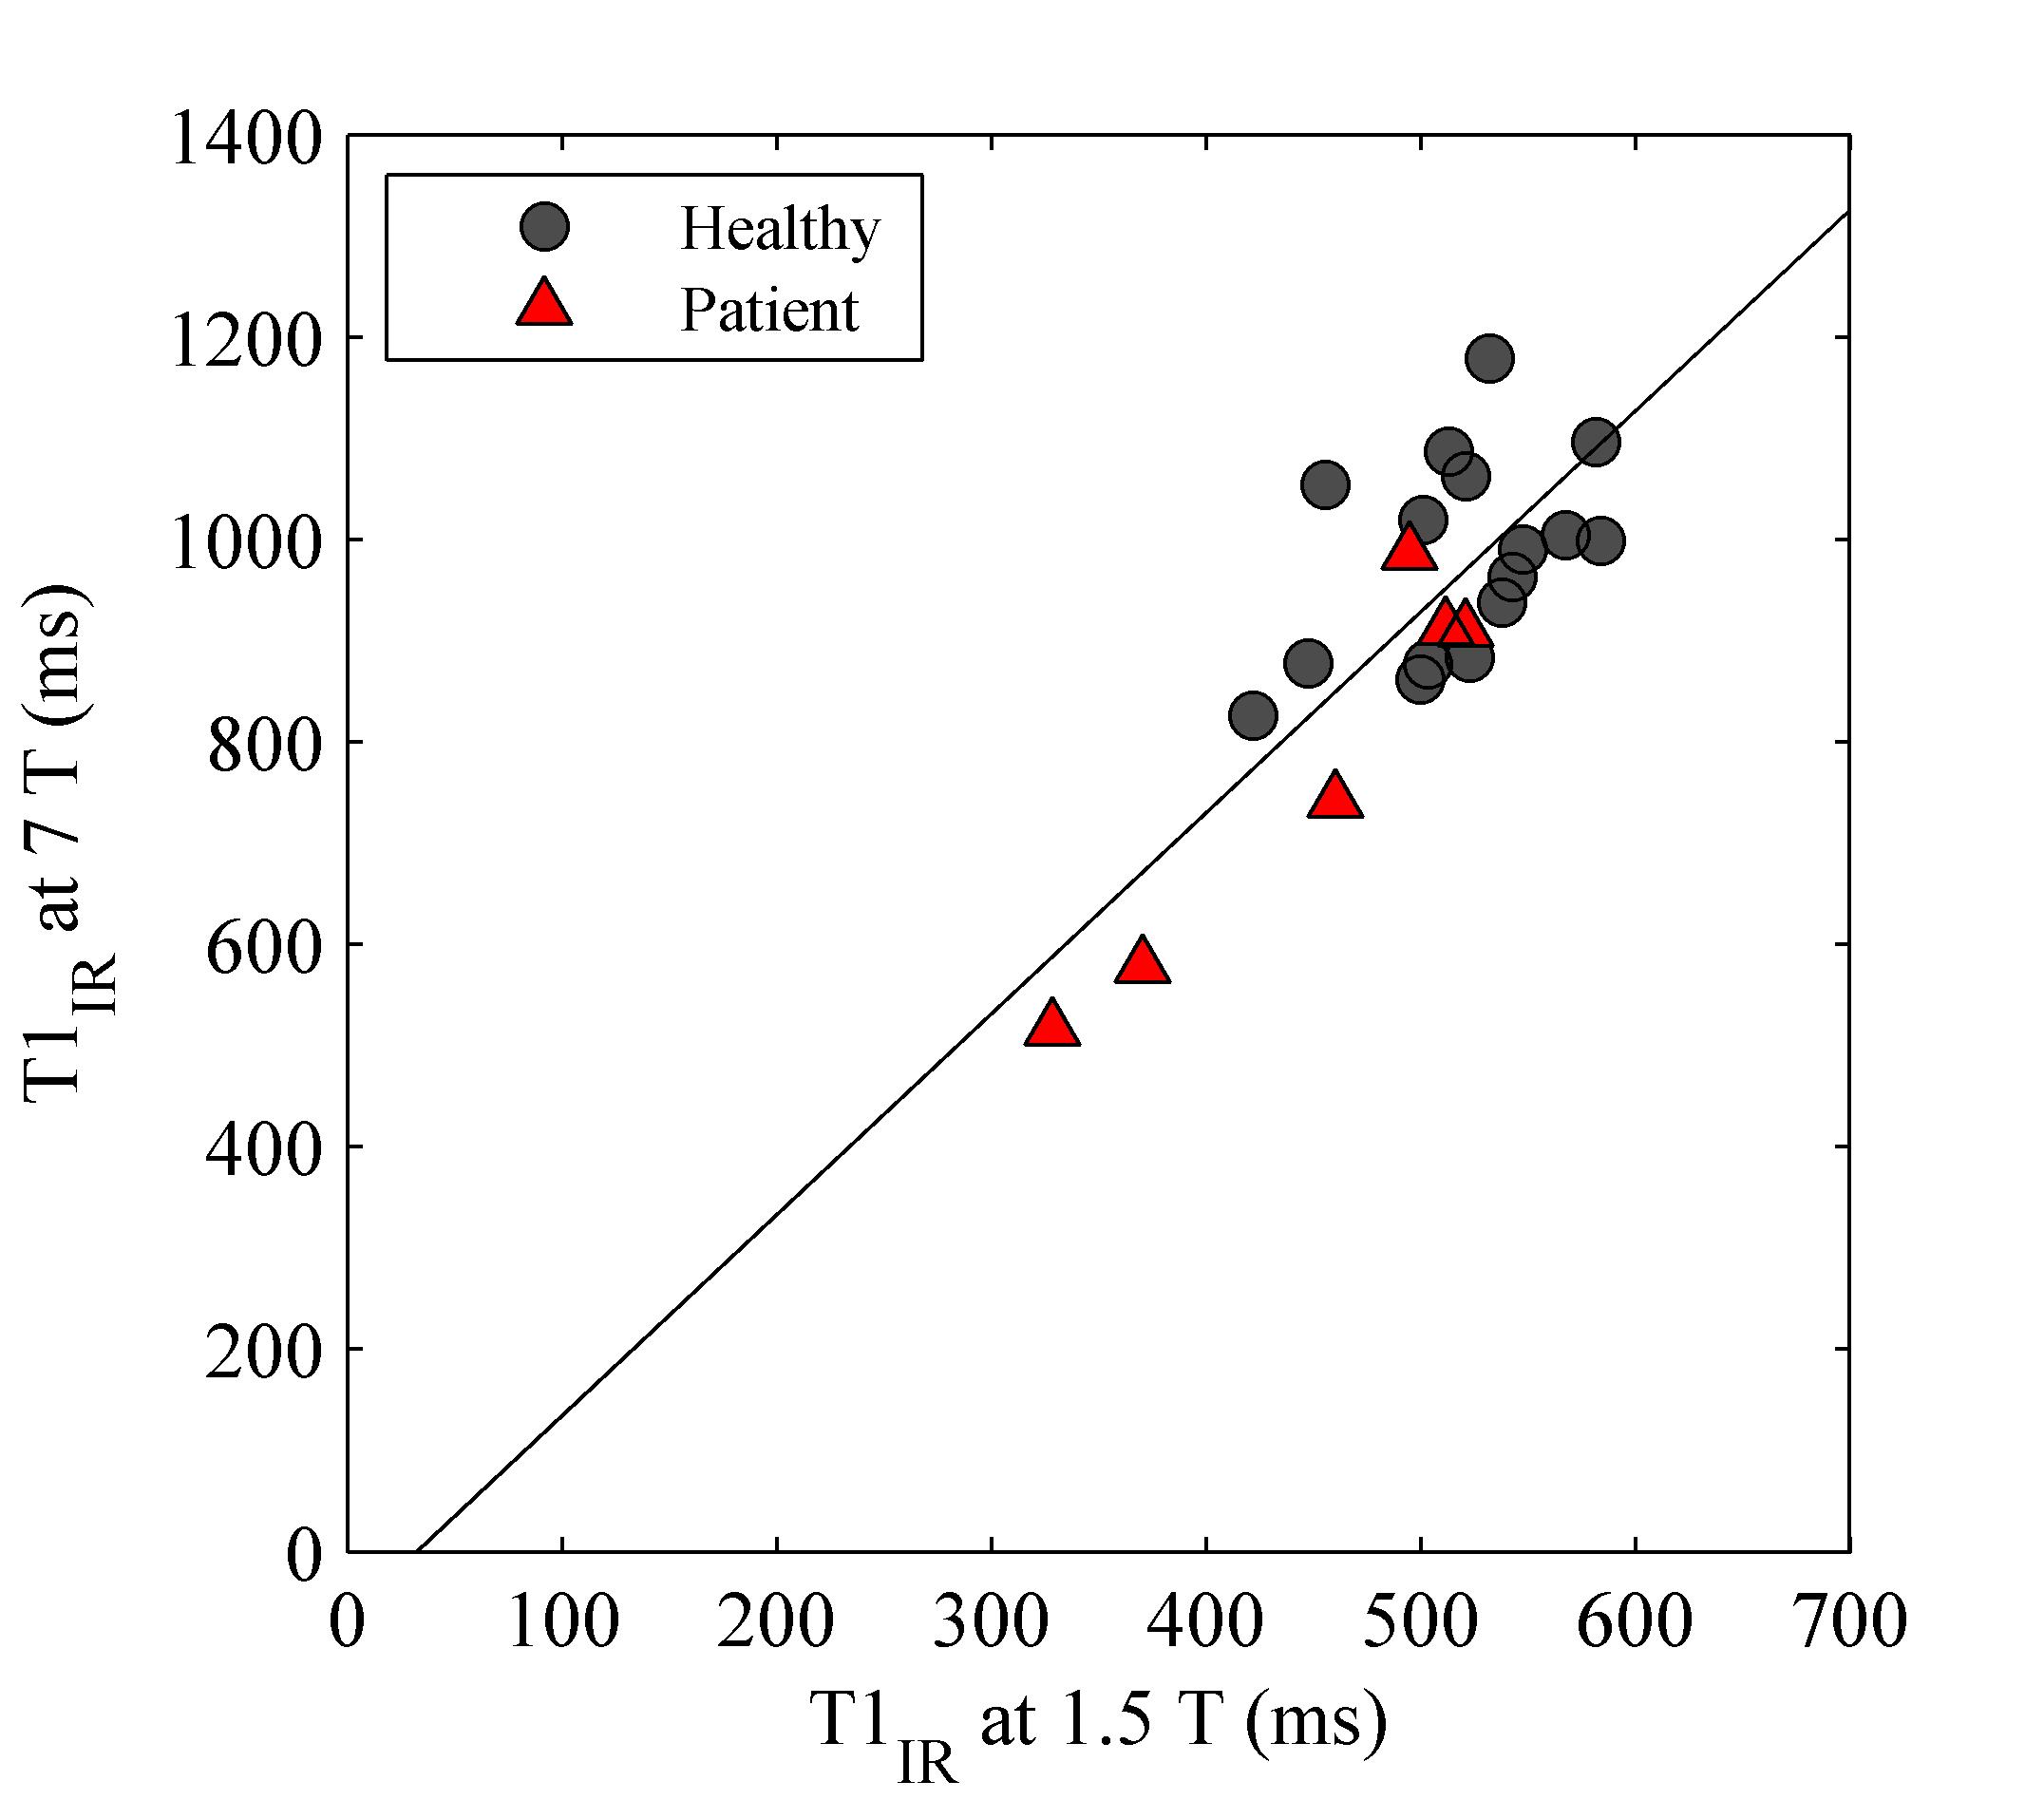
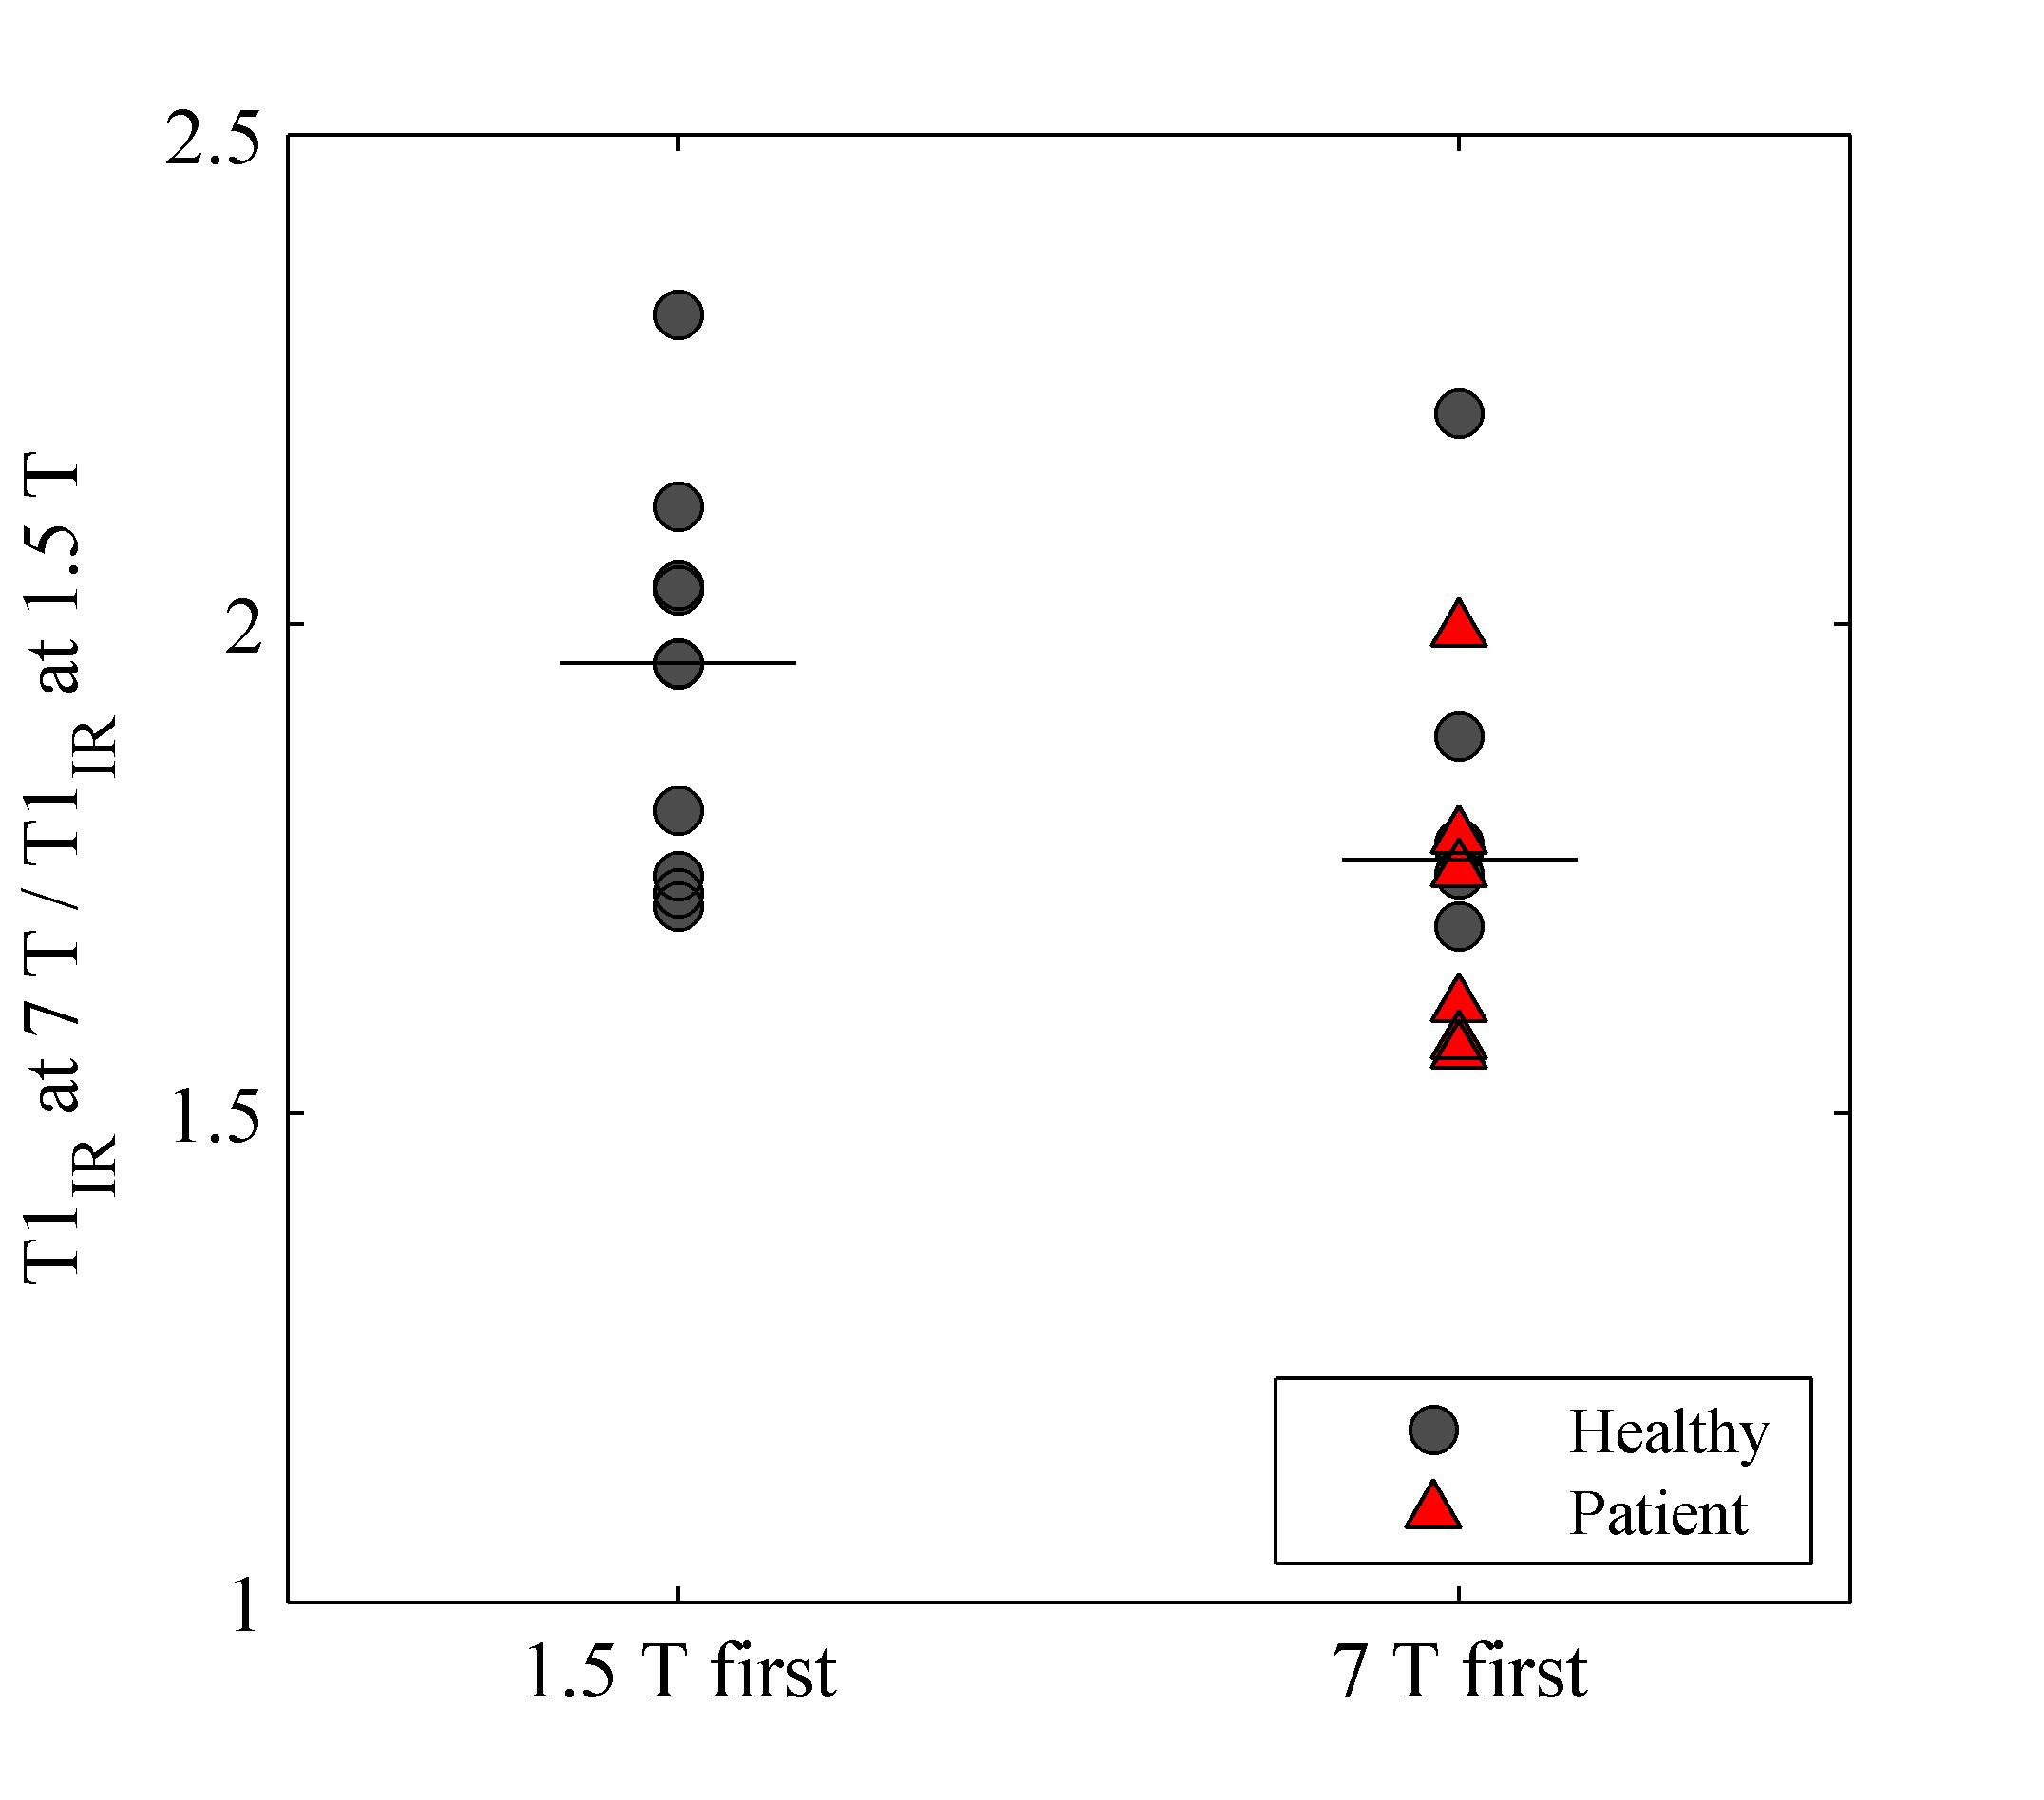
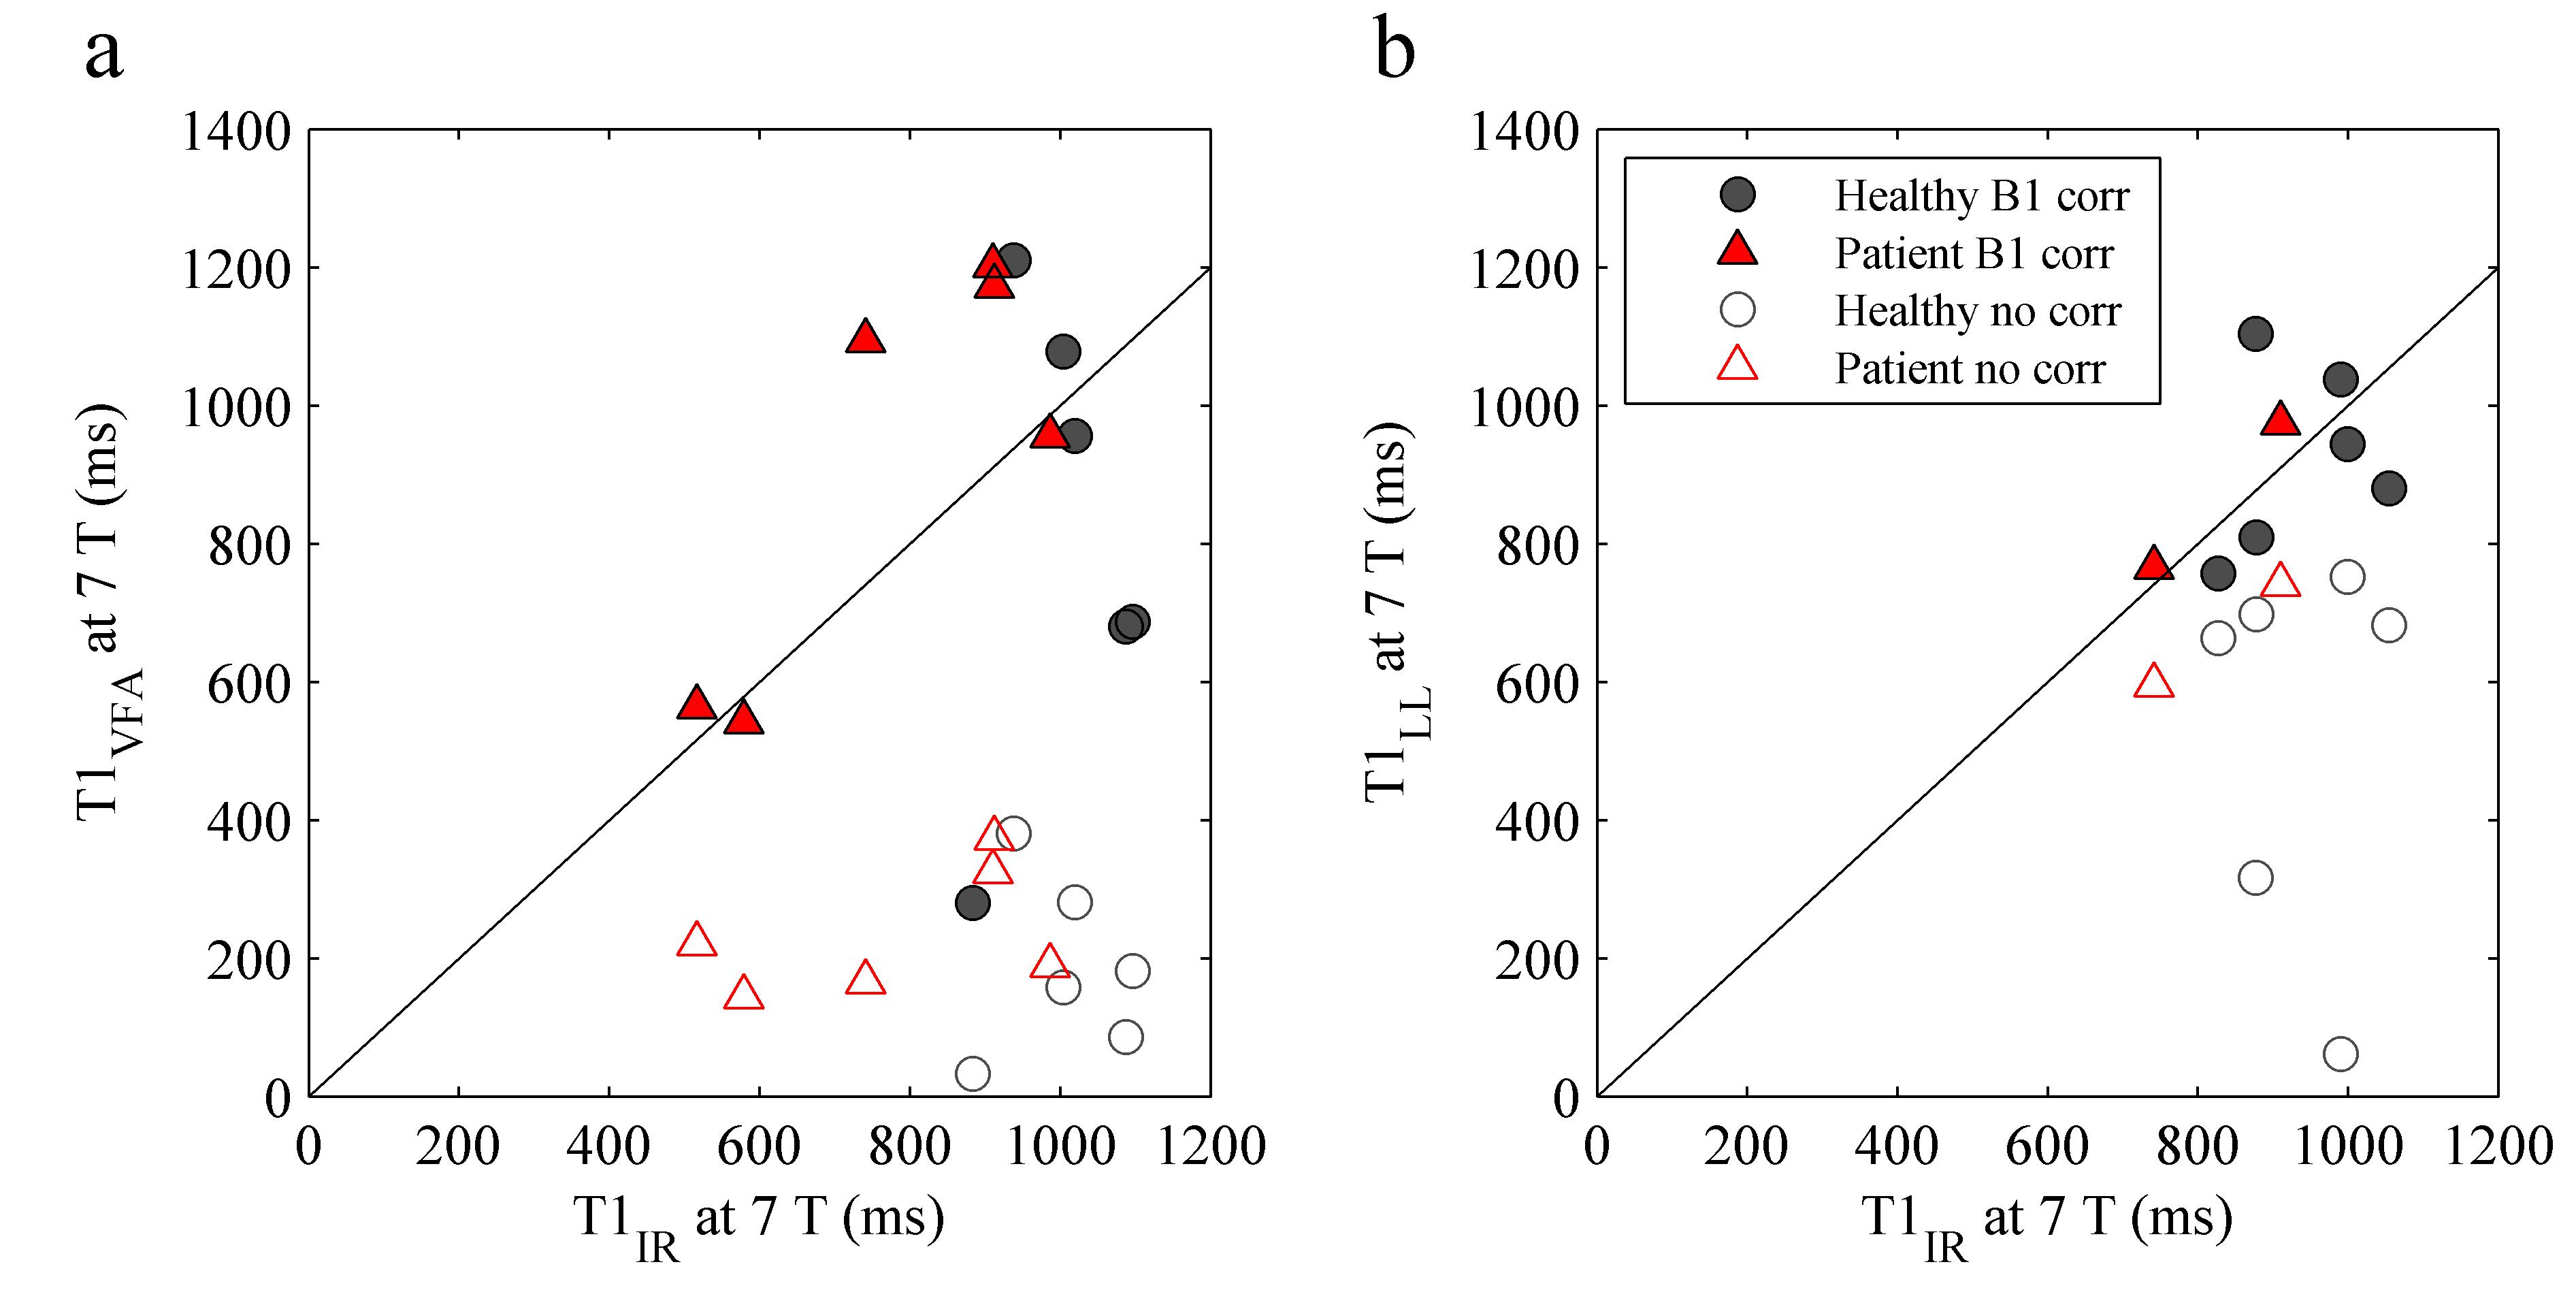
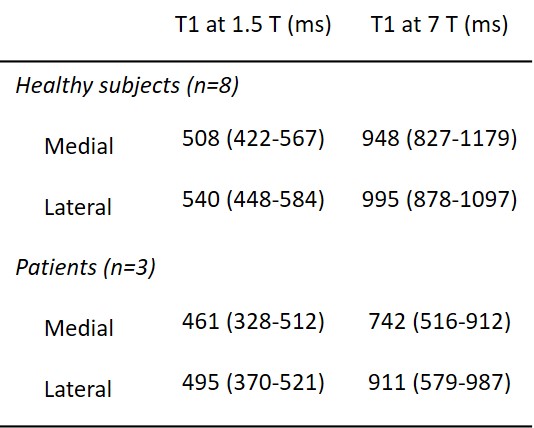
Example T1 maps using the various methods are shown in Figure 1. The median (range)time difference between the examinations at 1.5 T and 7 T was 39 min (28 min-63 min). As expected, longer T1 values (median (range) 1.8 (1.6-2.3) times those at 1.5 T) were estimated in all subjects at 7 T (Table 1) and there was a strong correlation (r=0.92, p<0.001) between the T1 values at the two field strengths (Figure 2). The increase of T1 at 7 T compared to 1.5 T did not significantly differ depending on which field strength was acquired first (P = 0.09, Figure 3). With B1 correction, the LL method agreed fairly well with IR, but very poor agreement was seen for the VFA method, even with B1 correction (Figure 4).Discussion
The estimated postcontrast T1 values at both field strengths were similar to those previously reported, but no precontrast T1 values were measured in this study.7-8 Similar to the results in a previous preliminary report, our results show a poor agreement between the VFA and IR methods at 7 T.9 VFA is challenging at 7 T due to the large B1 inhomogeneities, which do not seem as detrimental to the IR and LL techniques. However, more data is needed, and is currently acquired, to better evaluate the two 3D techniques.Conclusion
We conclude that dGEMRIC is feasible at 7 T and have for the first time validated its use against a clinical field strength. Out of the three T1 mapping methods tested, single slice IR is the preferred approach. If 3D data is desired, LL is a better alternative compared to VFA which is not recommended.Acknowledgements
We would like to thank the staff at the Swedish National 7 T Facility, especially Boel Hansson, Johanna Arborelius, and Karin Markenroth Bloch, for their invaluable help. This research was supported by the Swedish Research Counsil (K2013-52X-22196-01-3).References
1. Bashir A, Gray ML, and Burstein D. Gd-DTPA2- as a measure of cartilage degradation. Magn Reson Med 1996;36(5):665-673
2. Tiderius CJ, Olsson LE, Leander P, et al. Delayed gadolinium-enhanced MRI of cartilage (dGEMRIC) in early knee osteoarthritis. Magn Reson Med 2003;49(3):488-492
3. Trattnig S, Zbýn Š, Schmitt B, et al. Advanced MR methods at ultra-high field (7 Tesla) for clinical musculoskeletal applications. Eur Radiol 2012;22(11):2338-2346
4. Siversson C, Tiderius CJ, Neuman P, et al. Repeatability of T1-quantification in dGEMRIC for three different acquisition techniques: two-dimensional inversion recovery, three-dimensional look locker, and three-dimensional variable flip angle. J Magn Reson Med 2010;31(5):1203-1209
5. Nehrke K and Börnert P. DREAM – a novel approach for robust, ultrafast, multislice B1 mapping. Magn Reson Med 2012;68(5):1517-1526
6. Tiderius CJ, Hori M, Williams A, et al. dGEMRIC as a function of BMI. Osteoarthtritis Cartilage 2006;14(11):1091-1097
7. Tiderius CJ, Olsson LE, de Verdier H, et al. Gd-DTPA2- - enhanced MRI of femoral knee cartilage: a dose-response study in healthy volunteers. Magn Reson Med 2001;46(6):1067-1071
8. Welsch GH, Mamisch TC, Hughes T, et al. In vivo biochemical 7.0 tesla magnetic resonance – preliminary results of dGEMRIC, zonal T2, and T2* mapping of articular cartilage. Invest Radiol 2008;43(9):619-626
9. Trattnig S, Welsch GH, Pinker K, et al. dGEMRIC at 7 tesla – feasibility study. Proc Intl Soc Magn Reson Med 16 2008:3658
Figures