1544
T1ρ acquired at higher Spin Lock Frequency and Composite R2 - R1ρ are better predictors of Patient-Reported Outcome in Osteoarthritis1Radiology and Biomedical Imaging, UCSF, San Francisco, CA, United States
Synopsis
Synopsis: The agreement and associations of T1p values with different spin lock frequencies were evaluated for the detection of radiographic knee OA and association with patient-reported outcomes. Analyses were performed in vivo at 3T MRI. Significant differences were identified between FSL 500 Hz, 3 TSL and T2 in all knee compartments and between FSL 700 Hz, 3 TSL and FSL 500 Hz, 3 TSL. While similar behavior was observed in distinguishing radiographic OA, T1ρ computed at higher FLS (700 Hz) and R2-R1ρ 700Hz demonstrated a better association with patient-reported outcomes.
Purpose:
Osteoarthritis (OA) is a degenerative joint disease leading to considerable pain and disability. Early signs of OA include the loss of proteoglycan and disruption of the collagen network that leads to the degradation of the extracellular matrix1. MR quantitative imagining techniques like T1ρ and T2 mapping have been extensively used to observe changes in the molecular composition of the cartilage2. While the values of T1ρ and T2 for detecting cartilage change have been widely accepted, the sensitivity of these parameters for detecting early OA, specifically regarding the experimental parameter-dependency on relaxation times, needs evaluation3. Metrics using relaxation rate differences (R2-R1ρ) have also been recently proposed4. A recent in-vivo study demonstrated a dependency between the combined metric R2-R1ρ and patient-reported outcome changes after ACL reconstruction5. The purpose of this study is to analyze the agreement and association of T1p values with different spin lock frequencies and the different combination of R2-R1ρ with the aim to test the sensitivity for radiographic OA detection and association with patient-reported outcomes as measured by the Knee Osteoarthritis Outcome Score (KOOS).Methods:
25 subjects were included in this study, (5 KL=2, age=56.8 ±7.2years, BMI=24.3 ±2.4 kg/m2, 3 female) and (20 KL 0-1, age= 49.3±6.7years, BMI = 23.2±2.6kg/m2, 13 female). Using a 3T MRI scanner (GE Healthcare, Milwaukee, WI) with an 8-channel phased array knee coil (Invivo Inc, Orlando, FL), sagittal 3D T1ρ imaging sequences were obtained with the following parameters: TR/TE=9ms/min full, FOV=14 cm, matrix=256x128, slice thickness=4 mm, spin-lock frequency (FSL) =500 Hz (T1ρ 500Hz,), time of spin lock (TSL) = 0/2/4/8/12/20/40/80 ms and spin-lock frequency=700 Hz (T1ρ 700Hz,) time of spin lock (TSL)=20/40 ms. 3D T2 imaging sequences were also obtained with the same parameters with TE=0/1.8/3.6/7.3/14.5/29.1/43.6/58.2 ms. Atlas-based automatic cartilage segmentation was used to define cartilage compartments (LFC: Lateral Femoral Condyle, MFC: Medial Femoral Condyle, TRO: Trochlea, MT: Medial Tibia, LT: Lateral Tibia, PAT: Patella)6. T1ρ 500Hz and T2 maps were obtained with 2 parameter exponential fitting down sampling the number of TSL and TE to three (0, 20, 40 ms and 29.1/43.6) to match the T1ρ 700Hz acquisition; T1ρ 700Hz was quantified with the same fitting procedure and three spin lock times (0, 20, 40 ms). Averages of T1ρ 500Hz, T1ρ 700Hz, T2 and the composite R2-R1ρ metric were computed as averages in each compartment. At the time of the MRI scan, all subjects completed the Knee Osteoarthritis Outcome Score (KOOS) survey7. Paired t-tests were performed to compare T1ρ 500Hz, T1ρ 700Hz and T2. Pearson correlation coefficients were used to study the association between T1ρ 500Hz, T1ρ 700Hz and T2. Unpaired t-tests were used to study the ability of T1ρ 500Hz, T1ρ 700Hz , R2-R1ρ 500Hz, R2-R1ρ 700Hz in detecting radiographic OA. Stepwise linear regression was utilized in order to study the association between the relaxation parameters and KOOS.Results:
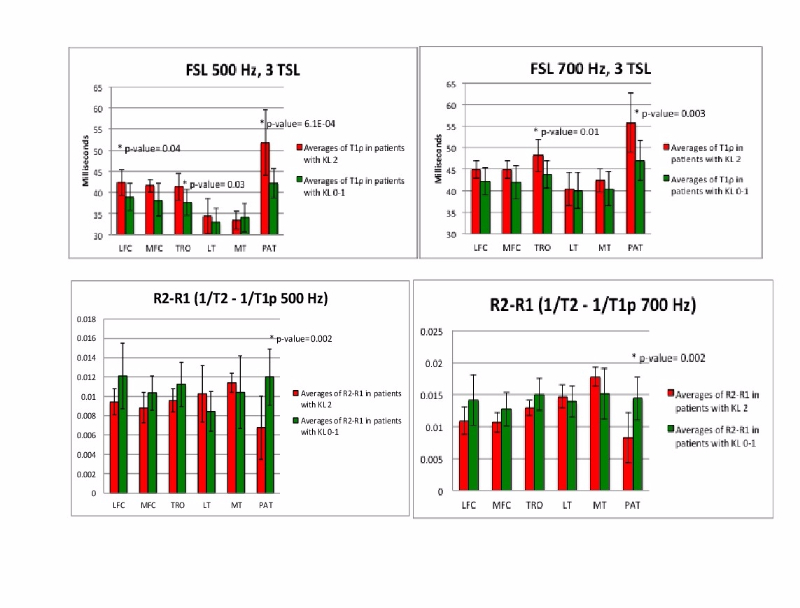
Significant differences were observed between the 3 relaxation parameters T2, T1p500Hz, and T1p700Hz (Figure1); notably, the values were strongly correlated (R=0.69-0.79). T1p500Hz showed significant differences between OA and controls in LFC (p-value=0.04), TRO (p-value=0.03) and PAT (p-value=6.1E-04) at T1p700Hz showed differences in TRO (p-value=0.01) and PAT (p-value=0.003) (Figure2 A-B). When observing the composite R2-R1ρ metric, significant differences were observed in the PAT at both FSL (p-value=0.002) (Figure2 C-D). Considering the association with KOOS, T1ρ 700Hz was observed to be a significant predictor (Table1). R2-R1ρ 700Hz in the medial tibia compartment was also observed as significant predictor of KOOS Quality Of Life (QOL) and Pain. Although, T1p500Hz and T2 did show weaker associations, and they did not reach significance in any of KOOS sub categories.Discussion and Conclusion:
In this study, we analyzed the effect of different FSL on the sensitivity of T1p for OA. While similar behavior was observed in distinguishing radiographic OA, T1ρ computed at higher FSL (700 Hz) and R2-R1ρ 700Hz showed a better association with patient-reported outcomes. This study reports new insights on the effects of higher spin lock frequencies, and bolsters the growing body of work on a combined metric. The possible use of R2-R1ρ as an imaging biomarker for OA is especially interesting, considering that relaxation rate can be directly computed from a T1ρ-weighted and a T2-weighted images acquired with TE=TSL5. This would result in a fast acquisition suitable for clinical translation.Acknowledgements
Acknowledgement: NIH Grant # R01AR04690References
1. Flemming DJ, Hash TW 2nd, Bernard SA et al. MR imaging assessment of arthritis of the knee. Magn Reson Imaging Clin N Am. 2014;22:703-724.
2. Li X, Pai A, Blumenkrantz G, et al. Spatial distribution and relationship of T1rho and T2 relaxation times in knee cartilage with osteoarthritis. Magn Reson Med 2009;61:1310-1318.
3. Borthakur A, Mellon E, Niyogi S, et al. Sodium and T1rho MRI for molecular and diagnostic imaging of articular cartilage. NMR in Biomedicine 2006;19(7):781-821.
4. Wang P, Block J, Gore JC. Chemical exchange in knee cartilage assesed by R1rho (1/T1rho) dispersion at 3 T. Journal of Magnetic Resonance Imaging 2015;33(1):38-42.
5. Russell C, Pedoia V, Majumdar S. Composite metric R2 - R1ρ (1/T2 - 1/T1ρ) as a potential MR imaging biomarker associated with changes in pain after ACL reconstruction: A six-month follow-up. J Orthop Res. 2016 Aug 26. doi: 10.1002/jor.23400. [Epub ahead of print]
6. Pedoia V, Li X, Su F, et al. Fully automatic analysis of the knee articular cartilage T1ρ relaxation time using voxel-based relaxometry. J Magn Reson Imaging 2016;43,970-980.
7. Roos EM, Lohmander LS. The knee injury and osteoarthritis outcome score (KOOS): from joint injury to osteoarthritis. Health Qual Life Outcomes. 2003;1:64.
Figures