1541
Correlation time mapping of articular cartilage degeneration in equine model1Medical Research Center, University of Oulu and Oulu University Hospital, Oulu, Finland, 2Research Unit of Medical Imaging, Physics and Technology, University of Oulu, Oulu, Finland, 3Department of Applied Physics, University of Eestern Finland, Kuopio, Finland, 4Diagnostic Imaging Center, Kuopio University Hospital, Kuopio, Finland, 5Department of Equine Sciences, Utrecht University, Netherlands, 6Department of Orthopaedics, University Medical Center Utrecht, Netherlands, 7Department of Diagnostic Radiology, Oulu University Hospital, Oulu, Finland
Synopsis
Correlation time mapping was utilized to study structural alterations in articular cartilage of the femoral trochlea harvested from skeletally mature equines. Samples originated from a study in which surgically created lesions in the lateral trochlear ridge of the femur were filled with different materials and were left to heal for 12 months. Correlation time maps of the cartilage or repaired tissues were obtained from fitting T1ρ relaxation dispersion data. The correlation times of the repair tissue from the lesion site and tissue next to the lesion site were significantly shorter than the correlation times in a location distant from the lesion, indicating gradual degenerative changes observed in early osteoarthritis.
Purpose
Reorientational correlation time is a fundamental biophysical property describing water dynamics. In this study, the correlation time mapping, fitted from T1ρ relaxation dispersion data 1,2, was used to assess structural changes of articular cartilage in equine specimens.Methods
Two lesions about 5 mm apart were been created by removing circular regions (d=10 mm) of cartilage in both knees of Shetland ponies (aged 4-14 years, n=7) (Fig. 1a). Lesions were filled with different hydrogel-cell combinations and lesions were left to heal for one year before animals were sacrificed. Triangular wedge-shaped specimens (25x20x15 mm, n=13) were obtained from the medial femur in the stifle joints of the ponies. The specimens were cut in a way that approximately half of both lesions as well as the cartilage between the lesions were included. As a consequence of the lesions, the surrounding tissues had been softened over time, which was macroscopically palpable. The study had been approved by the local ethical committee of Utrecht University in compliance with the Dutch Act on Animal Experimentation.
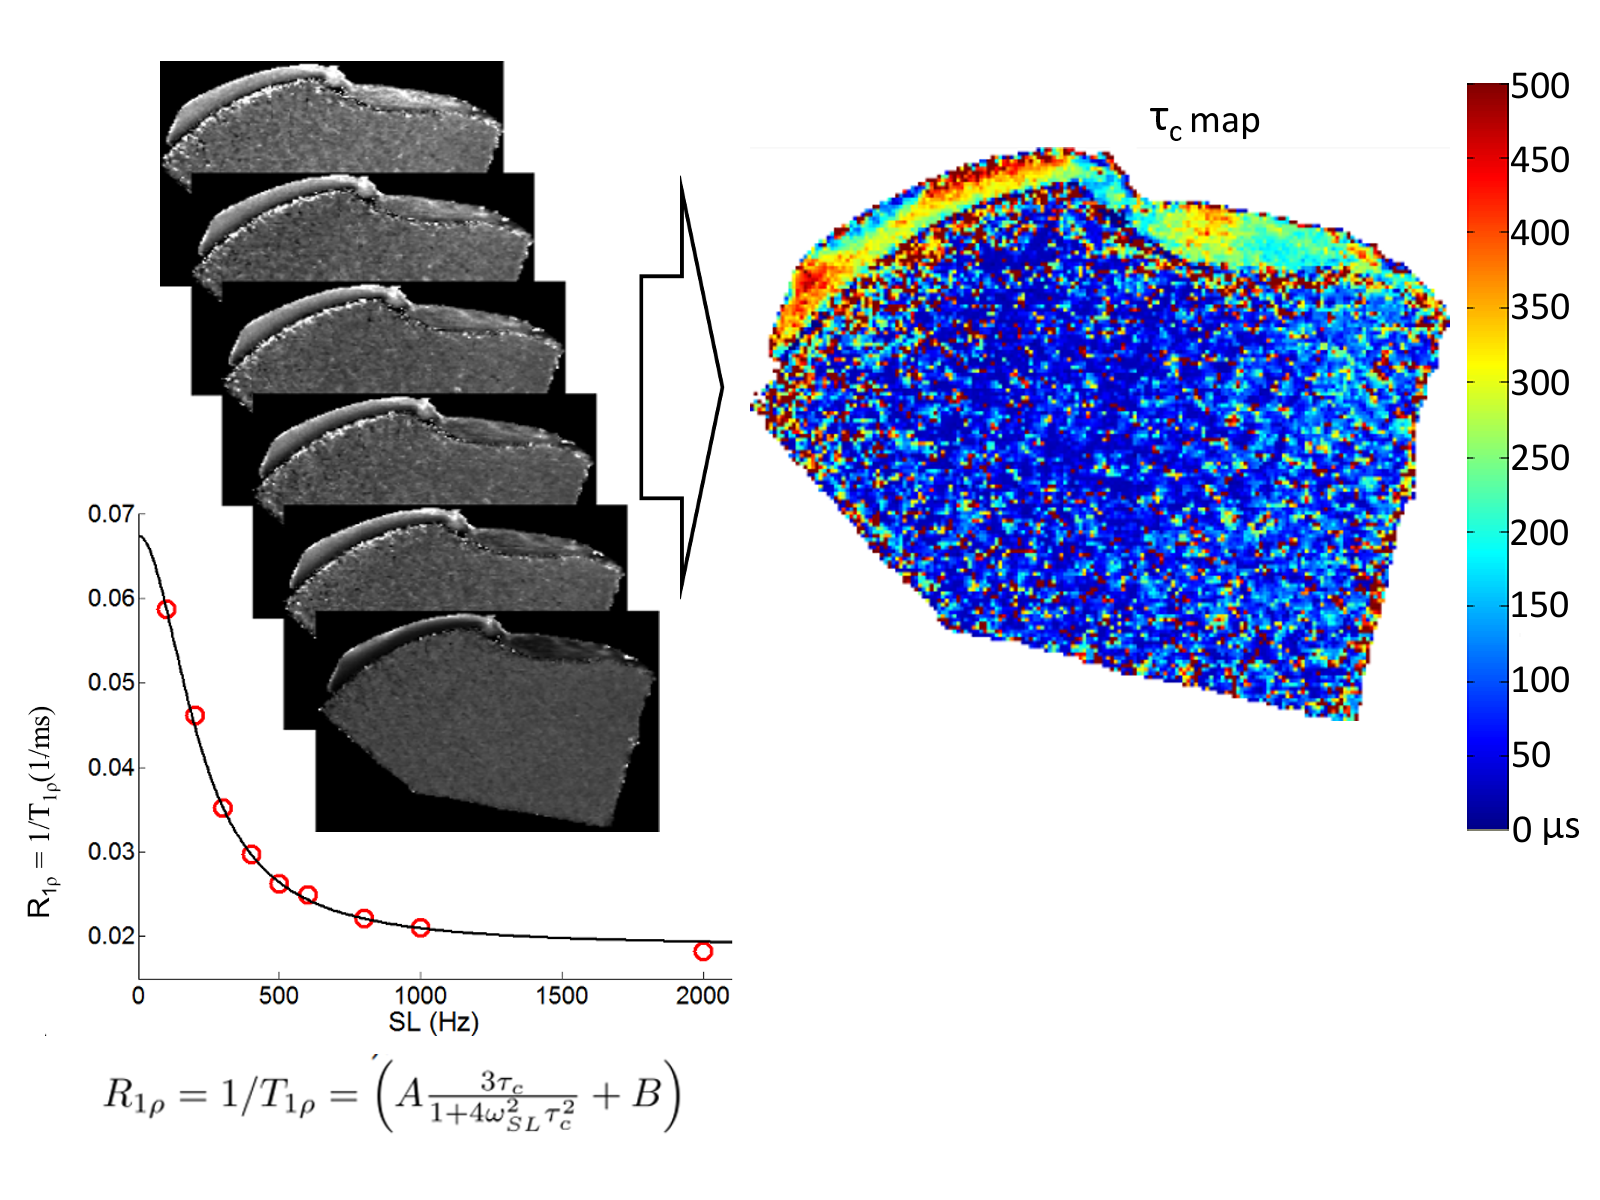
MRI was performed at 9.4 T (Oxford instruments Plc, Witney, UK) with a 19 mm quadrature RF volume transceiver (RAPID Biomedical GmbH, Rimpar, Germany) and Varian DirectDrive console (Varian Inc. Palo Alto, CA, USA). Prior to MRI, the specimens were thawed in a water bath at room temperature, resized (to fit the coil), and immersed in perfluoropolyether oil (1H-free) inside ultra-thin latex test tubes. The transverse plane of the sample was at or near the trans-axial plane of the B0 field to enable axial slice selection, reducing the magic angle effect. A B1 and B0 compensated continuous-wave (CW) T1ρ magnetization preparation block 3, was used for dispersion measurements, with spin-lock (SL) powers γB1=100, 200, 300, 400, 500, 600, 800, 1000 and 2000 Hz. The preparation was followed by a fast spin-echo readout (TR=5 s, ETL=8, TEeff=4.2 ms, 192x192 matrix size, slice thickness 1 mm, FOV=19.2x19.2 mm2). T1ρ maps with the corresponding SL powers were acquired and used as input parameters for correlation time (τc) map fitting (Fig. 2).
For region of interest (ROI) analyses, one full-thickness (bulk) ROI was selected in the repaired lesion region (“repaired”), one ROI was chosen right next to the repaired lesion in a visually normal area (“secondary”), and another ROI in an area distant to the repaired tissue (“control”) (Fig. 1b). Since actual cartilage tissue has been replaced by repair tissue in the lesion area and the structure was not clearly identified, only one bulk (100%) ROI was selected to calculate mean τc in the repaired lesion region. For the control and the secondary regions, the mean τc values were calculated for superficial zone (Sup) (5 %), transitional zone (Trans) (20%), deep zone (Deep) (75%), and full-thickness (Bulk) (100%). The fitting of the correlation times was carried out using MATLAB script (Mathworks, Natick, MA), and the statistical analyses were conducted with SPSS software (Version 23.0, IBM SPSS Statistics, New York, USA).
Results
The mean correlation times of the superficial, transitional and deep zones distant to the repaired lesion region were significantly longer as compared to the corresponding zones right next to the lesion (p = 0.006, p = 0.003, p < 0.001; respectively) (Fig. 3). Comparing the three bulk ROIs, the mean τc of the distant region was significantly longer as compared to both repaired lesion (p < 0.001) and the area immediately next to it (p = 0.003) (Fig. 3). There was no significant difference in τc between the repaired lesion site and the region right next to it.Discussion
Based on the current results, τc is significantly longer in the regions distant to the repaired lesion tissues, as compared to both the repaired lesion tissue itself and a region right next to the lesion. This implies that the repaired lesion tissue has significantly affected the tissues adjacent to it, confirming the macroscopical appearance.
Since τc represents water dynamics, short τc observed in the repaired lesion tissue and tissue next to the lesion indicates relatively unrestricted molecular tumbling, while prolonged τc observed in regions distant to lesion represents slow and restricted molecular motion. Thus, τc is sensitive to structural alterations of articular cartilage, as represented by elevations in τc and illustrated visually by τc (Fig. 2) in the same sample.
Conclusion
According to the present results, τc can be used as a contrast for quantitative assessment of early structural changes of articular cartilage observed in OA.Acknowledgements
Support from Jane and Aatos Erkko Foundation, the Academy of Finland (grants #285909, #293970, and #297033), Dutch Arthritis Foundation (grants LLP-12 and LLP-22), and Netherlands Institute for Regenerative Medicine (NIRM) is gratefully acknowledged.
References
1. Hanni M, Nissi MJ, Rautiainen J, Saarakkala S, Ellermann J, and Nieminen MT (2015). Proc. Intl. Soc. Mag. Reson. Med. 23:0117.
2. Elsayed H, Hanni M, Rautiainen J, Nissi MJ, and Nieminen MT (2016). Proc. Intl. Soc. Mag. Reson. Med. 24:3003.
3. Witschey WR 2nd, Borthakur A, Elliott MA et al. (2007), J Magn Reson 186:75-85.
Figures