1540
Comparative T2 and T1ρ Mapping of Patellofemoral Cartilage under in situ Mechanical Loading with Prospective Motion Correction1Department of Radiology, Medical Physics, Medical Center - University of Freiburg, Freiburg, Germany, 2John A. Burns School of Medicine, University of Hawaii, Honolulu, HI, United States, 3Department of Orthopedic and Trauma Surgery, Medical Center - University of Freiburg, Freiburg, Germany
Synopsis
Robust comparative T2 and T1ρ mapping of patellofemoral cartilage under in situ loading is demonstrated with prospective motion correction and T2 and T1ρ changes in response to loading are evaluated quantitatively, focusing on the load-bearing lateral patellar facet. T2 and T1ρ mapping were performed with equal spatial resolution and field of view for different loading conditions (0/20/40 kg). While no significant T2 differences for the three loading conditions were observed, T1ρ in superficial patellar cartilage was significantly reduced under loading. The quantitative findings suggest that T1ρ is a more reliable and sensitive marker for load-induced changes than T2.
Introduction
To date, cartilage T2 and T1ρ changes in response to mechanical loading have only been investigated for the tibiofemoral but not for the patellofemoral joint compartment 1-3, mainly because of strong susceptibility to motion. In this work, robust comparative T2 and T1ρ mapping under in situ loading is demonstrated with prospective motion correction and T2 and T1ρ changes in response to loading are evaluated quantitatively in a pilot study.Methods
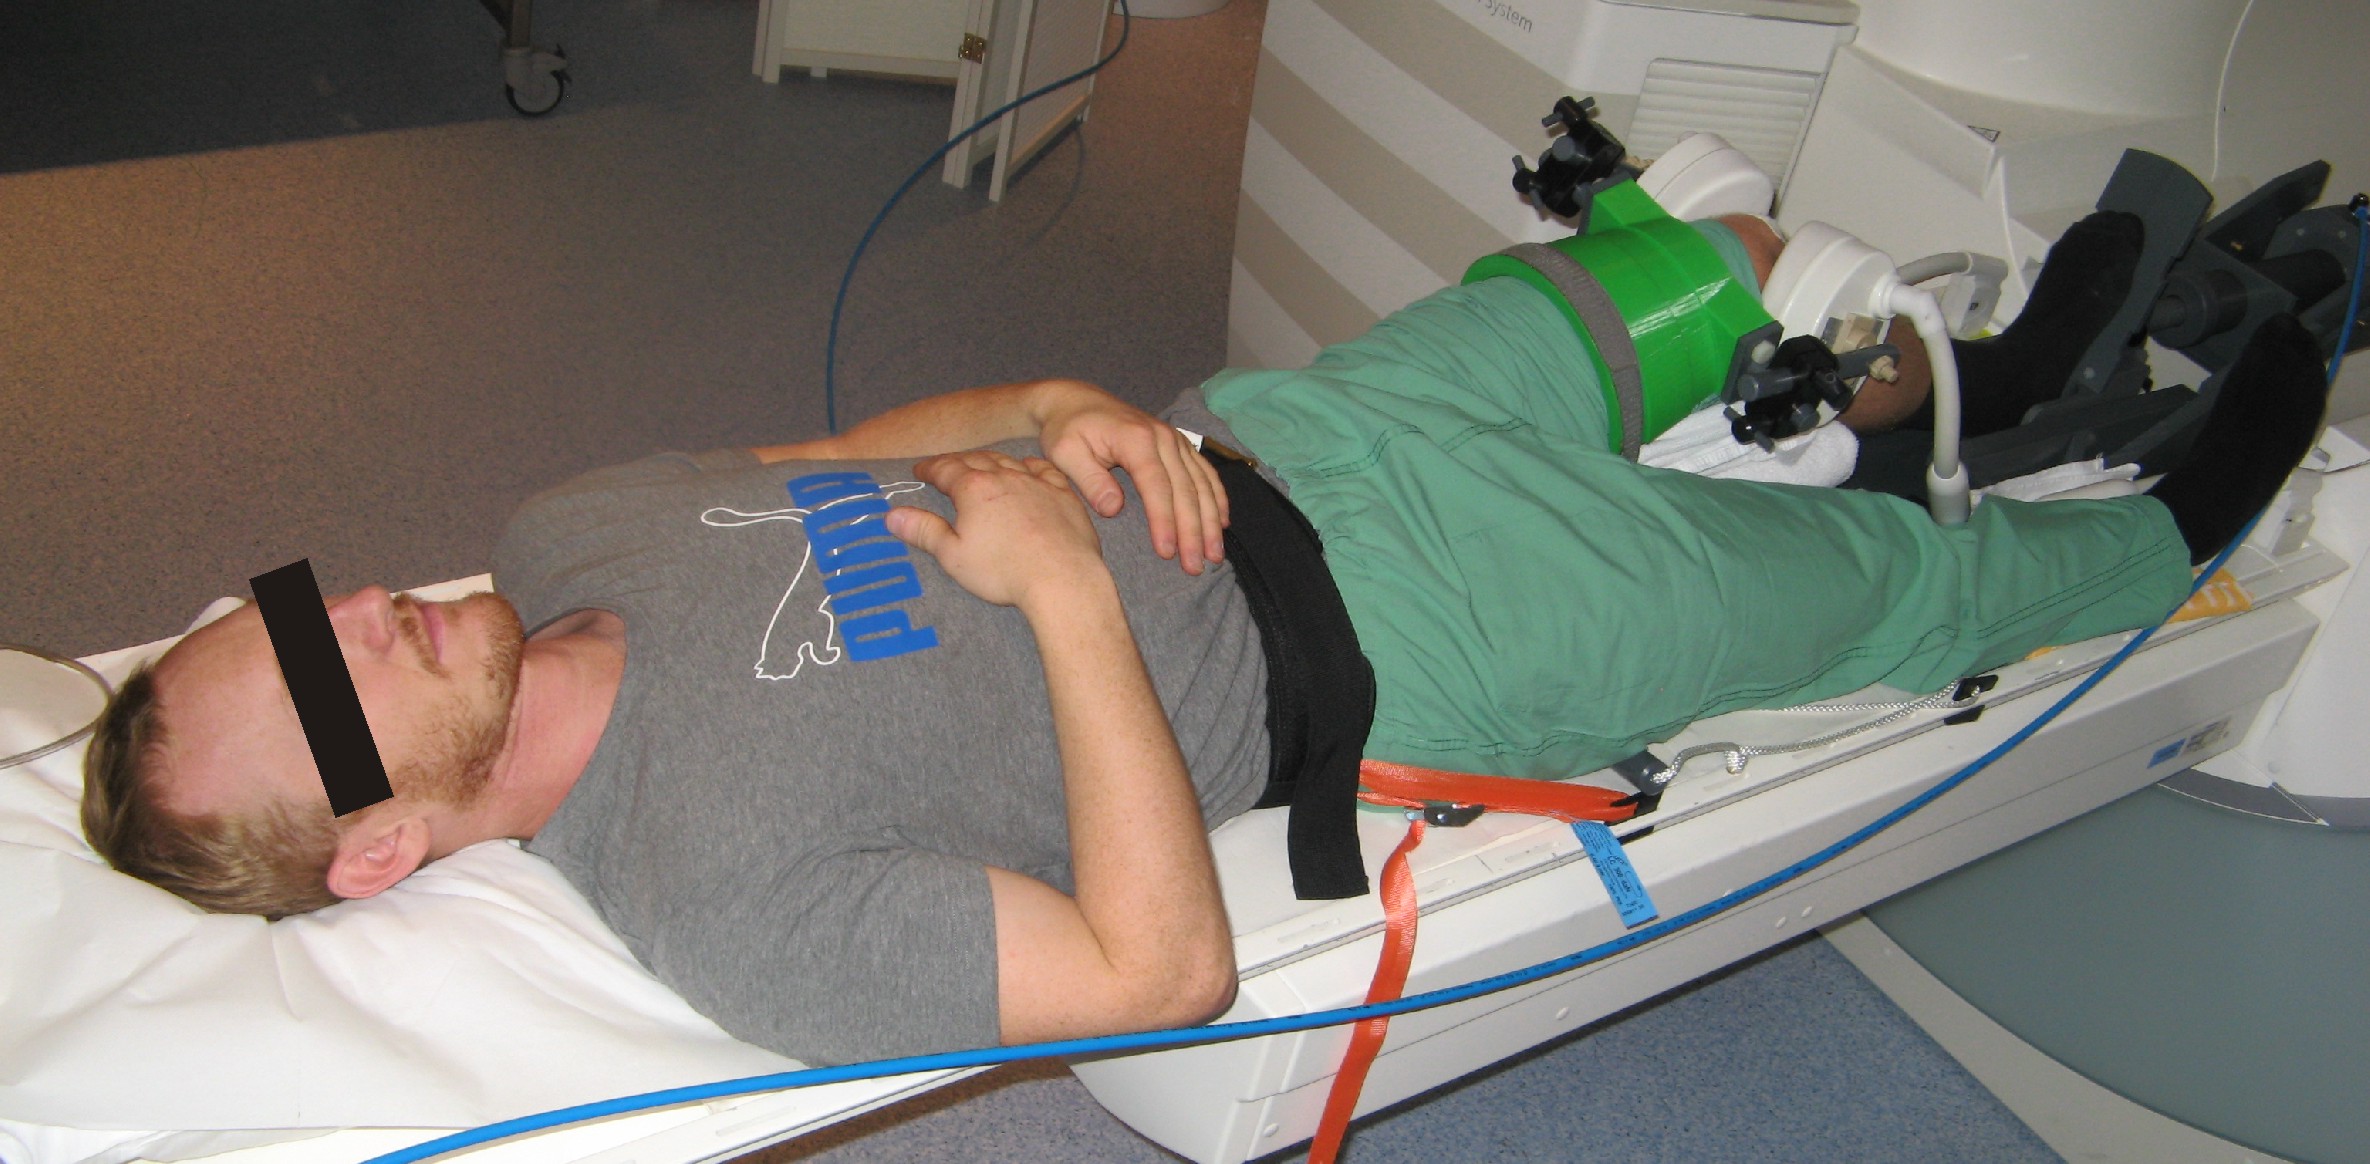
All experiments were performed on a Magnetom Trio 3T system (Siemens Healthineers, Germany), using an 8-channel multipurpose coil (NORAS MRI products, Germany) for signal reception. Knee loading was realized with a MR-compatible pneumatic loading device and prospective motion correction was performed with a moiré phase tracking (MPT) system (Metria Innovation Inc., Milwaukee, US) 4,5. For MRI of the patellofemoral joint under loading, the subject was positioned on the scanner bed with a knee flexion angle of 40°-50° (Fig. 1). Transverse T2 and T1ρ maps were acquired with fat suppression and with equal spatial resolution (0.6 × 0.6 × 3.6 mm3) and field of view. Both sequences were augmented with regular position updates and inter-scan position locking. T2 mapping was conducted with a 2D multiple spin-echo sequence (TE = 13.8/27.6/41.4/55.2/69.0/82.8 ms) while T1ρ mapping was performed with a 3D fast low-angle shot (FLASH) sequence with a variable spin-lock preparation time (τ = 0/10/20/30/40 ms) 6. T2 maps were calculated from the acquired data using the Matlab-based StimFit algorithm 7 while T1ρ maps were determined with a simple single-exponential decay model. Manual cartilage segmentation and quantitative evaluation was performed with the MIPAV software. A slice in the center of the cartilage contact area was selected and mean T2 and T1ρ values were determined within a region of interest (ROI) covering the predominantly load-bearing lateral patellar facet. Furthermore, the ROI was divided into two equally thick layers: a superficial and a deep cartilage zone. A pilot study with combined T2 and T1ρ measurements under different loading conditions (0/20/40 kg) was performed in ten healthy subjects (male, age: (27 ± 2) years)Results and Discussion
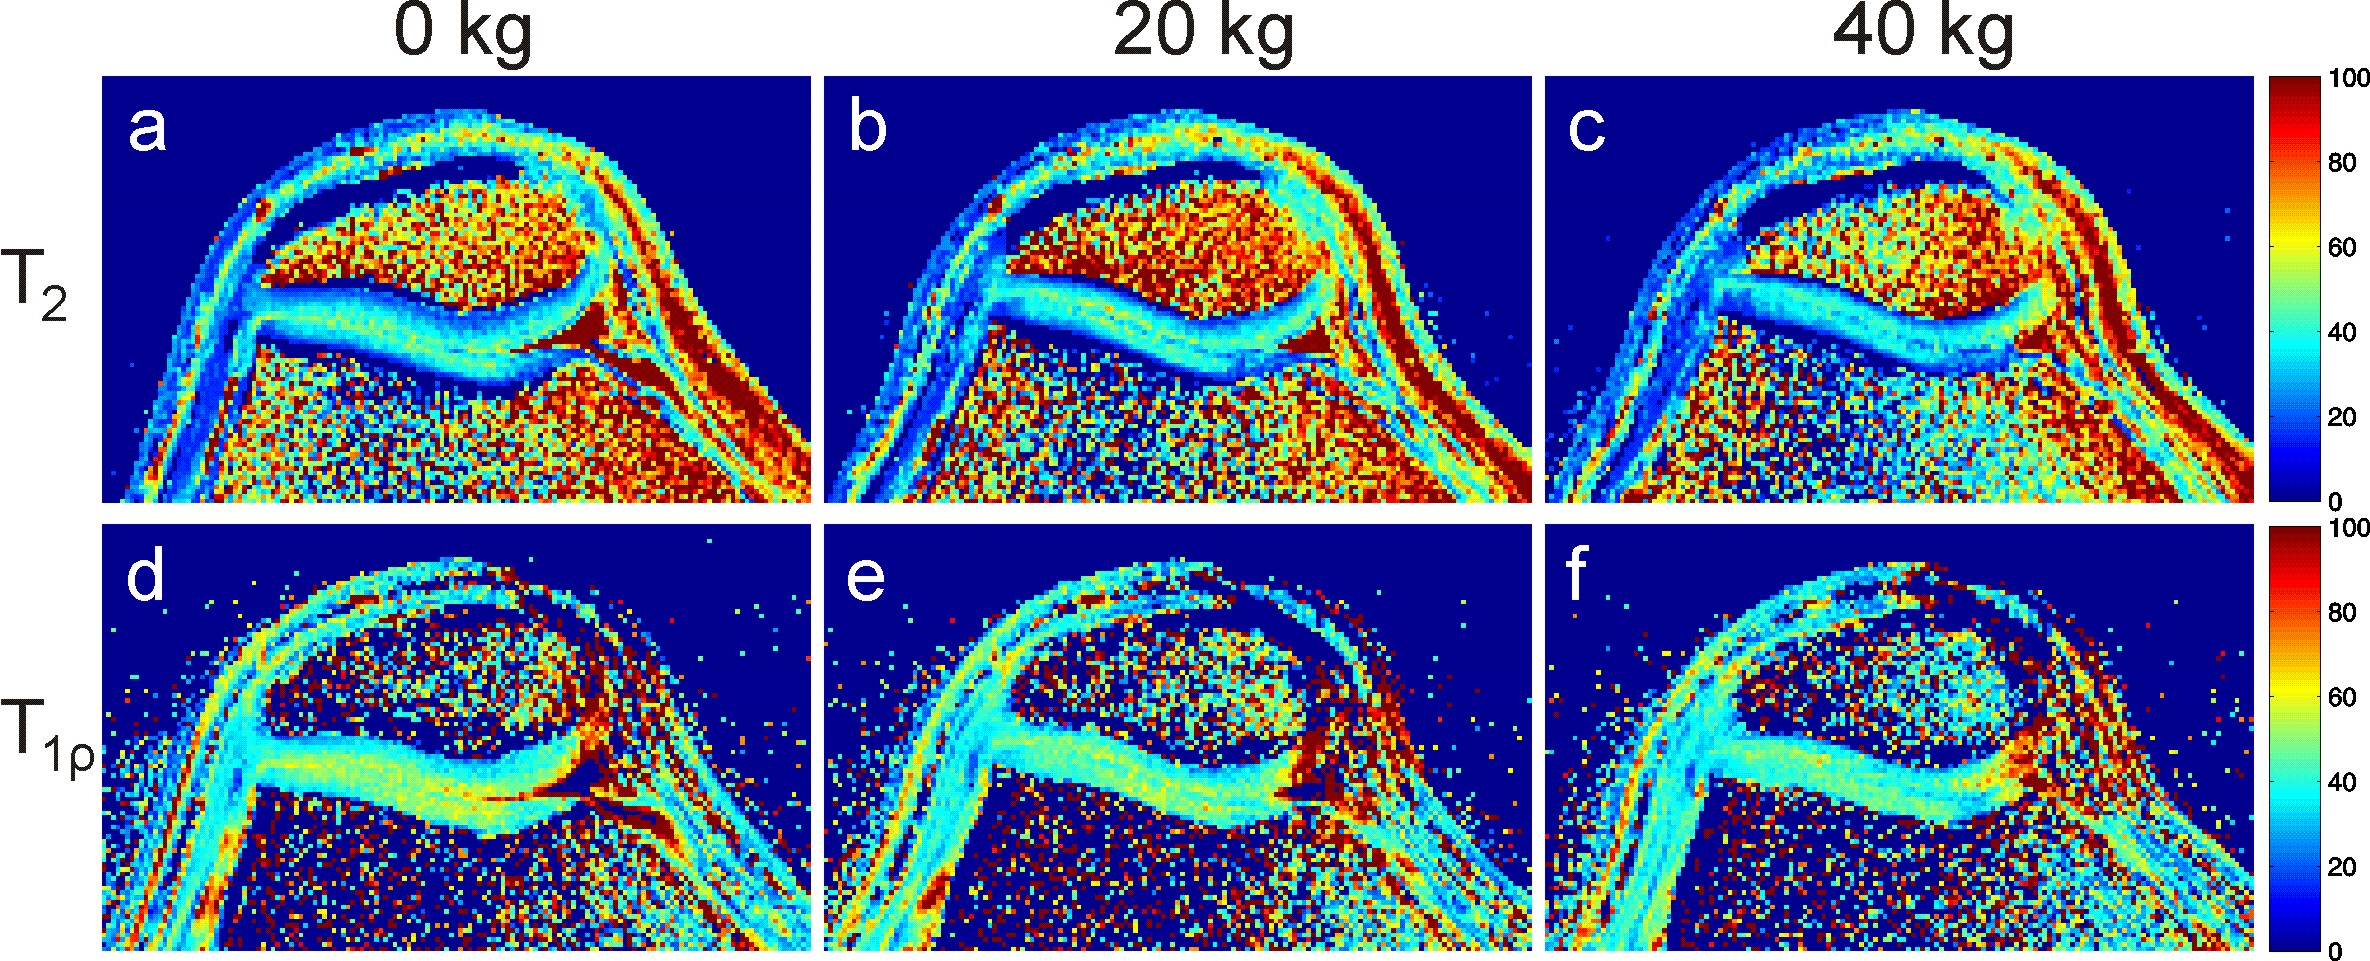
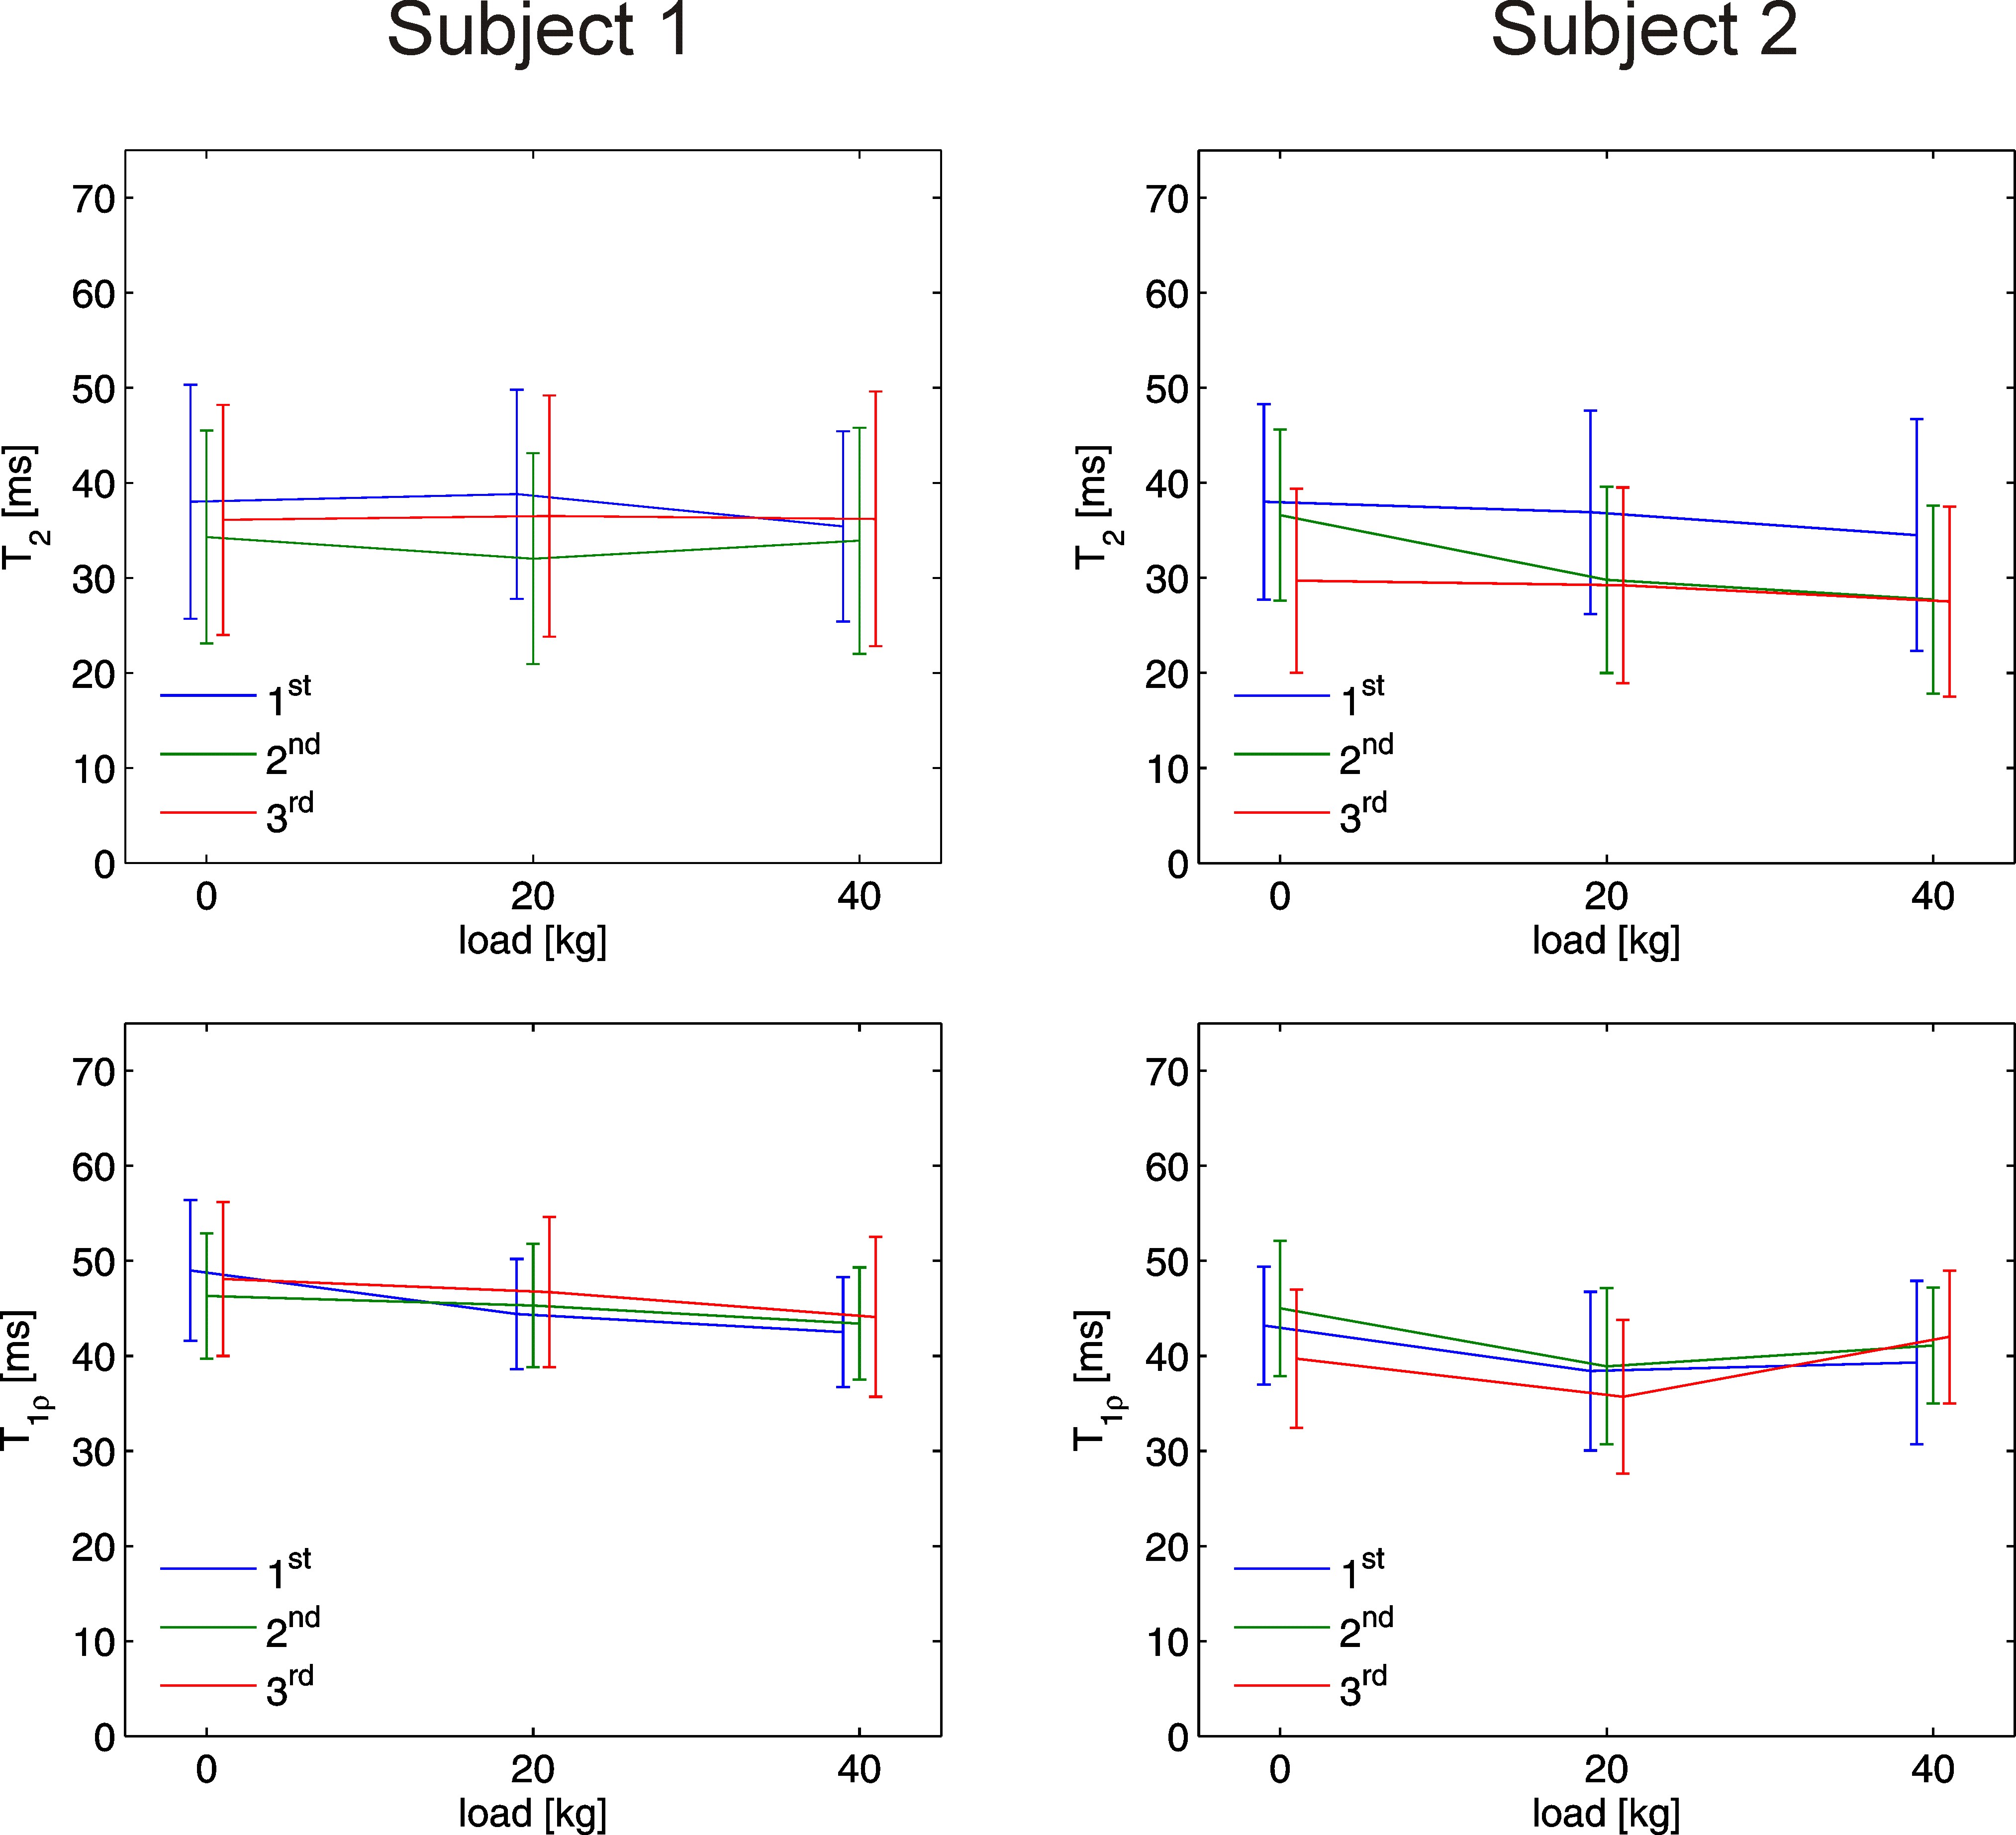
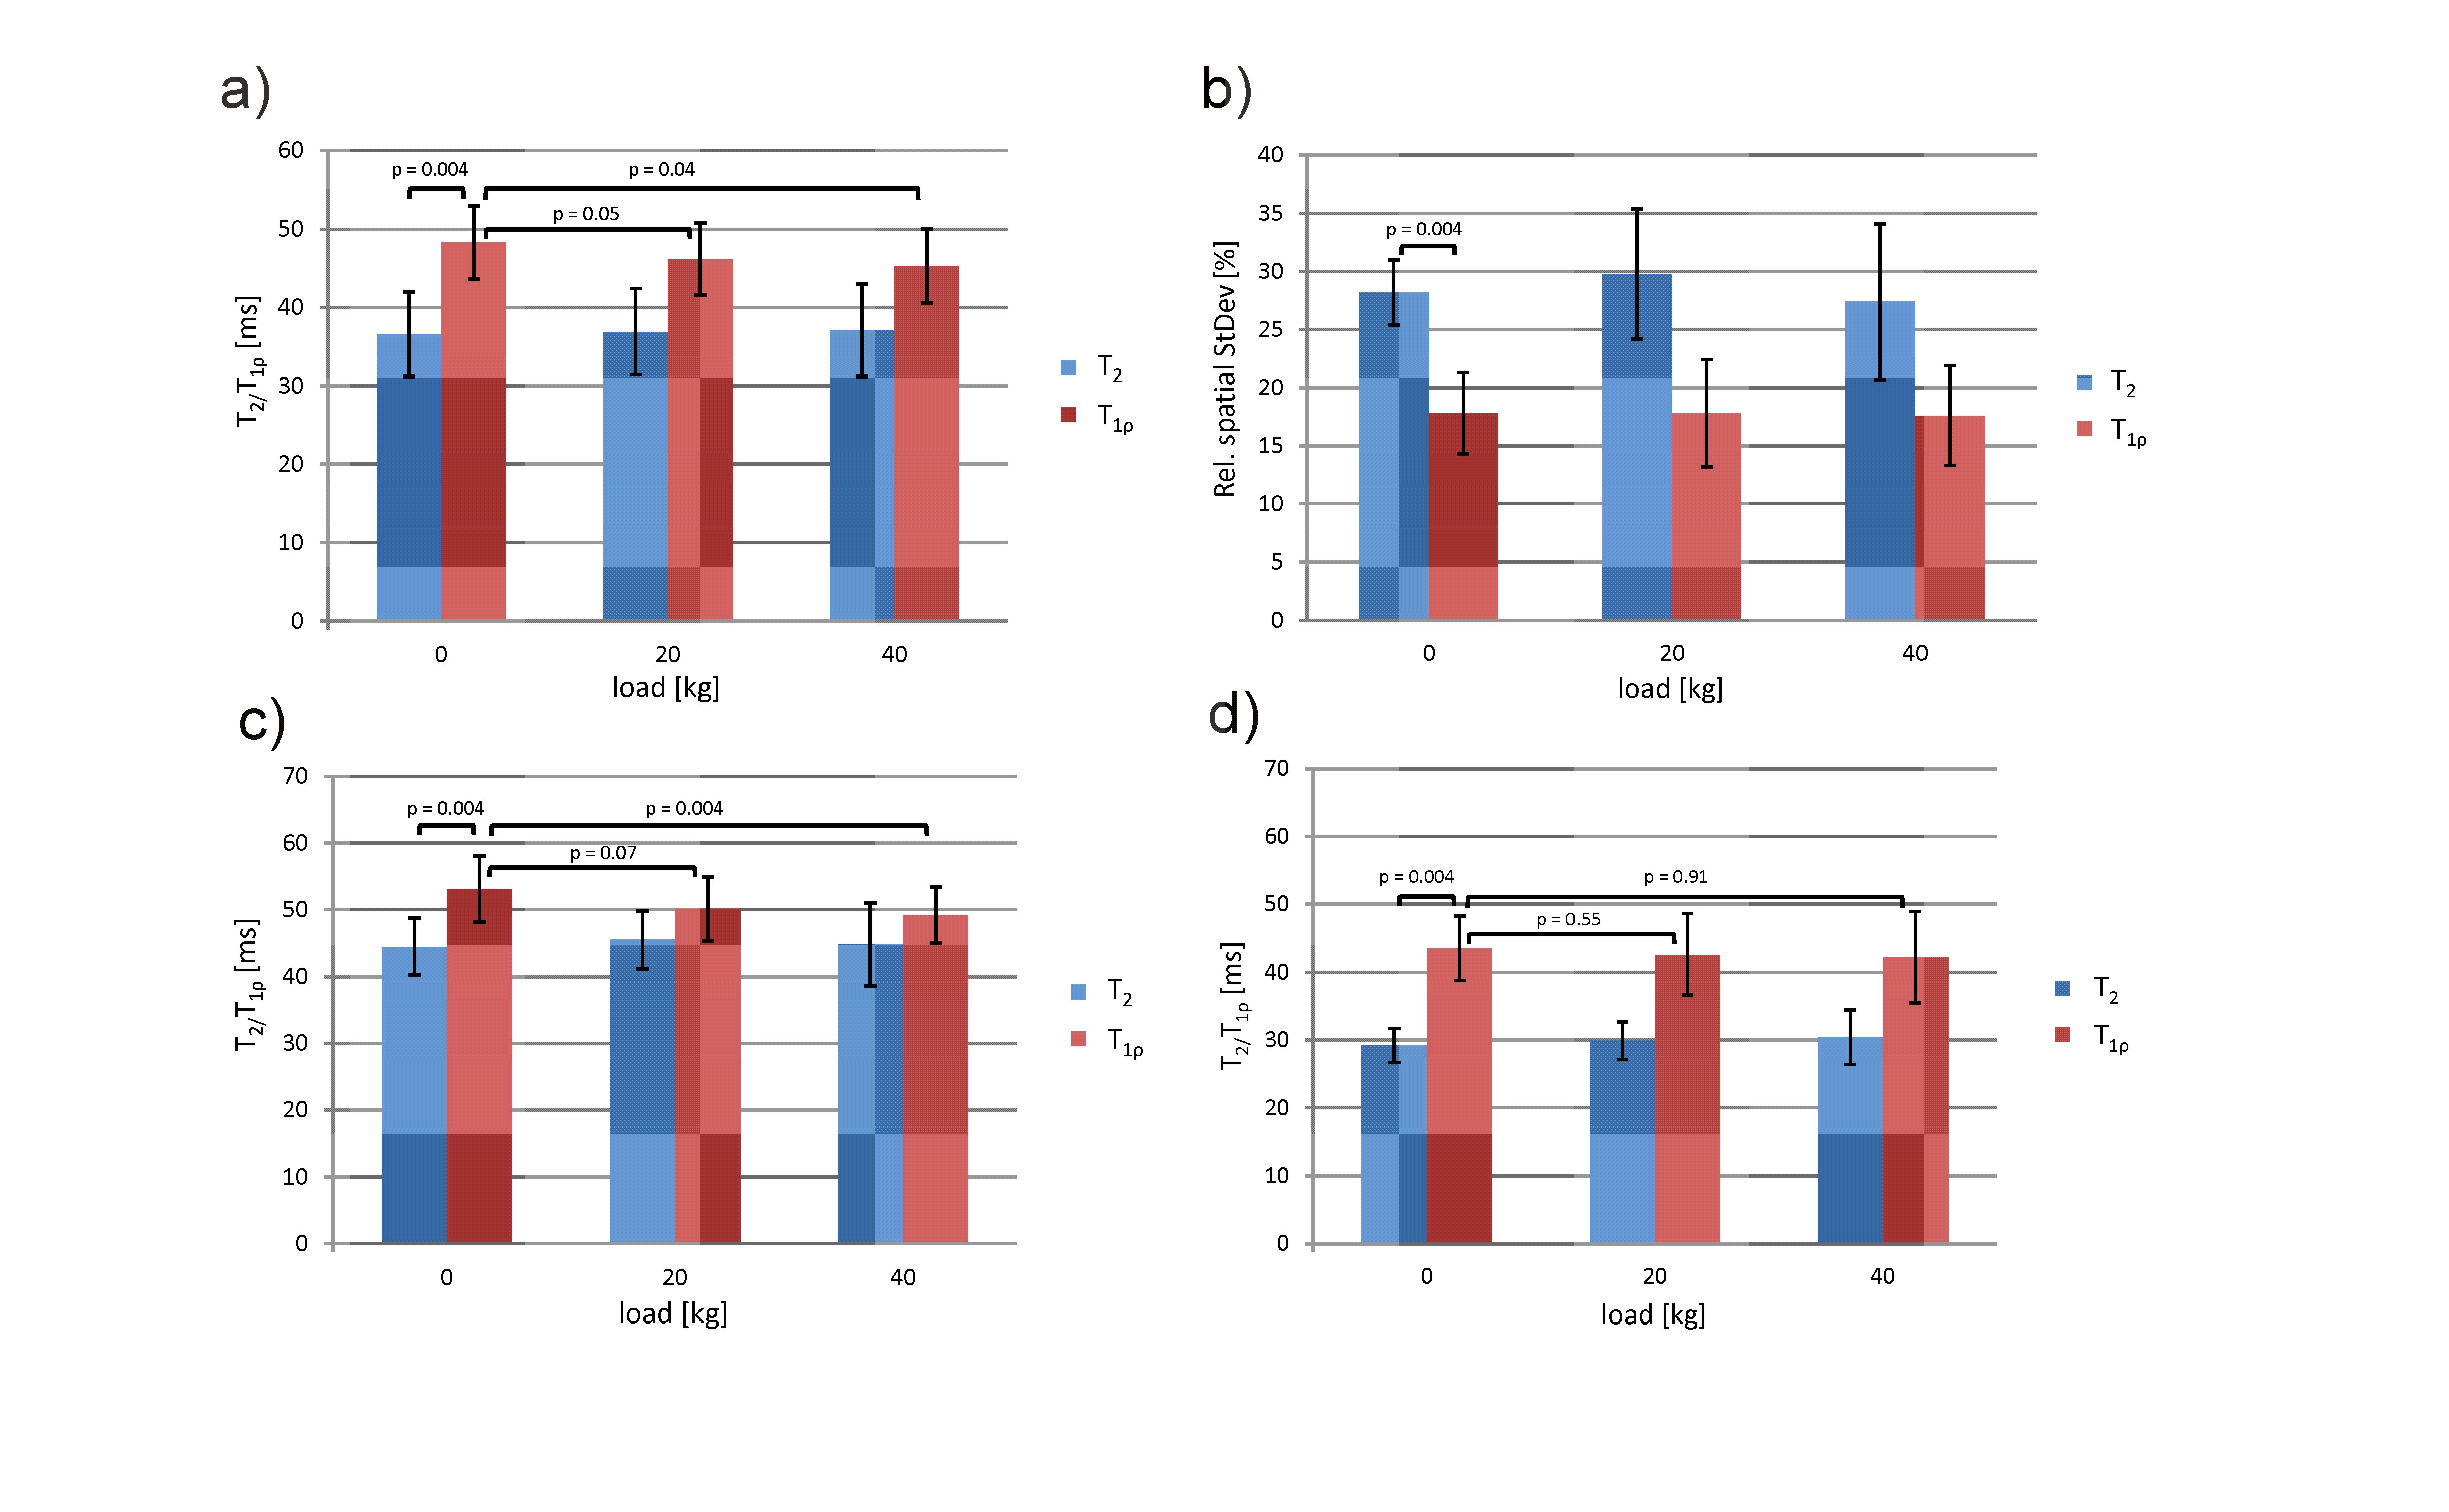
Figure 2 shows T2 and T1ρ maps of the patellofemoral cartilage under different loading conditions for a healthy subject. Patellar T2 and T1ρ are higher in superficial than in deep cartilage layers and exhibit a substantial load-induced decrease for the superficial cartilage layer. In contrast, the deep patellar cartilage layer shows a substantial T2 increase and a less pronounced T1ρ increase. Interestingly, the non-load-bearing zone of the medial patellar facet shows a T2 as well as T1ρ increase with loading. These findings suggest a fluid transport from superficial to deep cartilage and to non-weight-bearing medial regions during loading as already observed for the tibiofemoral joint 3. Repeated measurements on two subjects revealed a higher reproducibility for T1ρ mapping than for T2 mapping (Fig. 3). Out of the ten subjects measured in the pilot study, one subject had to be excluded due to excessive residual motion artifacts. Results from the statistical evaluation of the subject study are presented in Fig. 4. The average relative spatial standard deviation over the ROI was significantly lower for T1ρ than for T2 maps, demonstrating that T1ρ shows less spatial variation in patellar cartilage than T2, which is in line with ex vivo studies on human cartilage specimen 8. While no significant T2 differences for the three loading conditions were observed in the statistical evaluation, patellar T1ρ was significantly reduced under loading. Separate evaluations of superficial and deep cartilage did not show any significant load-induced T2 changes. Significant T1ρ changes in response to loading were only observed for the superficial but not for the deep cartilage. These findings suggest that T1ρ is a more sensitive marker for load-induced changes than T2, which is in line with results obtained for the tibiofemoral joint in a larger subject cohort 3. The different T2 and T1ρ response for the superficial and deep cartilage zones can be explained with structural differences (superficial cartilage: tangential fiber orientation, deep cartilage: radial fiber orientation) 9. However, it should be noted that the separation into superficial and deep cartilage layers in this work was purely based on geometry but not on microscopic structure. Furthermore, only the patellar cartilage was evaluated quantitatively since the femoral cartilage was not rigidly coupled to the tracking marker on the knee cap, which gave rise to load-induced slice offsets hampering a proper comparison. The quantitative results from this pilot study need to be validated in larger subject cohorts, using more sophisticated cartilage segmentation and registration methods.Acknowledgements
We thank Dr. Ari Borthakur for providing the source code of the T1ρ mapping sequence. This work was funded in part by the NIH grant 2R01DA021146, in part by the Helmholtz Alliance ICEMED - Imaging and Curing Environmental Metabolic Diseases, and in part by the German Research Foundation (DFG), grant number LA 3353/2-1.References
1. Nag D, Liney GP, Gillespie P, Sherman KP. Quantification of T2 relaxation changes in articular cartilage with in situ mechanical loading of the knee. J Magn Reson Imaging 2004;19:317–22.
2. Nishii T, Kuroda K, Matsuoka Y, Sahara T, Yoshikawa H. Change in knee cartilage T2 in response to mechanical loading. J Magn Reson Imaging 2008;28:175–80.
3. Souza RB, Kumar D, Calixto N, Singh J, Schooler J, Subburaj K, Li X, Link TM, Majumdar S. Response of knee cartilage T1rho and T2 relaxation times to in vivo mechanical loading in individuals with and without knee osteoarthritis. Osteoarthritis Cartilage 2014;22:1367–1376.
4. Lange T, Maclaren J, Herbst M, Lovell-Smith C, Izadpanah K, Zaitsev M. Knee cartilage MRI with in situ mechanical loading using prospective motion correction. Magn Reson Med 2014;71(2):516-23.
5. Maclaren J, Armstrong BSR, Barrows RT, et al. Measurement and Correction of Microscopic Head Motion during Magnetic Resonance Imaging of the Brain. PLoS ONE 11;7:e48088.
6. Witschey WRT, Borthakur A, Elliott MA, Mellon E, Niyogi S, Wallman DJ, Wang C, Reddy R. Artifacts in T1 rho-weighted imaging: compensation for B1 and B0 field imperfections. J Magn Reson 2007;186:75–85.
7. Lebel RM. StimFit: A toolbox for robust T2 mapping with stimulated echo compensation. Proc. ISMRM 2012; p. 2558.
8. Regatte RR, Akella SV, Lonner JH, Kneeland JB, Reddy R. T1rho relaxation mapping in human osteoarthritis (OA) cartilage: comparison of T1rho with T2. J Magn Reson Imaging 2006;23:547–53.
9. Grunder W, Kanowski M, Wagner M, Werner A. Visualization of pressure distribution within loaded joint cartilage by application of angle-sensitive NMR microscopy. Magn Reson Med 2000;43:884–91.
Figures