1536
The effect of loading on ultrashort echo time magnetization transfer (UTE-MT) imaging and modelling parameters in human articular cartilage: a feasibility study1Radiology, University of California, San Diego, San Diego, CA, United States, 2GE Healthcare, San Diego, CA, United States, 3Radiology Service, VA San Diego Healthcare System, San Diego, CA, United States
Synopsis
UTE_MRI is assumed to be a great non-invasive technique to assess articular cartilage (AC) as a unique viscoelastic tissue, with a very short T2. Early stage of cartilage osteoarthrosis, is hypothesized to affect the mechanical properties of AC, sooner and quicker than its morphology. This study, focused on the application of the UTE_MT modelling and MT ratio variations in femorotibial AC in loaded knee. Compressing the cadaveric human intact knee with different loads, using an MRI-compatible device, resulted in significant increases macromolecule fraction. The local MTR maxima in the AC were interestingly shifted towards the contact point after loading.
Introduction
Tibiofemoral articular cartilage (AC), a key part of the knee joint, is a unique viscoelastic tissue which is generally subject to compressive mechanical loads 1,2. Up to 80% of the AC is composed of water and the rest can be considered as macromolecules (MM) such as collagen and proteoglycan 1,2. When the cartilage is deformed, free water flows within the AC and eventually towards the intraarticular synovial fluid 1. Many studies have attempted to assess knee MRI properties under loading 3–9. Although, ultrashort echo time (UTE) MRI sequences have been developed to image the short T2 tissues in the knee joint (e.g., deep radial and calcified cartilage, menisci, ligaments, tendons and bone), UTE-based assessment of AC in the loaded, intact joint has not been reported in the literature. Nevertheless, few studies were conducted using UTE MRI based assessment of the AC in the unloaded condition 10–12. Among all UTE sequences, the magnetization transfer (UTE-MT) sequence has shown its low sensitivity to the magic angle effect 13,14. UTE-MT is an MR imaging technique exploring the exchange of magnetizations between different water and molecular components. The two-pool MT model, which considers a water pool and a MM pool, has shown to be applicable for different tissues estimating the MM fraction 14. This study was aimed to assess the UTE-MT signal and MTR of the femorotibial AC in a loaded cadaveric human knee compared with the unloaded AC, as performed in a clinical 3T scanner with 3D-UTE-Cones-MT sequences.Methods
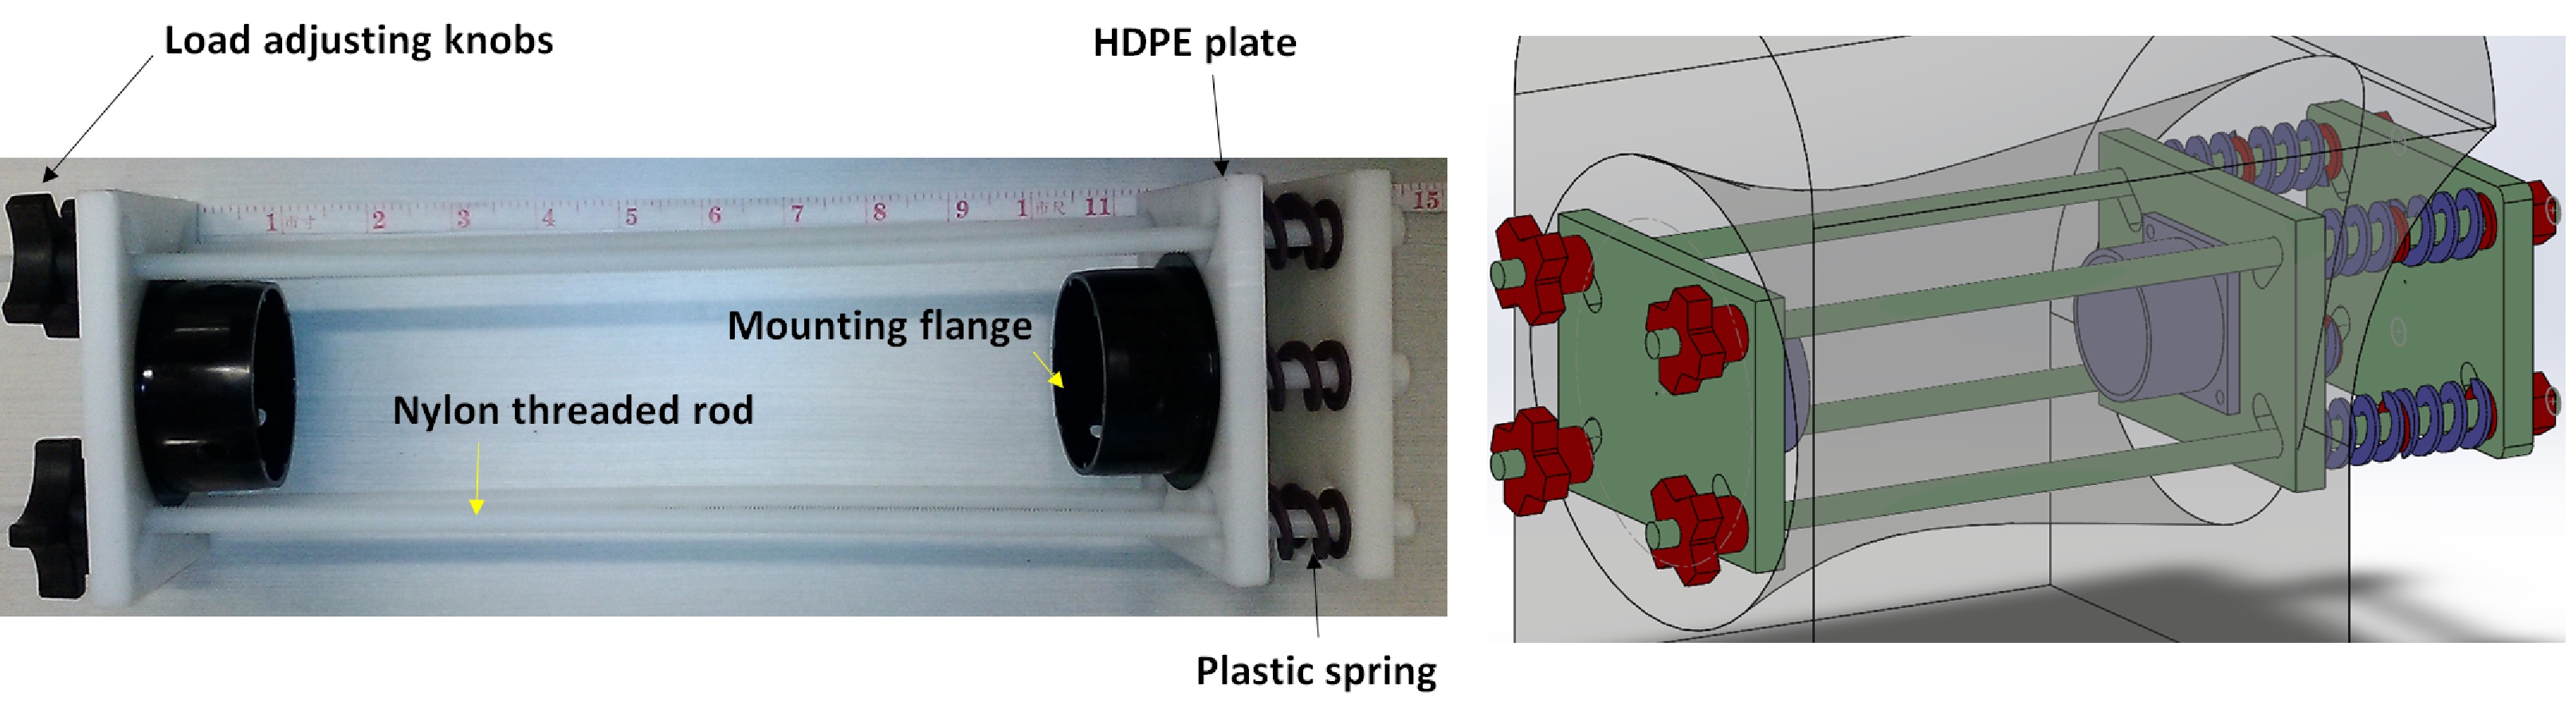
A human knee joint, from a female donor aged 95-years at death, was used in this study. The femur and tibia were cut, approximately five inches from the joint center (joint was intact), being able to fit in the mounts of an in-house designed loading device (Fig.1).
An MRI compatible loading device (Fig.1) employed eight sets of plastic springs (LL100125U40G, Lee Spring, NY, USA). The compression load was adjustable manually using four knobs installed on Nylon threaded rods. The mechanical load was calculated based on the nominal spring stiffness, reported by the manufacturer (i.e., 0.32 Kg/mm). The knee was scanned at three steps of loading; 1) zero, 2) 30 and 2) 50 Kgf.
The knee joint, mounted in the loading device, was placed parallel to the B0 field and imaged in the sagittal plane on a clinical 3T MR scanner (Signa HDxt, GE Healthcare Technologies, Milwaukee, WI) and an eight-channel knee coil. For each loading step, the imaging protocol involved 3D-UTE-MT-Cones with three saturation powers (q = 500°, 900°, and 1500°) and five frequency offsets (Df = 2, 5, 10, 20 and 50 kHz). Other imaging parameters included: FOV = 10.8 cm, matrix=256×256, slice thickness=3mm, 36 slices, flip angle = 7°, bandwidth = 125 kHz, scan time = 2.5 min for each scan.
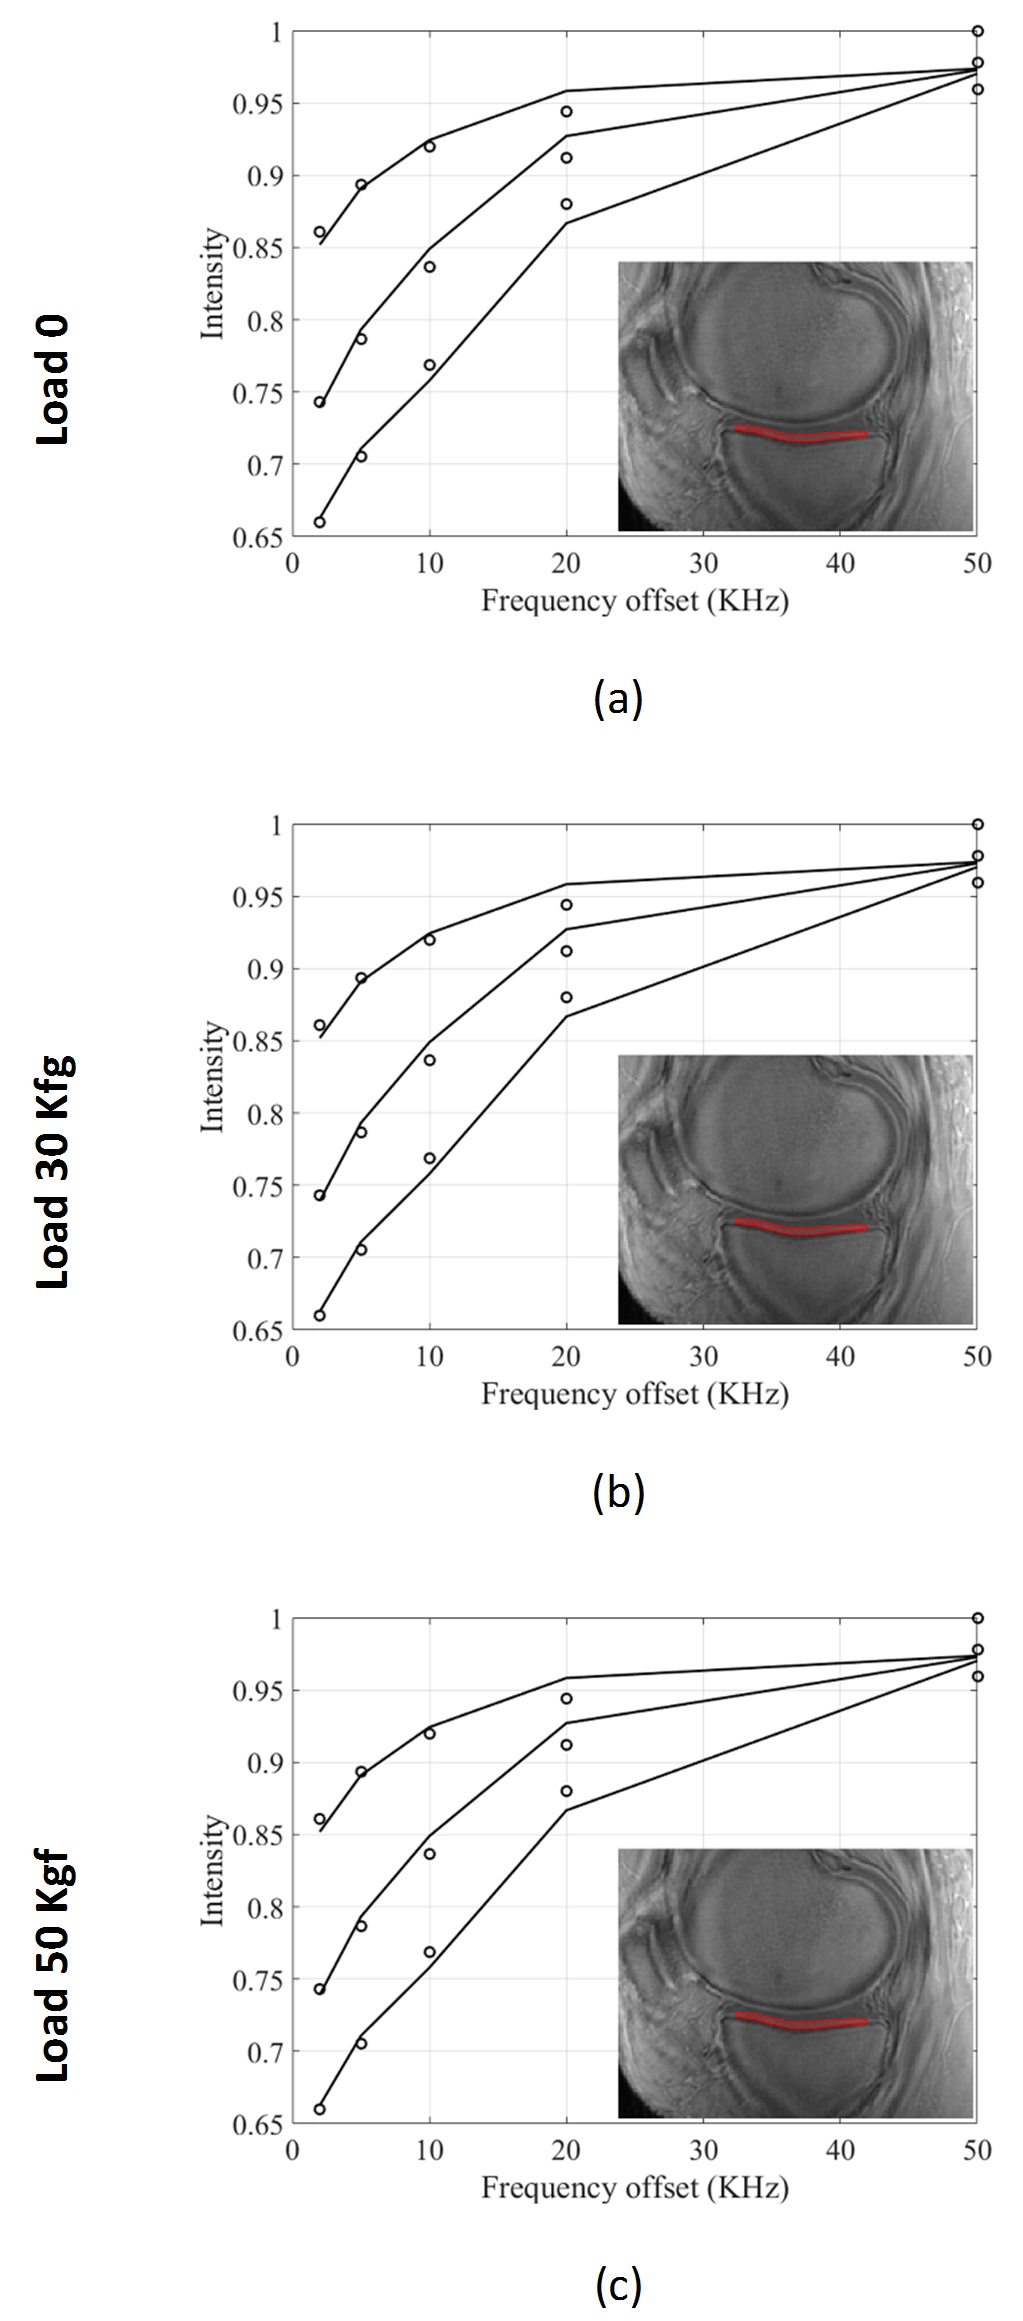
For each set of images, tibial and femoral AC in the medial knee joint (i.e., ROI_1 and ROI_2) were defined for further analyses. The average MT signal, average MTR, MTR map and the two-pool MT modelling parameters were calculated and compared within selected ROIs.
Results
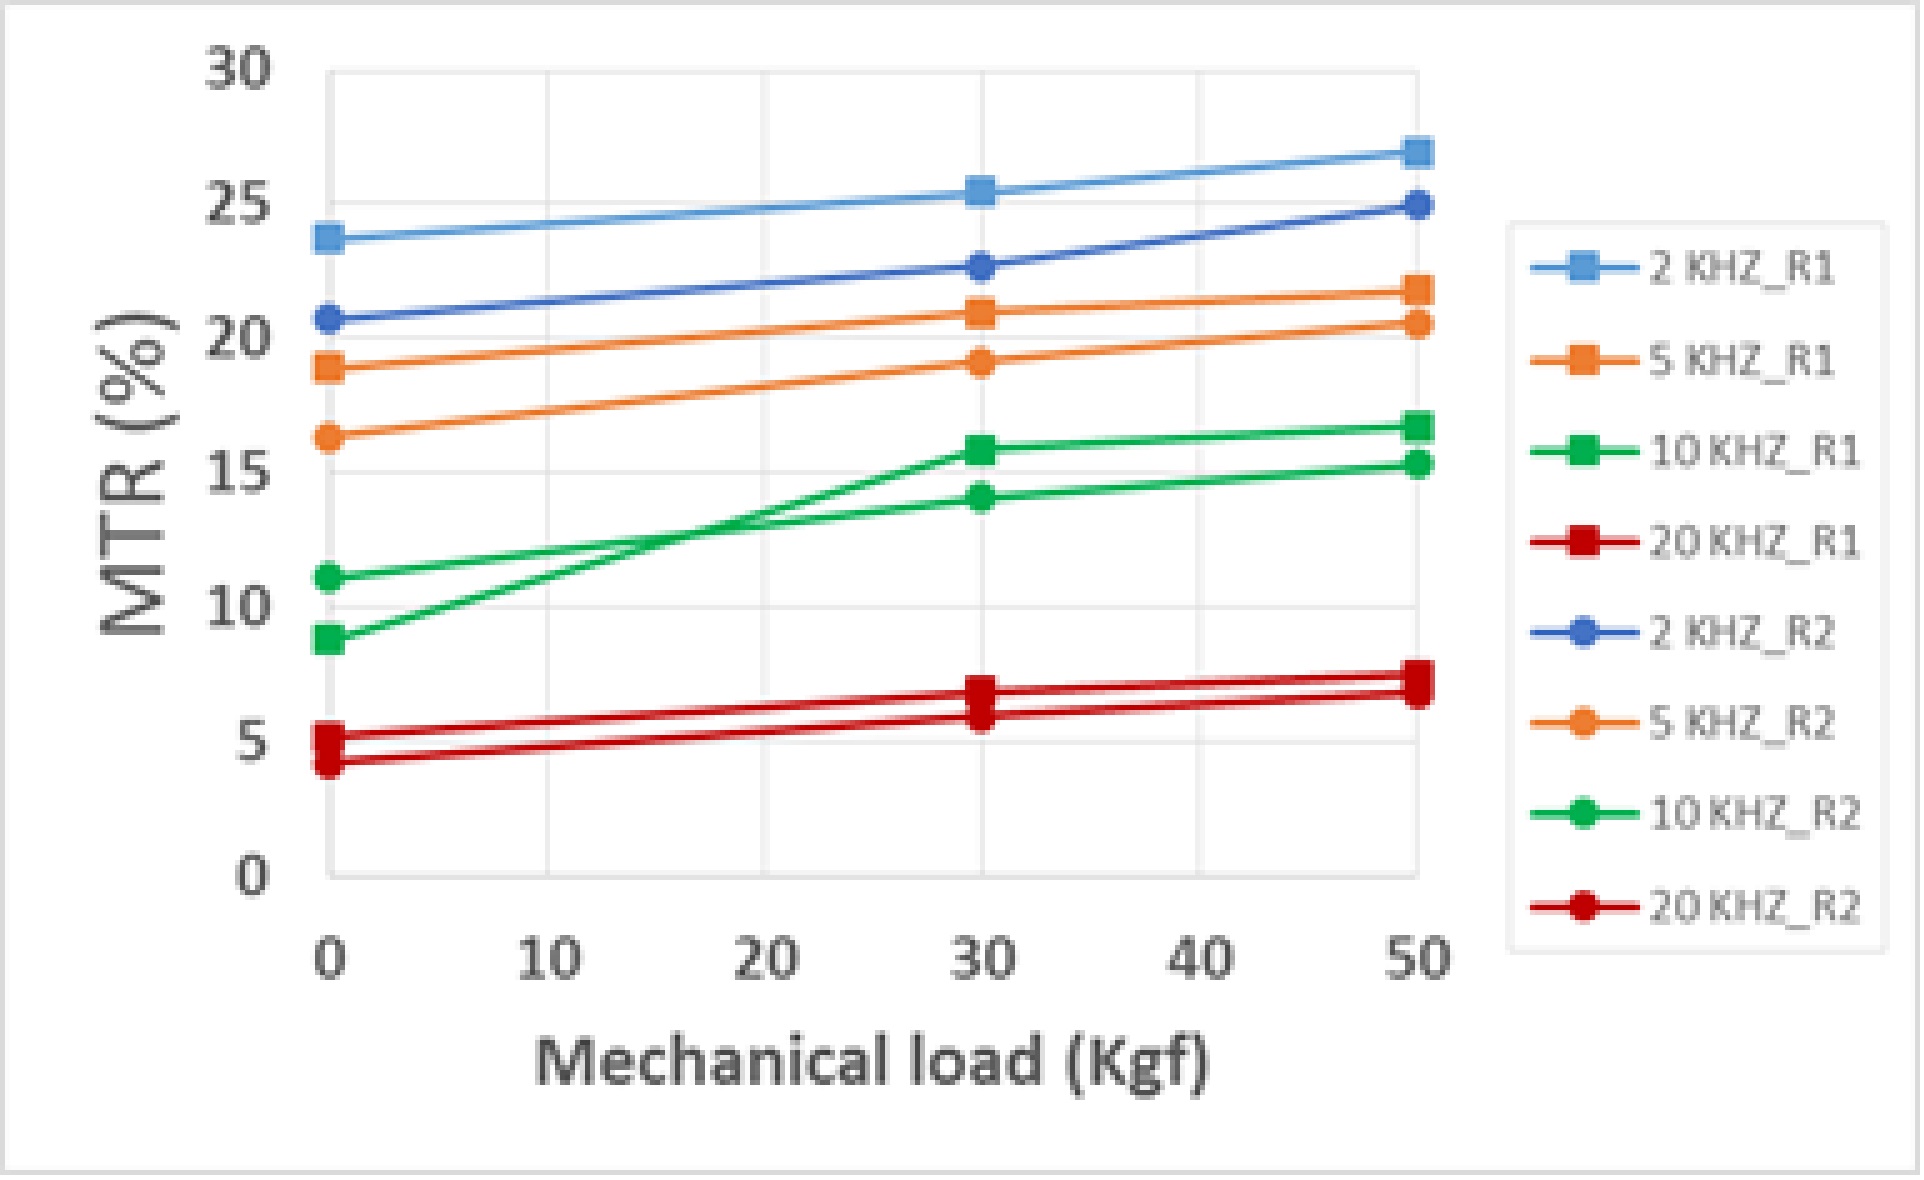
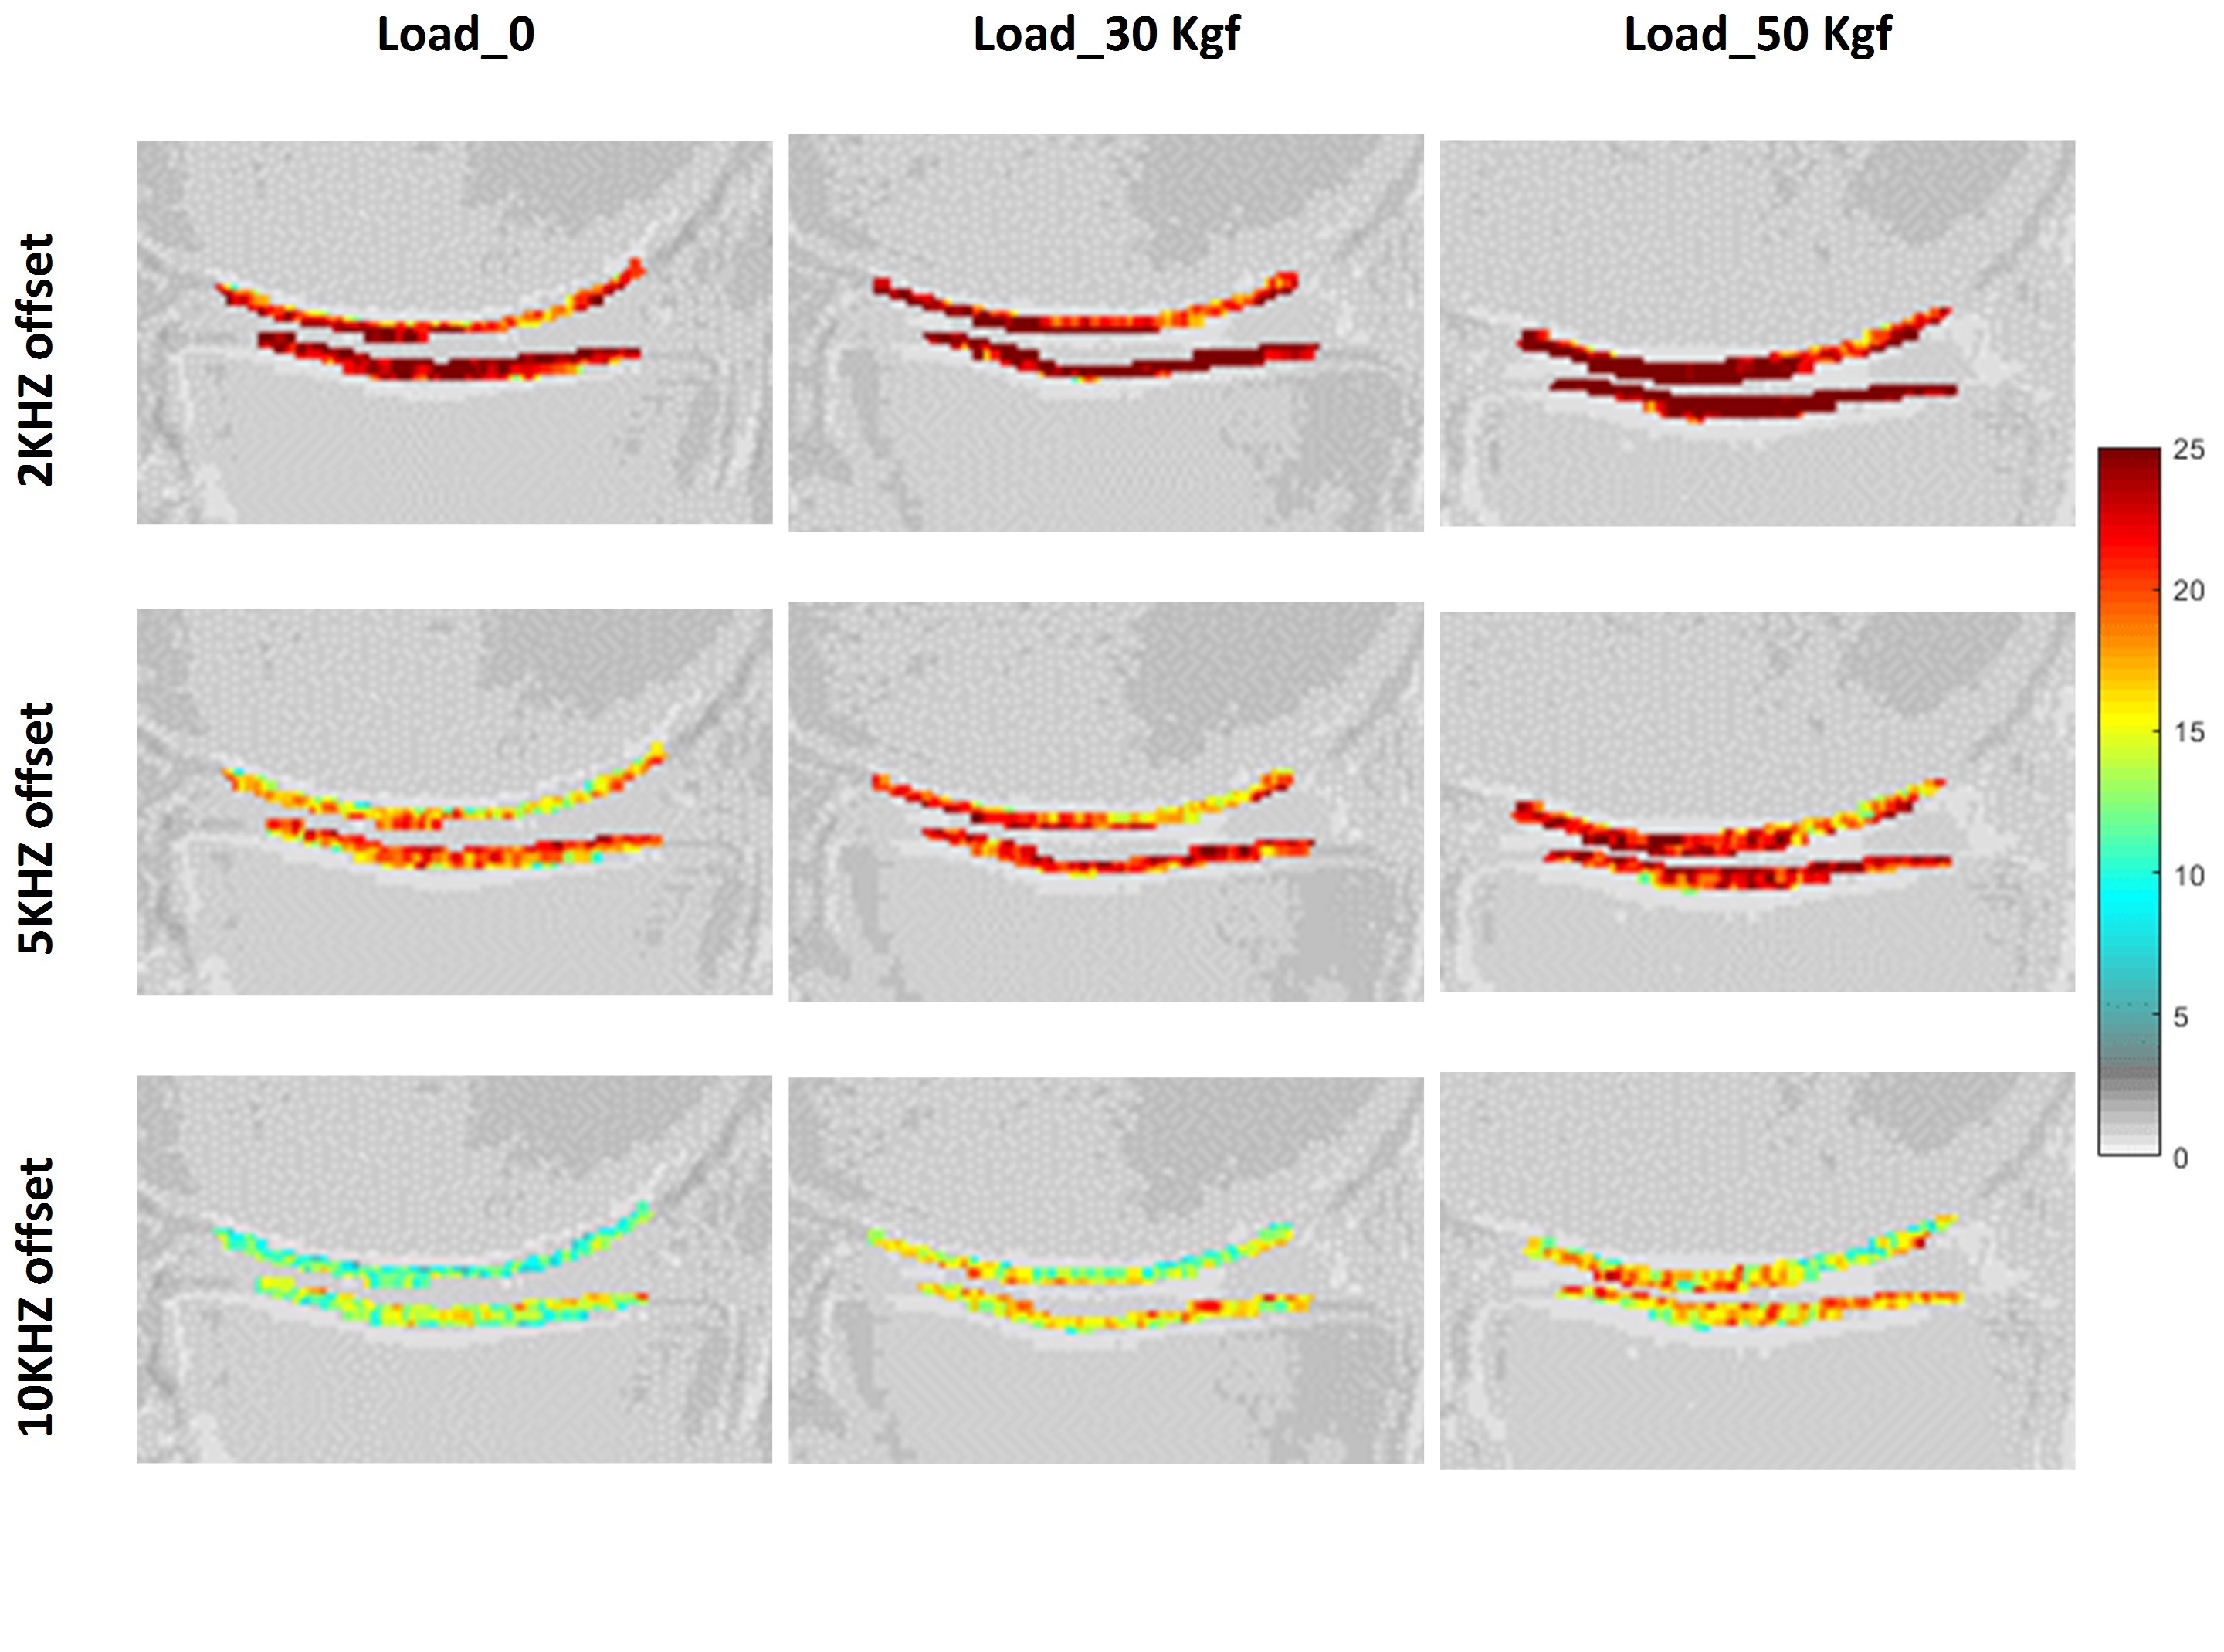
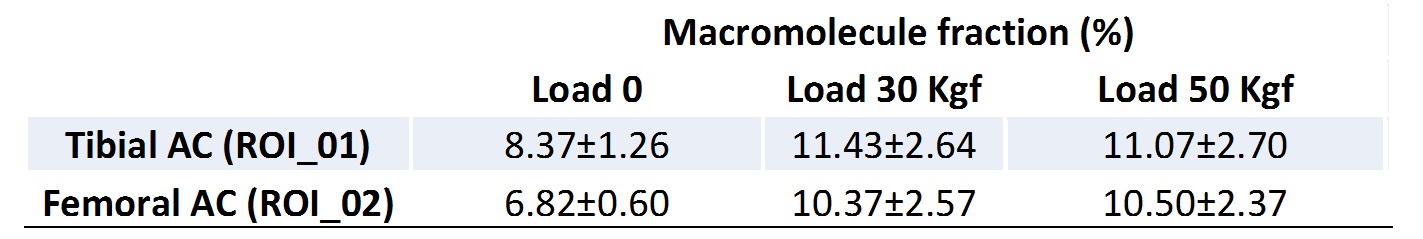
Figure 2 shows the two-pool MT modeling results from ROI analysis of the tibial AC at the three loading steps: 0, 30 and 50 Kgf. The estimated MM fraction is presented in Table 1. The MM fraction increased significantly in both tibial and femoral AC, after the first step of loading, while remaining constant for the second step of loading. The mean MTR of different ROIs are shown in figure 3 at different loading steps. The mean MTR was increased by loading. The MTR map is presented for the selected ROIs in figure 4 at different loading steps and various frequency offsets. The MTR map showed higher variation for lower frequency offsets and higher mechanical load. The higher MTR values were found at the contact point of the AC, particularly for the femoral AC.Discussion
The designed loading device provided measurable and consistent loadings on the knee joint. Compression resulted in a significant increase in MM fraction only at the first loading step. Higher loads did not change the average MM fraction. Most likely, the AC experienced its highest average compression by first loading in the selected ROIs. Remarkably, the loading led to higher regional MTR variation and the mean MTR. MTR local maxima is probably correlates with the mechanical stress concentrations sitesConclusion
This study showed the feasibility of UTE-MTR and MT modelling to assess the AC under loading. Such techniques can be considered as magic-angle-insensitive methods that highlight the sites of stress concentration in the AC.Acknowledgements
The authors acknowledge grant support from NIH (1R01 AR062581-01A1, 1 R01 AR068987-01) and the VA Clinical Science R&D Service (Merit Award I01CX001388).References
1. Mansour, J. M. Biomechanics of Cartilage. Kinesiol. Mech. pathomechanics Hum. Mov. 66–79 (2009). doi:10.1002/art.23548 2. Chang, E. Y., Du, J. & Chung, C. B. UTE imaging in the musculoskeletal system. J. Magn. Reson. Imaging 41, 870–883 (2015). 3. Shiomi, T. et al. Loading and knee alignment have significant influence on cartilage MRI T2 in porcine knee joints. Osteoarthr. Cartil. 18, 902–908 (2010). 4. Nishii, T., Kuroda, K., Matsuoka, Y., Sahara, T. & Yoshikawa, H. Change in knee cartilage T2 in response to mechanical loading. J. Magn. Reson. Imaging 28, 175–180 (2008). 5. Mayerhoefer, M. E. et al. The in vivo effects of unloading and compression on T1-Gd (dGEMRIC) relaxation times in healthy articular knee cartilage at 3.0 Tesla. Eur. Radiol. 20, 443–449 (2010). 6. Nebelung, S. et al. Functional MR Imaging Mapping of Human Articular Cartilage Response to Loading. Radiology 0, (2017). 7. Souza, R. B. et al. Response of knee cartilage T1rho and T2 relaxation times to in vivo mechanical loading in individuals with and without knee osteoarthritis. Osteoarthritis Cartilage 22, 1367–76 (2014). 8. Subburaj, K. et al. Association of MR relaxation and cartilage deformation in knee osteoarthritis. J. Orthop. Res. 30, 919–926 (2012). 9. Cotofana, S. et al. In vivo measures of cartilage deformation: Patterns in healthy and osteoarthritic female knees using 3T MR imaging. Eur. Radiol. 21, 1127–1135 (2011). 10. Shao, H. et al. UTE bi-component analysis of T2* relaxation in articular cartilage. Osteoarthr. Cartil. 24, 364–373 (2016). 11. Qian, Y., Williams, A. A., Chu, C. R. & Boada, F. E. Multicomponent T2* mapping of knee cartilage: Technical feasibility ex vivo. Magn. Reson. Med. 64, 1427–1432 (2010). 12. Williams, A., Qian, Y. & Chu, C. R. UTE-T2* mapping of human articular cartilage in vivo: A repeatability assessment. Osteoarthr. Cartil. 19, 84–88 (2011). 13. Du, J. et al. Qualitative and quantitative ultrashort echo time (UTE) imaging of cortical bone. J. Magn. Reson. 207, 304–311 (2010). 14. Ma, Y.-J., Shao, H., Du, J. & Chang, E. Y. Ultrashort echo time magnetization transfer (UTE-MT) imaging and modeling: magic angle independent biomarkers of tissue properties. NMR Biomed. 29, 1546–1552 (2016).Figures