1535
The effect of loading on T2* and MT ratio in tendons: A feasibility study1Radiology, University of California, San Diego, San Diego, CA, United States, 2GE Healthcare, San Diego, CA, United States, 3Radiology Service, VA San Diego Healthcare System, San Diego, CA, United States
Synopsis
UTE_MRI is assumed to be a great non-invasive technique to assess tendons as a unique viscoelastic tissue, with a very short T2. Early stage of tendon diseases, is hypothesized to affect the mechanical properties of tendon sooner and quicker than its morphology. This study, focused on the UTE-based T2* and MTR variations of the tendon samples under mechanical loading. Stretching the tendon samples with different loads using an MRI-compatible device resulted in significant reductions of T2* and increases in MTR. The MTR regional variations and shifts, obtainable by presented approach will help for assessing tendon quality and health level.
Introduction
Tendons connect muscle and bone and act as biological springs to store and release energy during locomotion. Over 80 % of the dry weight of tendons is composed of highly ordered collagen fibers. As a result, tendons have very short T2, “invisible” when imaged in clinical MR sequences. Using ultrashort echo time (UTE) sequences, significant signal in tendons can be detected, allowing quantitative MR imaging such as T2* and magnetization transfer ratio (MTR) measurements 1,2. Over the course of tendon stretching, the water flows within the collagenous structure towards the sites of lower mechanical load or outside of the tissue. Therefore, changes in T2* and MTR variations are expected in the loaded tendon. Despite this hypothesis, no significant differences in T2* values were observed after loading tendons in our previous studies 3, due to technical limitations in applying loads. Using suturing strings, the maximum load applied was about 1 Kgf; however, higher loads are applied on tendons in real-life. This study aimed to determine if the application of tensile load alters T2* and MTR of human tendons as measured on a clinical 3T scanner. Specifically, the MTR regional variation is assumed to correlate with mechanical stress concentration.Methods
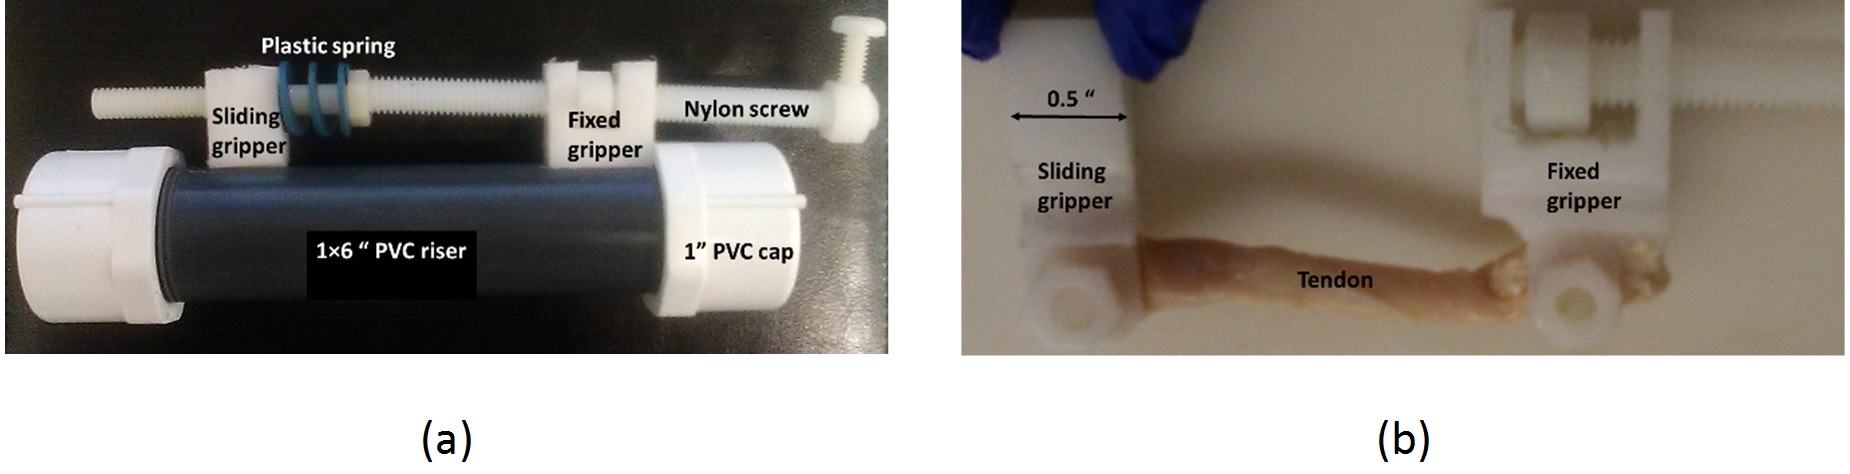
Sample preparation: Two peroneal tendon samples (longus and brevis) were harvested from one donor ankle (female, 95-years-old). Tendon samples were cut to a length of approximately 6 cm. Samples were immersed in saline for 2 h at 4 °C and gently mounted into an in-house-prototyped plastic loading device (Fig.1) filled with perfluoropolyether (Fomblin, Ausimont, Thorofare, NJ) to minimize dehydration and susceptibility artifacts.
Mechanical loading device: An MRI compatible loading device was prototyped using a plastic spring (LL075100U36G, Lee Spring) compressed by a manually driven screw, mounted on a notched standard 1×6 inch PVC riser (Fig.1). The tendon specimens were fixed in fixed and sliding grippers using Nylon bolts (Fig.1b). The mechanical load was calculated based on the nominal spring stiffness, reported by the manufacturer (i.e., 0.2 Kg/mm). The first and second tendon sample underwent one step (1.5 Kgf) and two steps loading (1.5 and 3 Kgf), respectively.
UTE sequences: Specimens were placed parallel to the B0 field and imaged in the axial plane on a clinical 3T MR scanner (Signa HDx, GE Healthcare Technologies, Milwaukee, WI) using a wrist coil (BC-10, Medspira, Minneapolis, MN). A quantitative imaging protocol was performed, consisting of 1) 3D-UTE-Cones (TR=24.3 ms, TE: 0.032, 0.4, 0.8, 4.4, 8.8, 13 ms) and 2) 3D-UTE-MT-Cones (MT pulse power = 1500 deg, frequency offset = 2, 5, 10 KHz). Other imaging parameters include: FOV = 4 cm, matrix=192×192, slice thickness=2mm, flip angle = 10°, bandwidth = 62.5 kHz.
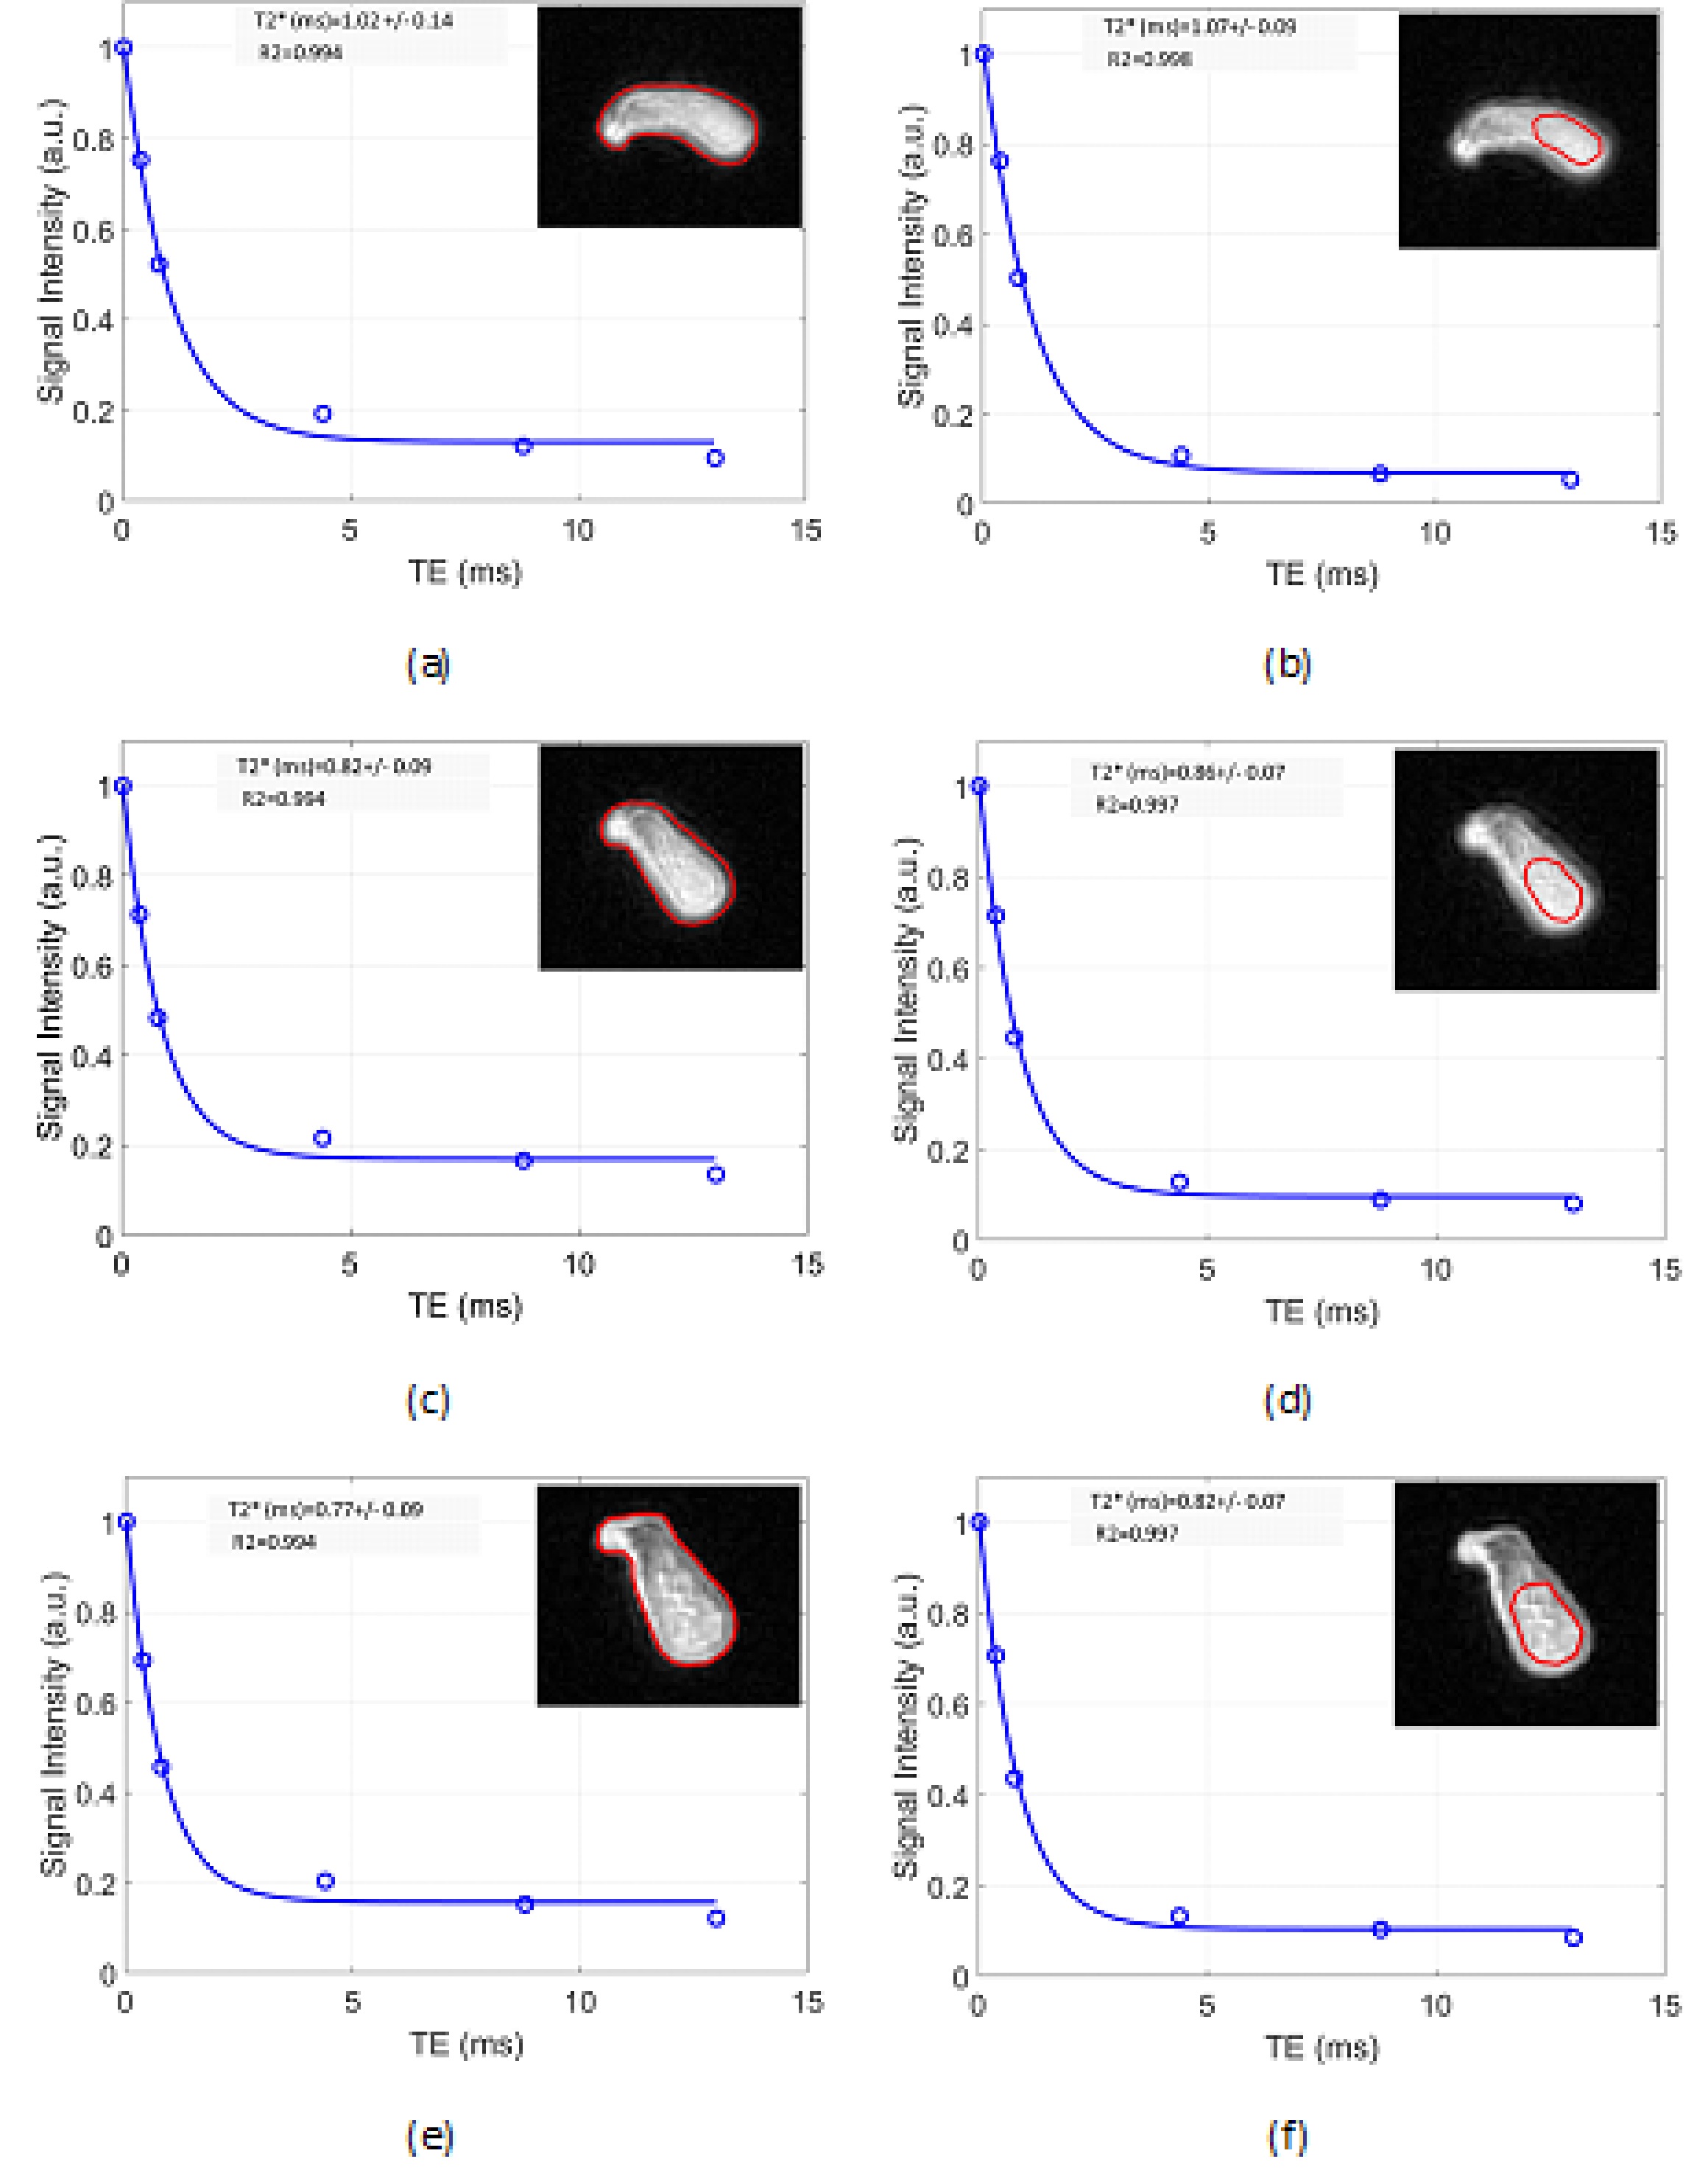
Data analysis: For each set of images, two ROIs were defined covering the whole and central regions of the tendons, respectively (Fig.2). Single-component model parameters and MTR analyses were performed in Matlab and compared for tendon samples without and with loading.
Results
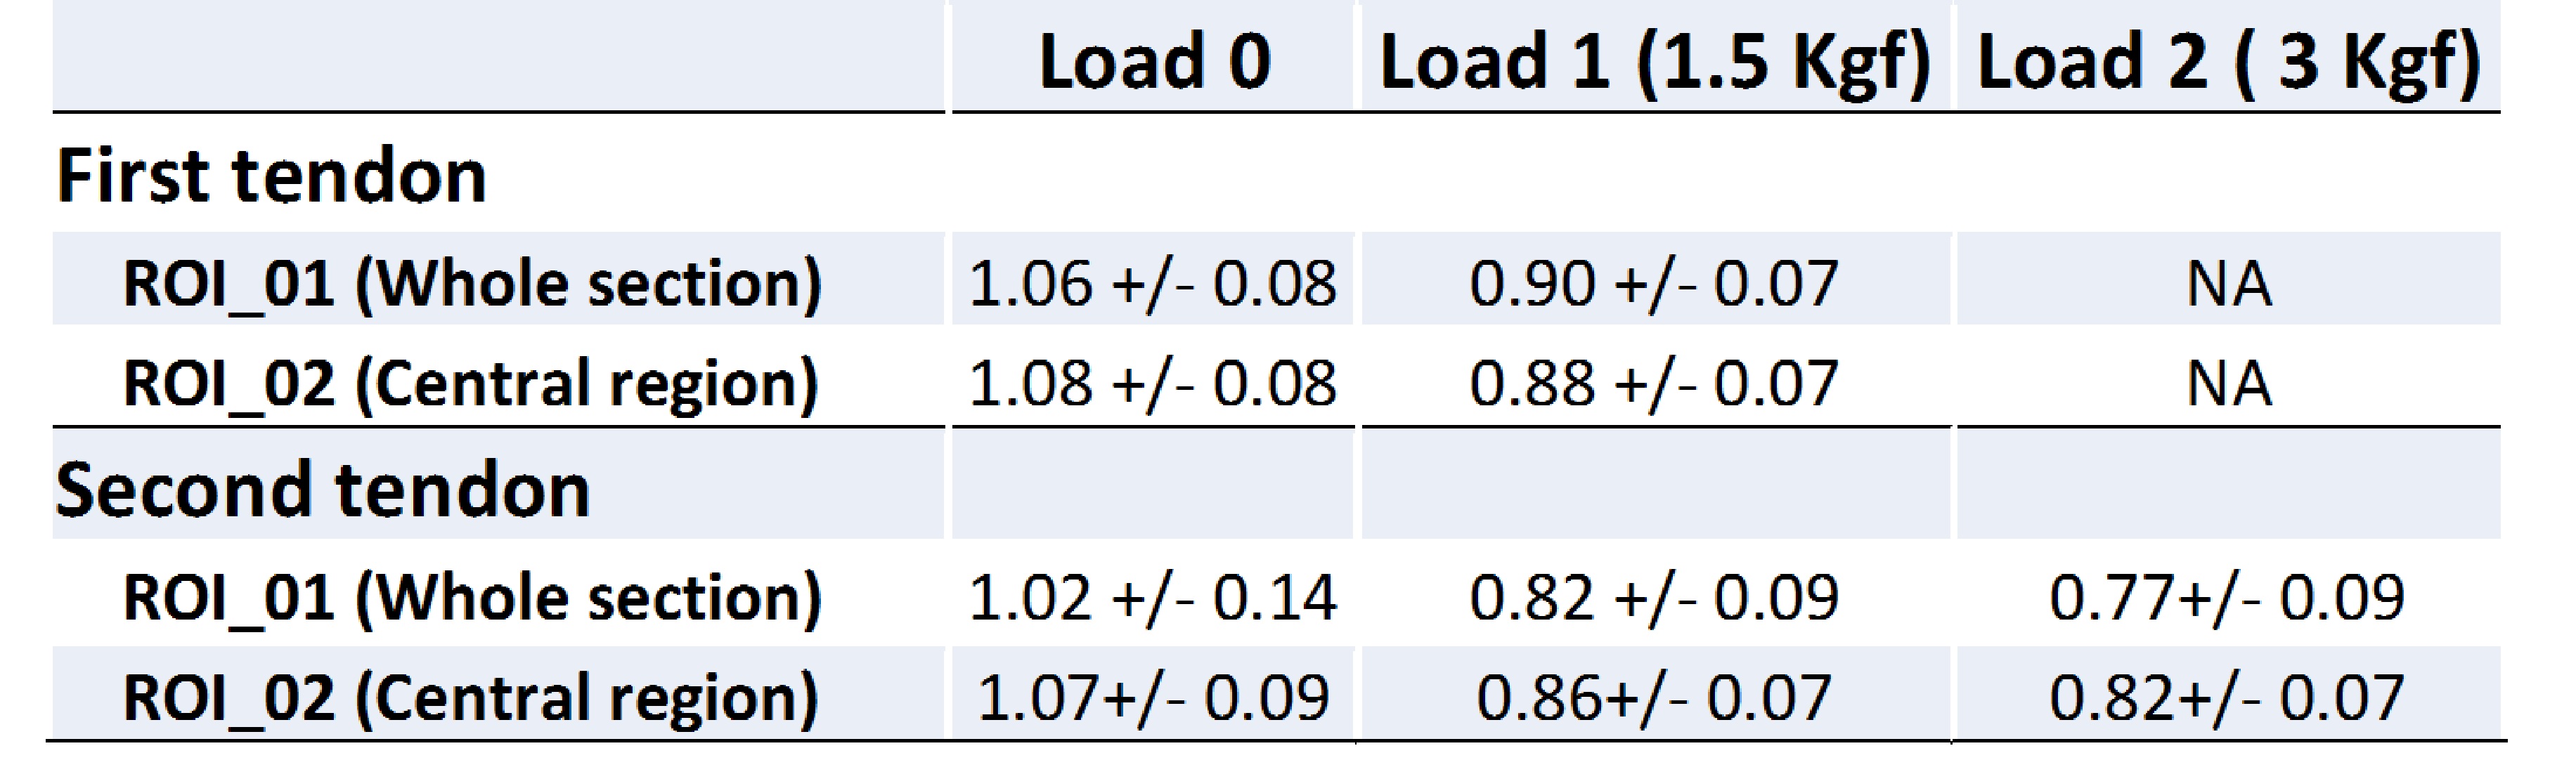
Figure 2 shows the single-component T2* analyses in the second
tendon for different loading steps. The T2* values showed a significant
decrease at the first loading step (1.5 Kgf). The T2* reduction was less at the
second step of loading. The calculated T2* values for all ROIs in examined
samples are presented in Table 1. Different sections of the samples demonstrated
similar trend of T2* reduction.
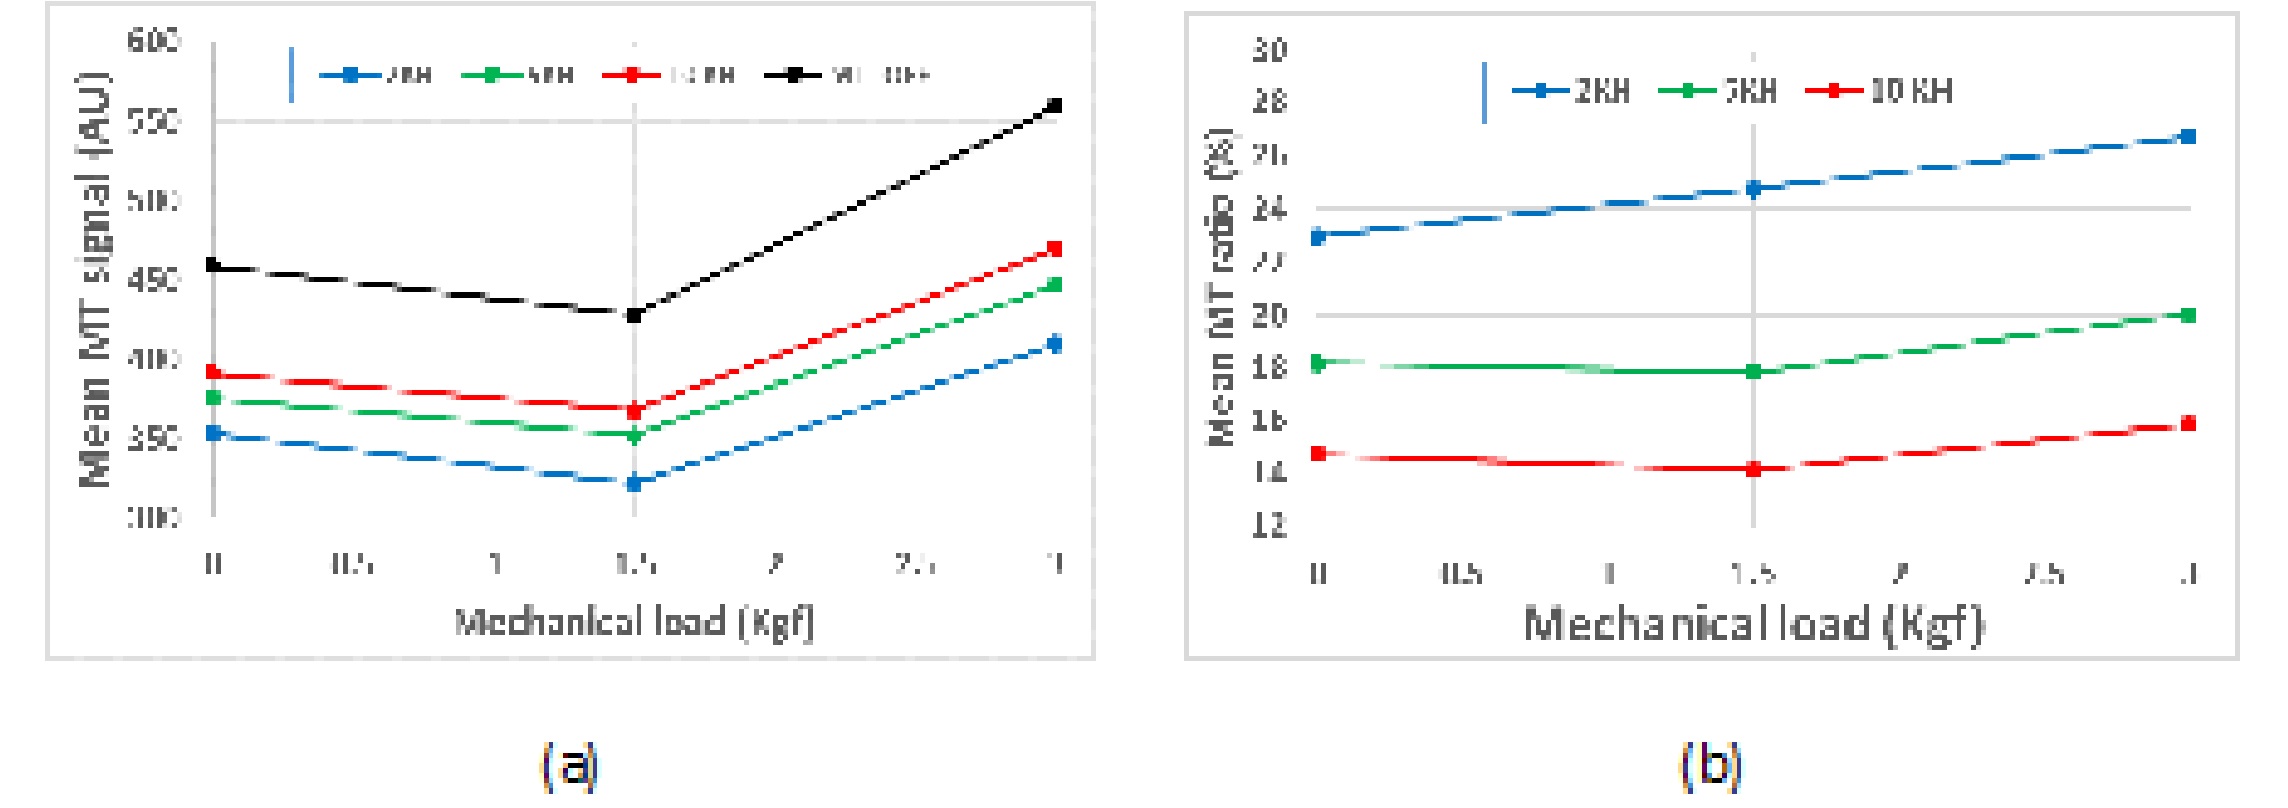
Figure 3 shows the mean MT signal and MTR in first ROI of the
second tendon for different loading steps. Increasing the MT frequency offset resulted
in higher UTE signal (Fig.3a) yet lower MTR (Fig.3b).
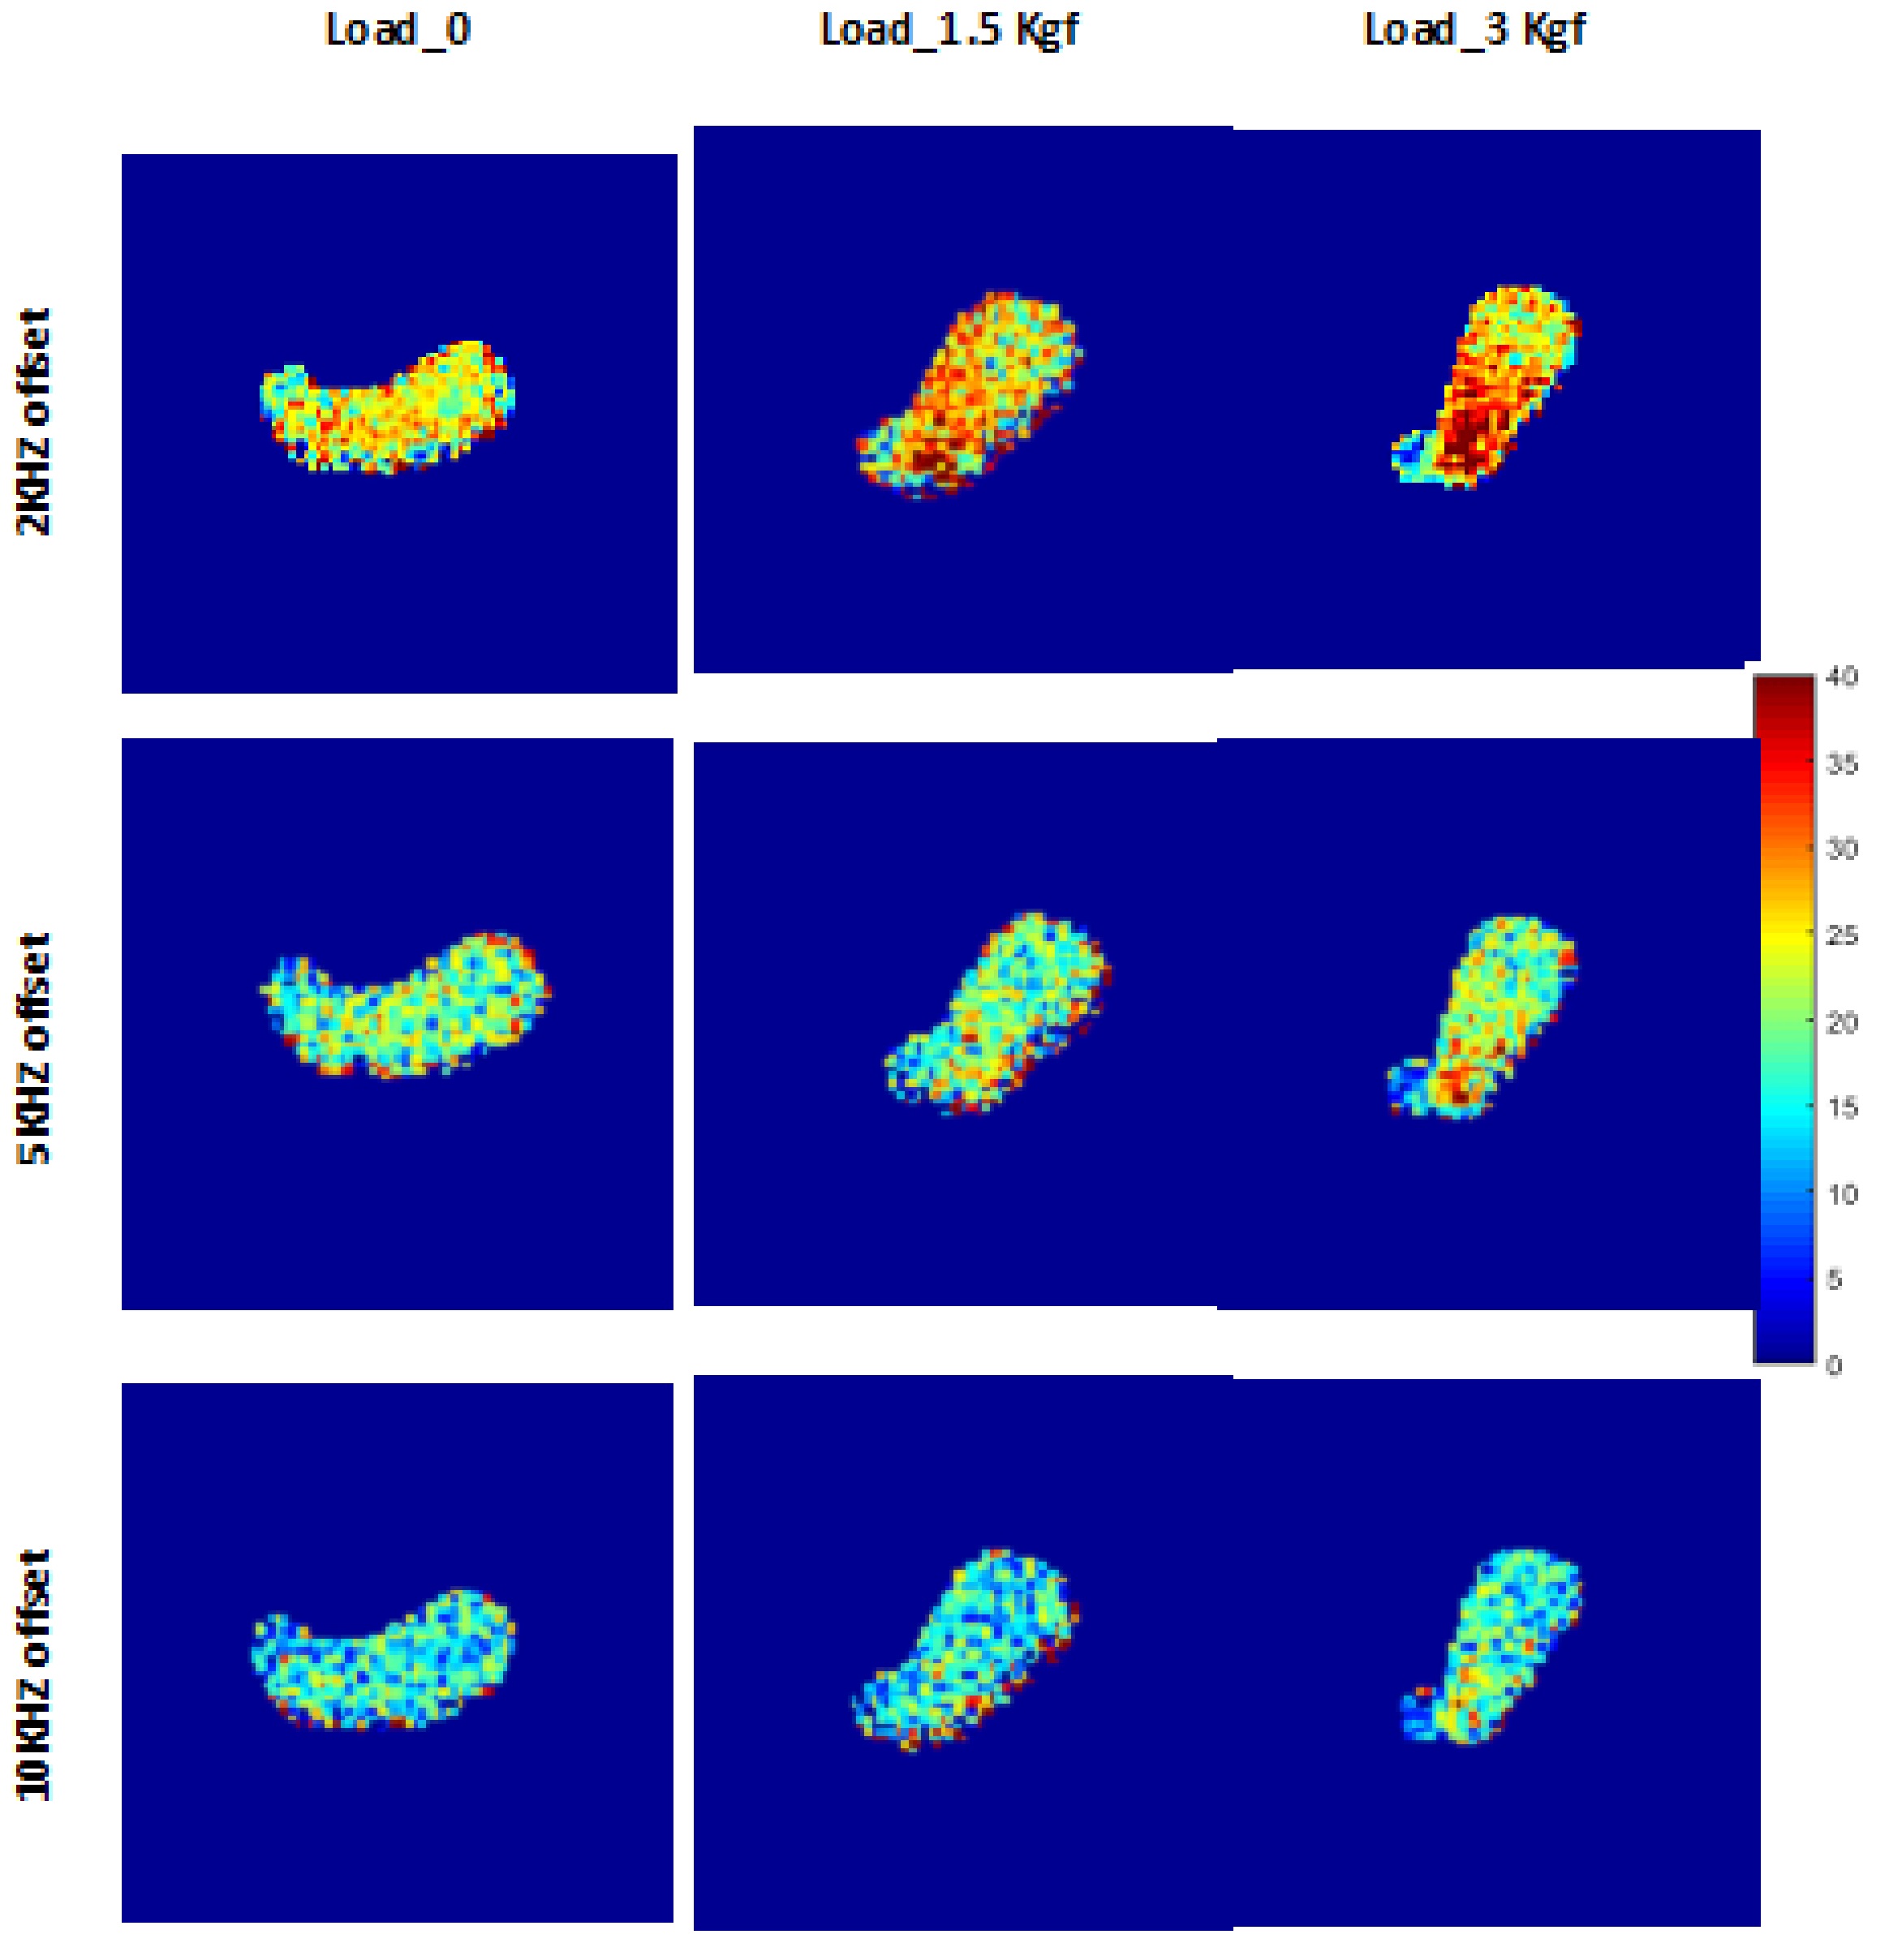
Figure 4 presents the MTR regional map for the selected section in
the second tendon sample. Notably, the MTR map shows higher variation in loaded
tendons.
Discussion
The new loading device helped us to apply higher loads compared to previous study. Loading resulted in significant decrease in T2* values, specifically for the first loading step. The mean MTR was increased for both loading steps. MTR regional variations were higher for loaded tendons and lower MT frequency offsets. The higher MTR regions are probably indicating the higher mechanical stresses and lower water content. T2* reduction and MTR increase agreed with a priori defined hypothesis. Specifically, free water flows within the collagenous ultrastructure of the tendon, ends in higher concentration of the macromolecules. The MTR map of loaded tendon with central local maxima, indicates the highest mechanical stress and likely highest tendon quality at the center.Conclusion
This study showed the feasibility of employing T2* and MTR variations through loading steps in tendons to assess the tendons mechanical performance and quality.Acknowledgements
The authors acknowledge grant support from NIH (1R01 AR062581-01A1, 1R01 AR068987-01.References
1. Du, J. et al. Qualitative and quantitative ultrashort echo time (UTE) imaging of cortical bone. J. Magn. Reson. 207, 304–311 (2010).
2. Chang, E. Y., Du, J. & Chung, C. B. UTE imaging in the musculoskeletal system. J. Magn. Reson. Imaging 41, 870–883 (2015).
3. Chang, E. Y. et al. Single- and Bi-component T2Star analysis of tendon before and during tensile loading, using UTE sequences. J. Magn. Reson. Imaging 42, 114–120 (2015).
Figures