1534
MR Microscopy of early changes in osteoarthritis – Ex-vivo study of the osteochondral degenerative process at 7T1High Field MR Centre, Department of Biomedical Imgaing and Image-guided Therapy, Medical University of Vienna, Vienna, Austria, 2Christian Doppler Laboratory for Clinical Molecular MR Imaging, Vienna, Austria, 3Department of Orthopaedic Surgery, Medical University of Vienna, Vienna, Austria, 4Department of Imaging Methods, Institute of Measurement Science, Slovak Academy of Sciences, Bratislava, Slovakia, 5Department of Radiology, Division of Radiological Physics, University of Basel Hospital, Basel, Switzerland, 6Center for Medical Physics and Biomedical Engineering, Medical University of Vienna, Vienna, Austria
Synopsis
Visualizing the early changes in osteoarthritis is still challenging the musculoskeletal imaging community. Especially structures of the osteochondral junction cannot be depicted by conventional MRI due to their thinness and short T2/T2* relaxation times. A variable echo time sequence in combination with high field 7T and a MR microscopy setup, allows microscopic resolution and echo times in the sub-millisecond range and can be used for visualizing short T2/T2* structures of the cartilage-bone interface such as calcified cartilage. In this study we focused on imaging early changes in osteoarthritis as approach for bringing biological information closer to clinic related applications.
Purpose
The aim of this study is to visualize local changes in the osteochondral area with MR microscopy and a variable echo sequence ranging from early to late stage degenerative processes in osteoarthritis validated by histology.Introduction
The osteochondral junction representing the interface between cartilage and bone reflects an interesting area for early changes in osteoarthritis. Damage in cartilage often results in degenerative changes of the calcified cartilage as well as the subchondral region where the tidemark -as a part of the osteochondral junction- appears in the histological slide as a thin line and turns into doubling or even multiplication in the progressive osteoarthritic process. Interestingly cartilaginous changes affect also the thickness of the calcified layer close to these local tidemark changes [1].
Besides osteochondral interface the osteophyte formation undergoing finally endochondral ossification represent an interesting model for mesenchymal differentiation in the degenerative process. Visualizing the early changes in osteoarthritis is still challenging the musculoskeletal research community. Respectively the structures of the osteochondral junction cannot be accurately depicted by conventional MRI due to their thinness and short T2/T2* relaxation times [2]. A variable echo time sequence [3] in combination with ultra-high field 7T and a MR microscopy setup, allows microscopic resolution and echo times in the sub-millisecond range and can be used for visualizing short T2/T2* structures of the cartilage-bone interface such as calcified cartilage. In this study we focused on imaging early changes in osteoarthritis an approach for bringing biological information closer to clinic related applications.
Methods
Femoral condyles (N= 3) were obtained from osteoarthritic (OA) patients after total knee replacement. MR examinations were performed on 7T MRI (Magnetom Siemens Healthineers, Erlangen, Germany) using a microimaging system [4] providing a gradient strength of 750 mT/m. MRI acquisitions were performed with 19mm and 39 mm - 1H NMR volume coils (Rapid Biomedical, Wuerzburg, Germany), depending on sample size.
For morphological evaluation and T2* mapping of the cartilage-bone interface a variable echo time (vTE) sequence was used [1]. In short, the sequence is a modified 3D Cartesian spoiled gradient echo (SPGR) sequence using highly asymmetric readout and a variable echo time scheme to dynamically adapt and shorten the echo time towards the center of k-space. This concept allows effective echo times in the sub-millisecond range. In addition, the sequence uses project onto convex sets (POCS) formalism for reconstruction of the undersampled data set [5]. The imaging parameters for each measurement are specified in the figure captions.
The T2*maps were acquired using a single echo approach. Following echo times where used - TEs: 0.4, 0.7, 1.2, 1.7, 2.5, 3, 4, 5, 6 ms. The calculation of the T2* maps was done by using a custom-build IDL script (Interactive Data Language, Research Systems, Inc., Boulder, CO, USA). The fitting is based on the Levenberg- Marquardt algorithm (LMA) [6].
Ensuing the MRI experiment, the cartilage-bone samples were stained with picrosirius red (PSR) for visualization of changes of collagen fibre in the cartilage using light microscopy (LM) and polarized light microscopy (PLM, Zeiss Oberkochen, Germany).
Results and discussion
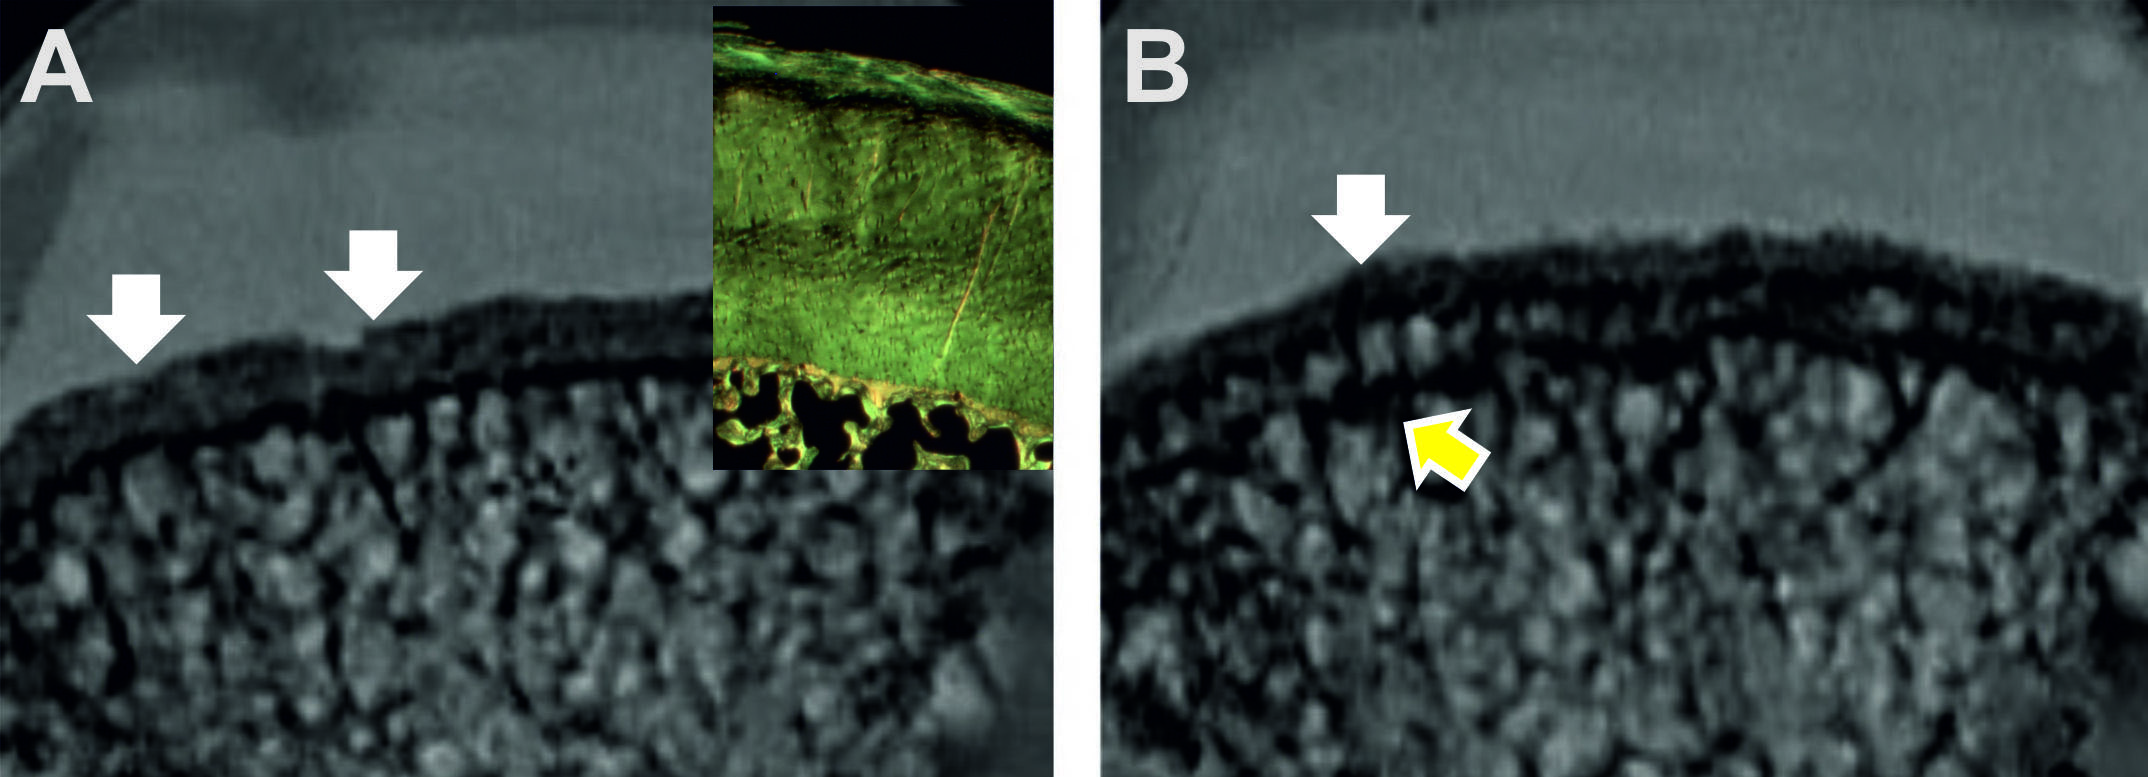
The variable echo time sequence allows to acquire signal from the deep zone associated with calcified cartilage (Fig. 1A). The femoral condyle was macroscopically mildly affected and the cartilage surface nearly bland. Looking at the local distribution of the calcified cartilage the thicker layer was found in the area with intact single tidemark and could be validated by PSR staining to be associated with the deep layer with leaflet like arcardes and structured subchondral bone. Zooming closer into the contigous region, the calcified layer is narrowing as a sign of local OA progression and subchondral changes including tidemark doubling could be detected (Fig. 1B). In the presented osteochondral OA plug from the femoral condyle the MR microscopy verified local changes in the thickness of the calcified layer.
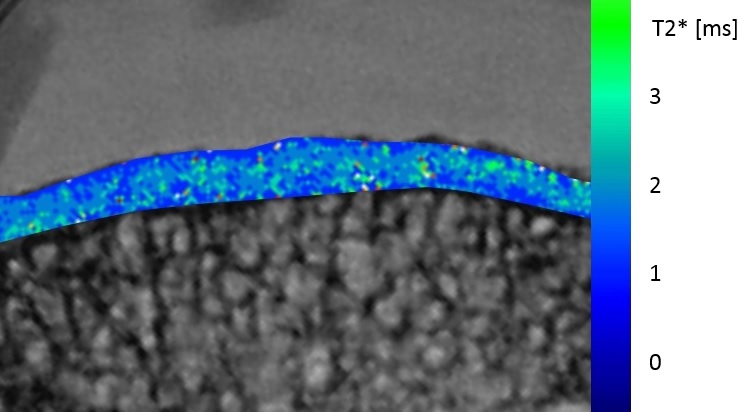
The T2* maps (Fig. 2) show values of approximately 1 ms for the calcified cartilage layer which is in line with previous findings [2].
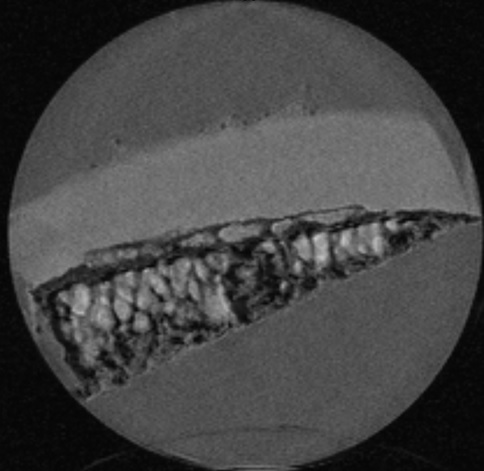
Furthermore early OA progression during osteophyte formation could be described in Fig. 3 where subchondral remodeling in chondral formation below the tidemark could be detected.
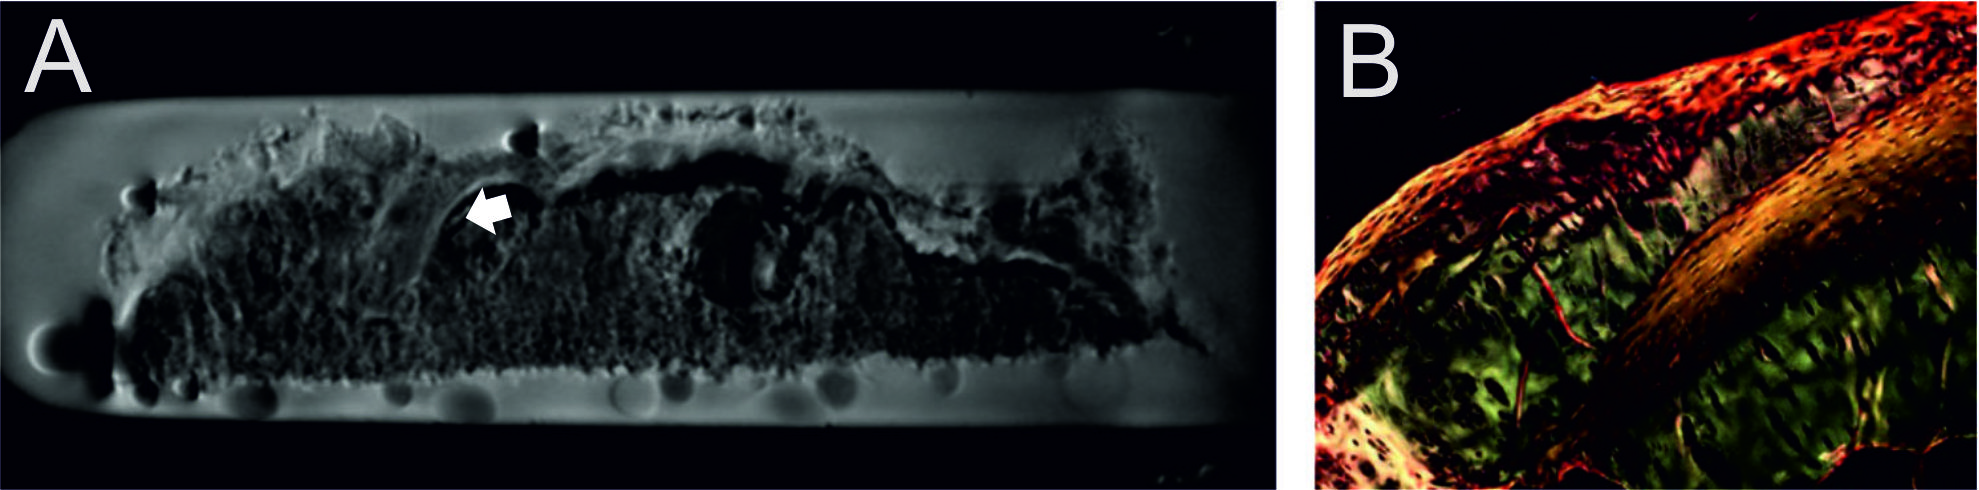
In contrast, late stage osteophyte formation showed a completely disorganized cartilage-bone interface (Fig. 4).
Conclusion
The feasibility of morphological imaging and T2* mapping of the osteochondral junction of the knee with a variable echo time sequence and microscopic resolution has been demonstrated for the first time. The combination of MR microscopy and the vTE sequence seem to be a promising setup for detection of early changes in osteoarthritis.Acknowledgements
No acknowledgement found.References
[1] Keeney M., Pandit A., The osteochondral junction and its repair via bi-phasic tissue engineering scaffolds. Tissue Eng Part B Rev. 2009, 15(1):55-73
[2] Bae et al., UTE MRI of the Osteochondral Junction. Current radiology report 2014; 22:35
[3] Deligianni X. et al., High-resolution Fourier-encoded sub-millisecond echo time musculoskeletal imaging at 3 Tesla and 7 Tesla. Mag. Reson. Med. 2012; 70(5): 1434-1439
[4] Berg A., Potthast P., Starewicz, MR- Microscopy on a human 7T-scanner. Proc. ISMRM/ESMRMB 2010, progr nr. 1048, Stockholm, Sweden, 2010
[5] Samsonov A.A. et al., POCSENSE: POCS-Based Reconstruction for Sensitivity Encoded Magnetic Resonance Imaging. Mag. Reson. Med. 2012; 70(5): 1434-1439
[6] Markwardt CB. Non-linear Least-squares Fitting in IDL with MPFIT. Astronomical Data Analysis. Software and Systems Xviii 2009;411:251-254.
Figures