1532
Six-month follow-up of the patients with the low-grade femoral cartilage lesions using T2 mapping at 3 and 7 Tesla1Department of Biomedical Imaging and Image-Guided Therapy, Medical University of Vienna, Vienna, Austria, 2Department of Imaging Methods, Slovak Academy of Sciences, Institute of Measurement Scinece, Bratislava 4, Slovakia, 3Division of Radiological Physics, University of Basel Hospital, Basel, Switzerland, 4Research Unit of Medical Imaging, Physics and Technology, University of Oulu, Oulu, Finland, 5University Clinic for Trauma Surgery, Medical University of Vienna, Vienna, Austria, 6Novartis Institutes for Biomedical Research, Basel, 7CD Laboratory for Clinical Molecular MR Imaging
Synopsis
Transverse relaxation time (T2) maps were assessed as a potential marker for the long-term follow-up of the patients with cartilage lesions ICRS Grade I-II in four time points (baseline, 8 days, 3 and 6 months). T2 mapping was based on a 3D triple echo steady state imaging sequence delivering high quality high-resolved T2 maps at ultra-high field MRI. The results showed opposite trends of T2 values at 3T (a decrease) and 7T (an increase) over time. The statistically significant difference was found in case of deep zone of the cartilage lesion at 3T. T2 mapping could be used in the future as a good alternative to cartilage biopsies in clinical trials on new therapies aimed at cartilage regeneration.
Introduction:
Cartilage degeneration is a major source of pain and disability in Western societies and there is a strong demand for a noninvasive tool that allows for early diagnosis and monitoring. Biochemical changes of the extracellular matrix often precede the morphological changes(1). Quantitative MRI has shown a great potential to non-invasively detect such changes, especially T2 mapping which is expected to be sensitive to collagen matrix anisotropy/organization and water content. Changes in articular cartilage during OA or in acute lesions result in an increased hydrodynamic fluid pressure and increased stress throughout the matrix. This leads to the proteoglycan-collagen matrix degeneration and cartilage tissue loss(2). In this study, we investigated T2 maps as a possible marker for following-up the patients after cartilage injury.Methods
Eleven patients (mean age, 48.4/9.6 years; 5 males/6 females) were imaged. All of them had confirmed femoral cartilage defect(s) in the knee joint (ICRS Grade I or II). Cartilage T2 maps were acquired for each of these patients on two MR scanners: 3T Trio (Siemens, Erlangen, Germany) and 7T whole-body investigational MR scanner (Siemens Healthcare, Germany). The measurements were repeated four times (baseline (B), 8 days (8D), 3 months (3M) and 6 months (6M)). T2 relaxation times were determined using a 3D-Triple Echo Steady State sequence (3D-TESS)(3) with the following parameters: TR/TE 11.14/5.06 ms; FA 15°; TA 3:48 min, voxel size 0.25x0.25x3 mm. For image analysis, regions of interest (ROIs) were defined in 3D-double echo steady-state (DESS) morphological images in the region suspicious for a cartilage defect and in a region of normal-appearing cartilage (weight bearing and non-weight bearing region) in both deep and superficial cartilage layers. ROIs were transferred onto T2 maps. Student’s t-test was used to determine the differences in T2 in various time points at different field strength. A P-value<0.05 was considered statistically significant.Results
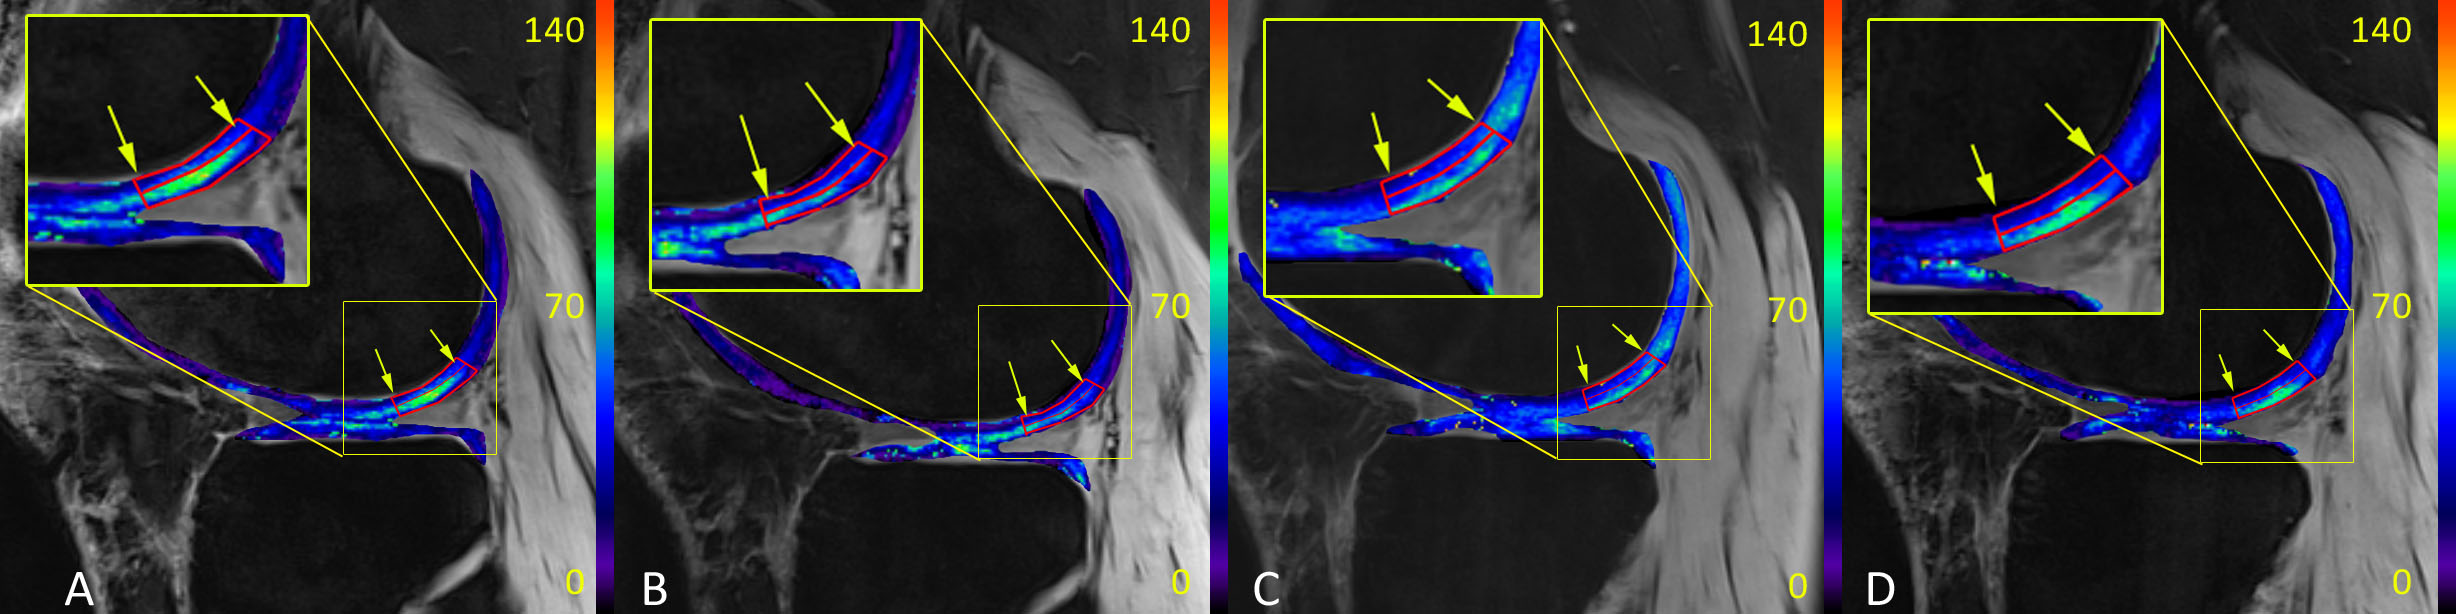
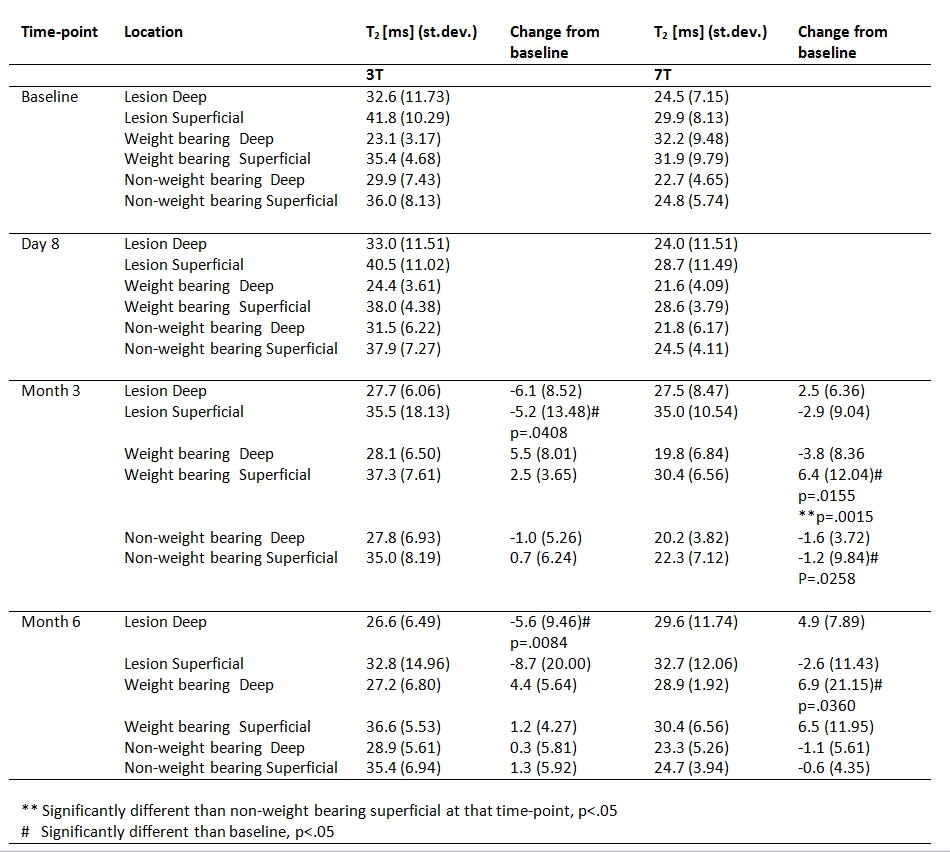
Illustrative T2 maps with the ROI position are shown on Fig. 1. The following statistical significances were found (mean at 3T (value (standard deviation)) are in ms) lesion superficial (B → 41.8 (10.29) vs 3M → 35.5 (18.13), p=.0408) and lesion deep (B →32.6 (11.73) vs 6M → 26.6 (6.49), p=.0084). At 7T, the following statistical significances were found: weight bearing superficial (B → 31.9 (9.79) vs 3M → 30.4 (6.56), p=.0155), non-weight bearing superficial (B → 24.8 (5.74) vs 3M → 22.3 (7.12), p=.0258) and weight bearing deep (B → 32.2 (9.48) vs 3M → 28.9 (1.92), p=.0360). Unlike at 3T, the T2 values of the lesion at 7T increased over time; however, without statistical significance: lesion superficial (B → 29.9 (8.13) vs 6M →32.7 (12.06)) and lesion deep (B → 24.5 (7.15) vs 6M 29.6 (11.74)). All values are listed in the Table 1.Discussion
The results of this study showed that the collagen network disorganization and/or water content can be detected in patients with low-grade lesions and followed-up over time. Morphologically, no change in lesion grade was found for all but one patients (worsening to Grade II/III) in the time course. Interestingly, the trends of the T2 change in time were not the same at 3T and 7T. A possible explanation of this result could be that 3D-TESS is sensitive to the short T2 relaxation component which is present at 3T, but it is it decayed very fast at 7T due to chemical exchange contribution and diffusion in non-homogeneous magnetic field. The short component is more likely linked to water with its motion restricted by collagen network, and the long component is rather reflecting bulk water. Although 3D-TESS T2 mapping is B1 insensitive by its nature, in some cases of extreme B1 (and/or B0) imperfections, the signal drops so much that the reconstruction did not iterate to reasonable T2 values. However, these cases were rather rare and did not affect the overall evaluation.Conclusion
T2 mapping with 3D-TESS enables monitoring of changes in low-grade cartilage lesions and follow-up of patients over time also at ultra-high field MRI. T2 might be a valuable marker for monitoring cartilage development after regenerative therapy, as it may allow differentiation between the early formation of hyaline and fibrotic cartilage without resorting to serial biopsies.Acknowledgements
This work was supported by the Slovak Research and Development Agency: APVV-15-0029, Grant Agency of the Slovak Academy of Sciences (VEGA 2/0001/17) and Austrian Science Fund (FWF) KLI541-B30.References
[1].Choi JA et al., MR Imaging of articular cartilage physiology. Magn. Reson Imaging Clin N Am 2011;19:249-282
[2].Borthakur et al., Sodium and T1rho MRI for molecular and diagnostic imaging of articular cartilage. NMR Biomed 2006; 19:781-821
[3].Heule R. et al. Triple echo steady-state (TESS) relaxometry, Magnetic Resonance in Medicine 2004; 71(1) 230–237
Figures