1528
Acceleration and Artifact Suppression in Selective TOF MRA with Sampling Reduction1Healthcare Business Unit, Hitachi, Ltd., Tokyo, Japan
Synopsis
We confirmed that 2D beam excitation presaturation-pulse (hereafter BeamSat pulse) can saturate the vessels selectively in brain. Although BeamSat can visualize hemodynamics, the scan time is long (about 5 minutes) because the based sequence is 3D TOF. The single thick slice 2D TOF was used for based sequence to reduce the scan time and the ks offset was added to saturate background brain signal. We showed that this method can accelerate the scan time to 0.6-0.8 seconds without the notable loss of vessel visualization.
Introduction
2D beam excitation presaturation-pulse (hereafter BeamSat pulse) was applied to 3D TOF. And it was able to saturate the carotid artery selectively and visualized hemodynamics in brain such as collaterals via the circle of Willis in patients with the carotid stenosis1-2 (hereafter selective TOF MRA). Although selective TOF MRA could visualize hemodynamics, the scan time was long (about 5 minutes). The long scan time causes miss registration and the extension of examination time. The purpose of this study was to accelerate the scan time of selective MRA. In previous study, data acquisition of selective TOF MRA was 3D, on the other hand usual DSA was 2D projection data1. It is supposed that 2D data is enough to confirm the hemodynamics. In this study, single thick slice 2D TOF was applied to accelerate the scan time. In single thick slice 2D image, background signal was visualized not only the vessels, and it caused the loss of vessel visualization3, so k-space sampling was optimized to avoid the loss of vessel visualization.Materials and Methods
Imaging sequence
BeamSat
pulse was set prior to 2D TOF sequence in each TR to suppress the inflow signal
from the internal carotid artery (ICA) (Figure 1). To suppress ICA selectively,
BeamSat pulse was set in the petrous portion of ICA (Figure 2a-b). The number
of slice was one, and slice selective region was from MCA-M1 to M4 (Figure 2a).
The ks offset gradient was added in slice direction to select the
targeted k-space (Figure 1). Other typical scan parameters: TR/TE = 30.3 ms/6.9ms,
imaging matrix 512 / 320, Thickness = 50 [mm], rectFOV = 85%, acceleration
factor = 2.0, scan time = 4.1 [sec]. The control 2D TOF MRA without BeamSat pulse was obtained
using same scan parameter and ks offset gradient. The subtracted
image of control and 2D TOF with BeamSat was obtained in each ks
offset (Figure 3). A 1.5T MRI scanner and 8 channel Head coil were used for all
imaging. A
healthy volunteer was imaged. We explained the purpose and significance of this
study to healthy volunteers and obtained written consent.
Optimization of ks offset and kp sampling reduction
We optimized the ks offset and acquiring phase data region (Wkp). First, the ks offset was changed from 0 [m-1] to 400 [m-1]. The visibility of blood vessels and residual brain signal was evaluated by subtracted images. Second, optimized ks was used, and Wkp was reduced from 10% to 25% with a focus on kp = 0 [m-1]. The visibility of blood vessels was evaluated by subtracted images.
Results and Discussion
Optimization of ks offset
In ks = 0 [m-1] (Figure 4a), the residual brain signal was visualized, and blood vessels were not visualized clearly, so simple subtraction was not enough to saturate the background brain signal. In ks = 60 [m-1], blood vessels were visualized clearly without residual brain signal (Figure 4b). When the general size of brain and vessels (diameter) were 50-100 [mm] and 1-3 [mm], main bandwidth of brain and vessels were 20-40 [m-1] and 667-2000 [m-1] in the k-space (Figure 5). It is supposed that optimal ks was minimum value more than 40 [m-1]. The actual optimized ks offset value (60 [m-1]) was comparable with that. The scan time was accelerated to 4.1 [sec]. Although it was shorter than conventional selective TOF MRA (5 minutes), 4.1 [sec] was long to visualize the time-dependent change like a DSA.
Optimization of kp sampling reduction
The blood vessels were not visualized clearly in the image of Wkp = 10%, and these were visualized in the image of Wkp = 15-20% (Figure 4c-f). Scan time of Wkp = 15-20% was accelerated to 0.6-0.8 [sec], and it was not so long for time frame. In order to accelerate the scan time more, each frame should be obtained individually. The delay can be controlled by changing the time applying BeamSat pulse continuously before the data acquisition. When each frame was visualized individually, the time to remove the saturated blood was needed after the data acquisition. The removal time is almost 2 [sec]. When maximum delay time is 2 sec, the time of each frame acquisition is 4.6-4.8 [sec] that is sum of delay time (2 [sec]) and acquisition time (0.6-0.8 [sec]) and removal time (2 [sec]). It may be useful for multi-phase scanning.
Conclusion
The selective TOF MRA was accelerated to 0.6-0.8 [sec] using the ks offset and kp sampling reduction without notable loss of vessel visualization. The usefulness of the developed technique was demonstrated by applying it to volunteer.Acknowledgements
No acknowledgement found.References
1. Nishihara T et al. Proc In 20th ISMRM, Selective TOF MRA using Beam Saturation pulse. 2012;2497.
2. Ito K, Sasaki M et al. Noninvasive Evaluation of Collateral Blood Flow through Circle of Willis in Cervical Carotid Stenosis Using Selective Magnetic Resonance Angiography. J Stroke Cerebrovasc Dis. 2014;23(5):1019-23.
3. Sodickson A, Mortele KJ, Barish MA, et al. Threedimensional fast-recovery fast spin -echo MRCP: comparison with two-dimensional single -shot fast spin-echo techniques. Radiology 2006;238:549-559.
Figures
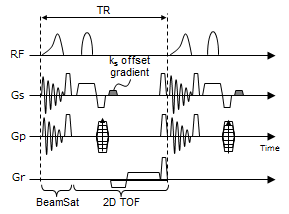
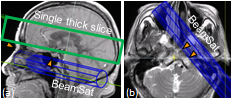
Figure 2 Position of BeamSat pulse and slice selective region
(a) SAG, (b) AX
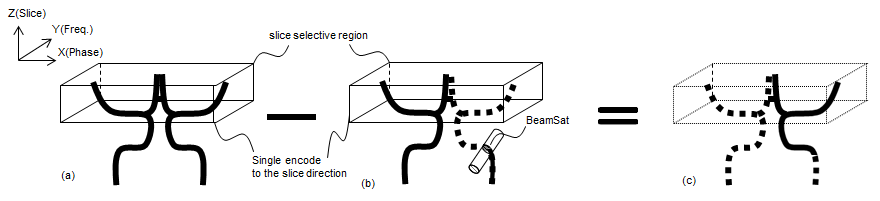
Figure 3 Diagram of data processing
(a) Controol single thick slice 2D TOF, (b) Single thick slice 2D TOF with BeamSat, (c) Subtracted image ((a) – (b))
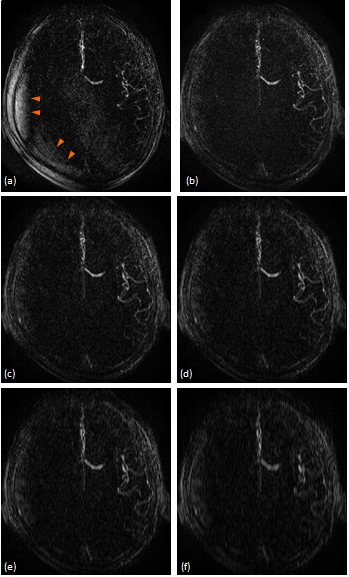
Figure 4 Subtracted image
(a) ks = 0 [m-1], Wkp = 100% (4.1 sec), (b) ks = 60 [m-1], Wkp = 100% (4.1 sec), (c) ks = 60 [m-1], Wkp = 25% (1.0 sec), (d) ks = 60 [m-1], Wkp = 20% (0.8 sec), (e) ks = 60 [m-1], Wkp = 15% (0.6 sec), (f) ks = 60 [m-1], Wkp = 10% (0.4 sec)
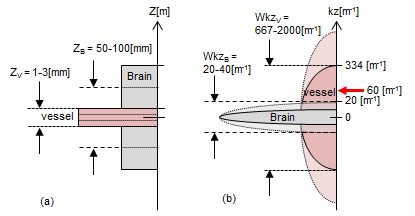
Figure 5 Diagram of main bandwidth in k-space
(a) Real space : The general size (diameter) of vessels (ZV) and brain (ZB) were 1-3 [mm] amd 50-100 [mm]. (b) k-space : The main bandwidth of vessels (WkzV) was 667-2000 [m-1] and brain’s (WkzB) was 20-40 [m-1]. The actual optimized ks offset value (60 [m-1]) was out of WkzB and within WkzV.