1527
Selective Channel Combination of 3D Phase Offset Corrected 7T MRI Phase Images1Centre for Advanced Imaging, University of Queensland, Brisbane, Australia, 2Siemens Healthcare Australia Pty. Ltd., Australia
Synopsis
A number of MRI applications rely on accurate phase images. At ultra-high field, the limitations of various processing techniques and the absence of a volume reference coil make the combination of multi-channel signal phase challenging. We propose a method which combines phase offset corrected signal phase data across a selection of channels. We evaluated method performance at two different gradient recalled echo MRI echo times. We qualitatively and quantitatively studied the combined phase quality in distinct brain regions. We found that using a subset of channels leads to improved phase images than when all channels are used in the combination.
Introduction
The rapid increase in the development of MRI phase imaging at ultra-high field can be attributed to improved grey-white matter contrast and to advances in frequency shift and quantitative susceptibility mapping. These methods rely on phase images and have enabled studies on iron deposition, calcifications and contrast agent distribution in the brain.1-4 A standard method for multi-channel signal phase combination in systems that do not have a dedicated body coil or volume reference coil is lacking.1,5 A number of methods have been proposed to combine phase data, and we have shown that phase images can be improved by using only a selection of channel data.1,2,4 The noise in phase images has been shown to deviate from the Gaussian distribution when signal-to-noise ratio is low in signal phase, implying that the use of magnitude images for the creation of sensitivity maps for phase data combination may not lead to noise optimal results.4 To be able to standardise multi-channel phase combination at ultra-high field, we propose the use of 3D phase offset corrected MRI phase images and combining them in a selective manner.1,4Methods
A multi-echo 3D GRE-MRI non-flow compensated data was collected on a 7T ultra-high field whole-body MRI research scanner (Siemens Healthcare, Erlangen, Germany) with a 32 channel head coil (Nova Medical, Wilmington, USA) using the following parameters: TE1 = 4.98ms, TE2 = 8.11ms and TE5 = 17.5ms, TR = 48ms, flip angle = 15o, voxel size = 0.75mm $$$\times$$$ 0.75mm $$$\times$$$ 0.75mm and matrix size = 280 $$$\times$$$ 242 $$$\times$$$ 160.
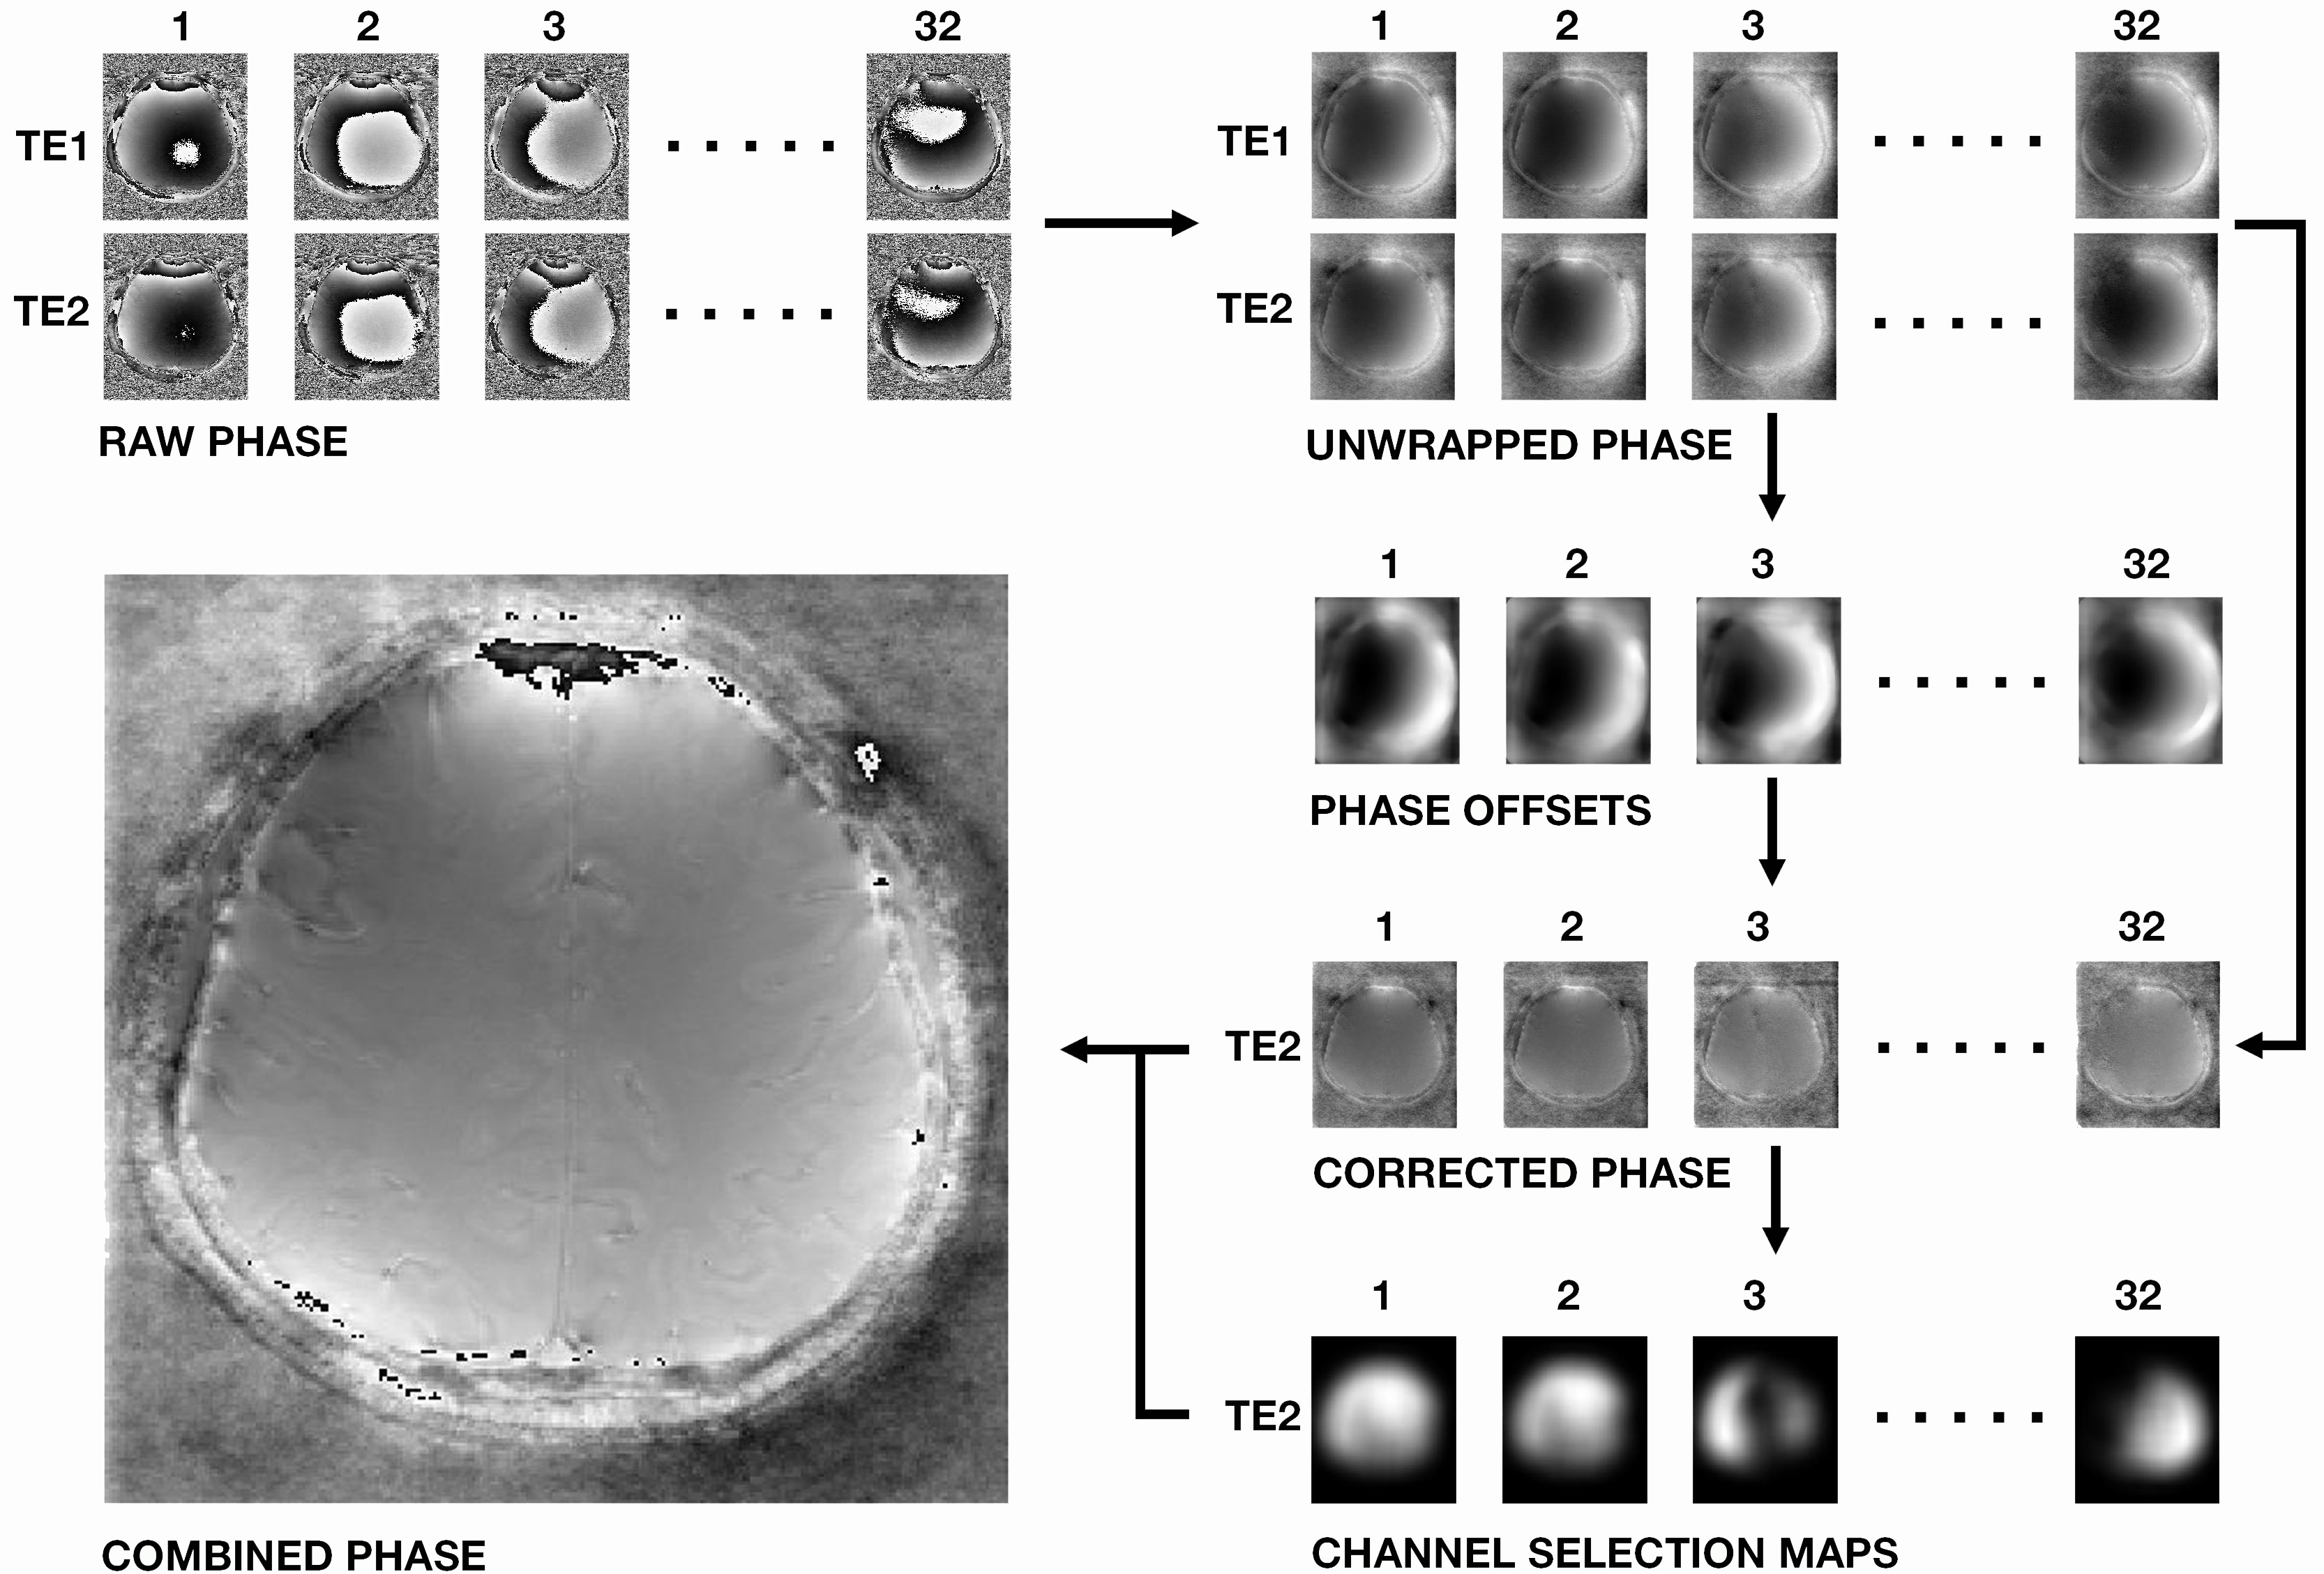
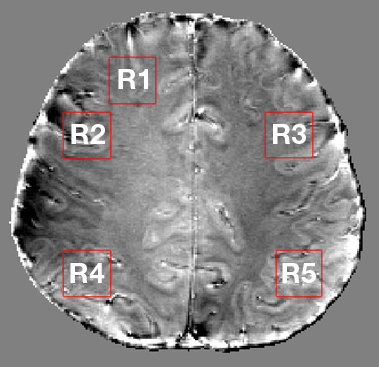
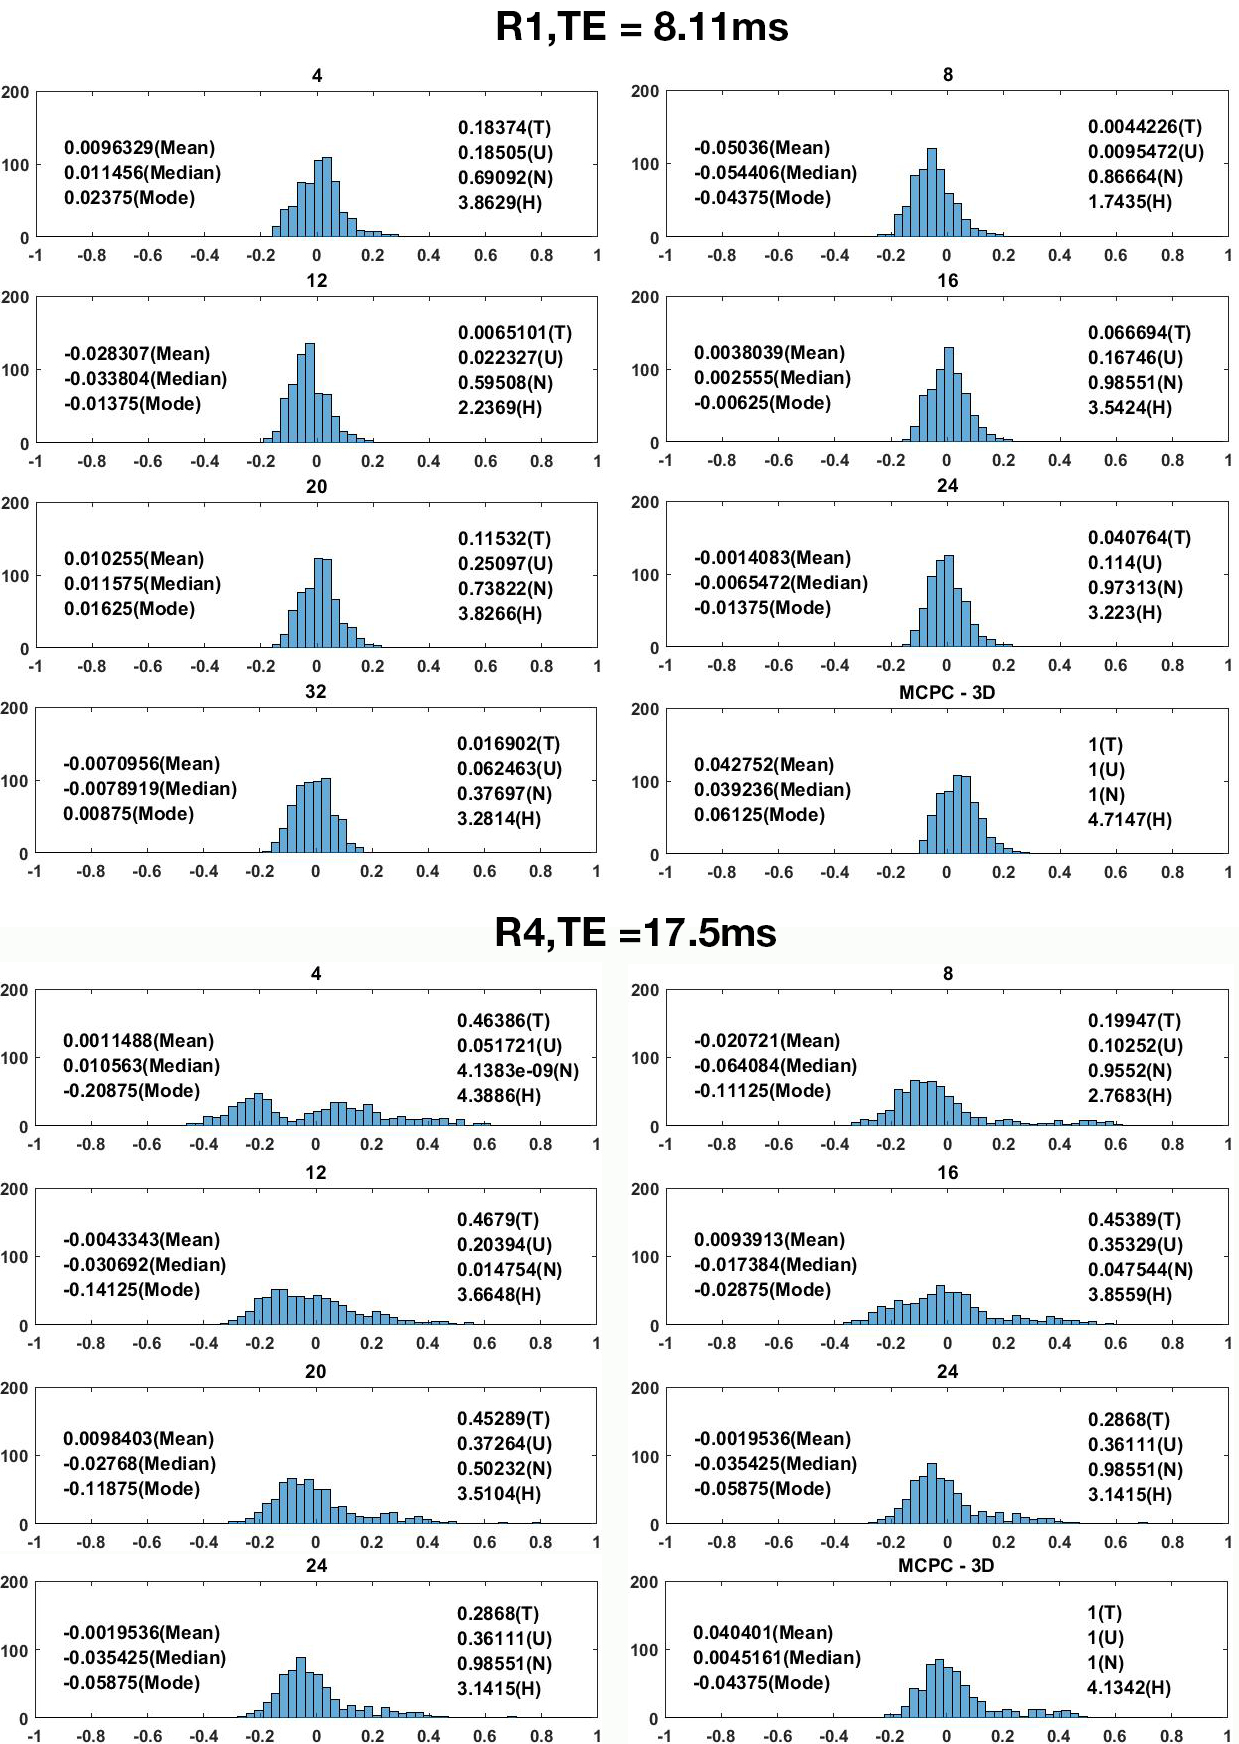
Fig 1 shows the selective combine pipeline. Individual channel 3D phase offset maps were computed as described for MCPC-3D, and the MCPC-3D method was used for comparison wherein all channels are magnitude weighted and combined to generate a combined phase image.1 The median filter size in the 3D phase offset computation was set to 15 $$$\times$$$ 15 $$$\times$$$ 15. For selective combine, individual channel phases were subtracted to obtain phase noise images, their standard deviation was calculated, and the result was Gaussian filtered to obtain matrices on which channel selection was based.4 The TE2 (see Fig 1) voxel phase was averaged based on the channel ranking provided by channel selection matrix entries. Scripts were implemented in MATLAB®. Tissue phase maps were obtained from the combined phase images using FSL brain masks with iHARPERELLA in STI Suite.6,7 We performed a region-by-region analysis, and regions are shown in Fig 2. We tested for (T) difference of means using a t-test, (U) changes in distribution mean and shape using the Kolmogorov-Smirnov test, (N) changes in shape only using the normalised Kolmogorov-Smirnov test and evaluated (H) entropy. The p-values provided for each test are with respect to the MCPC-3D result. We expect a lower value for entropy to correspond to a lower level of image noise.
Results
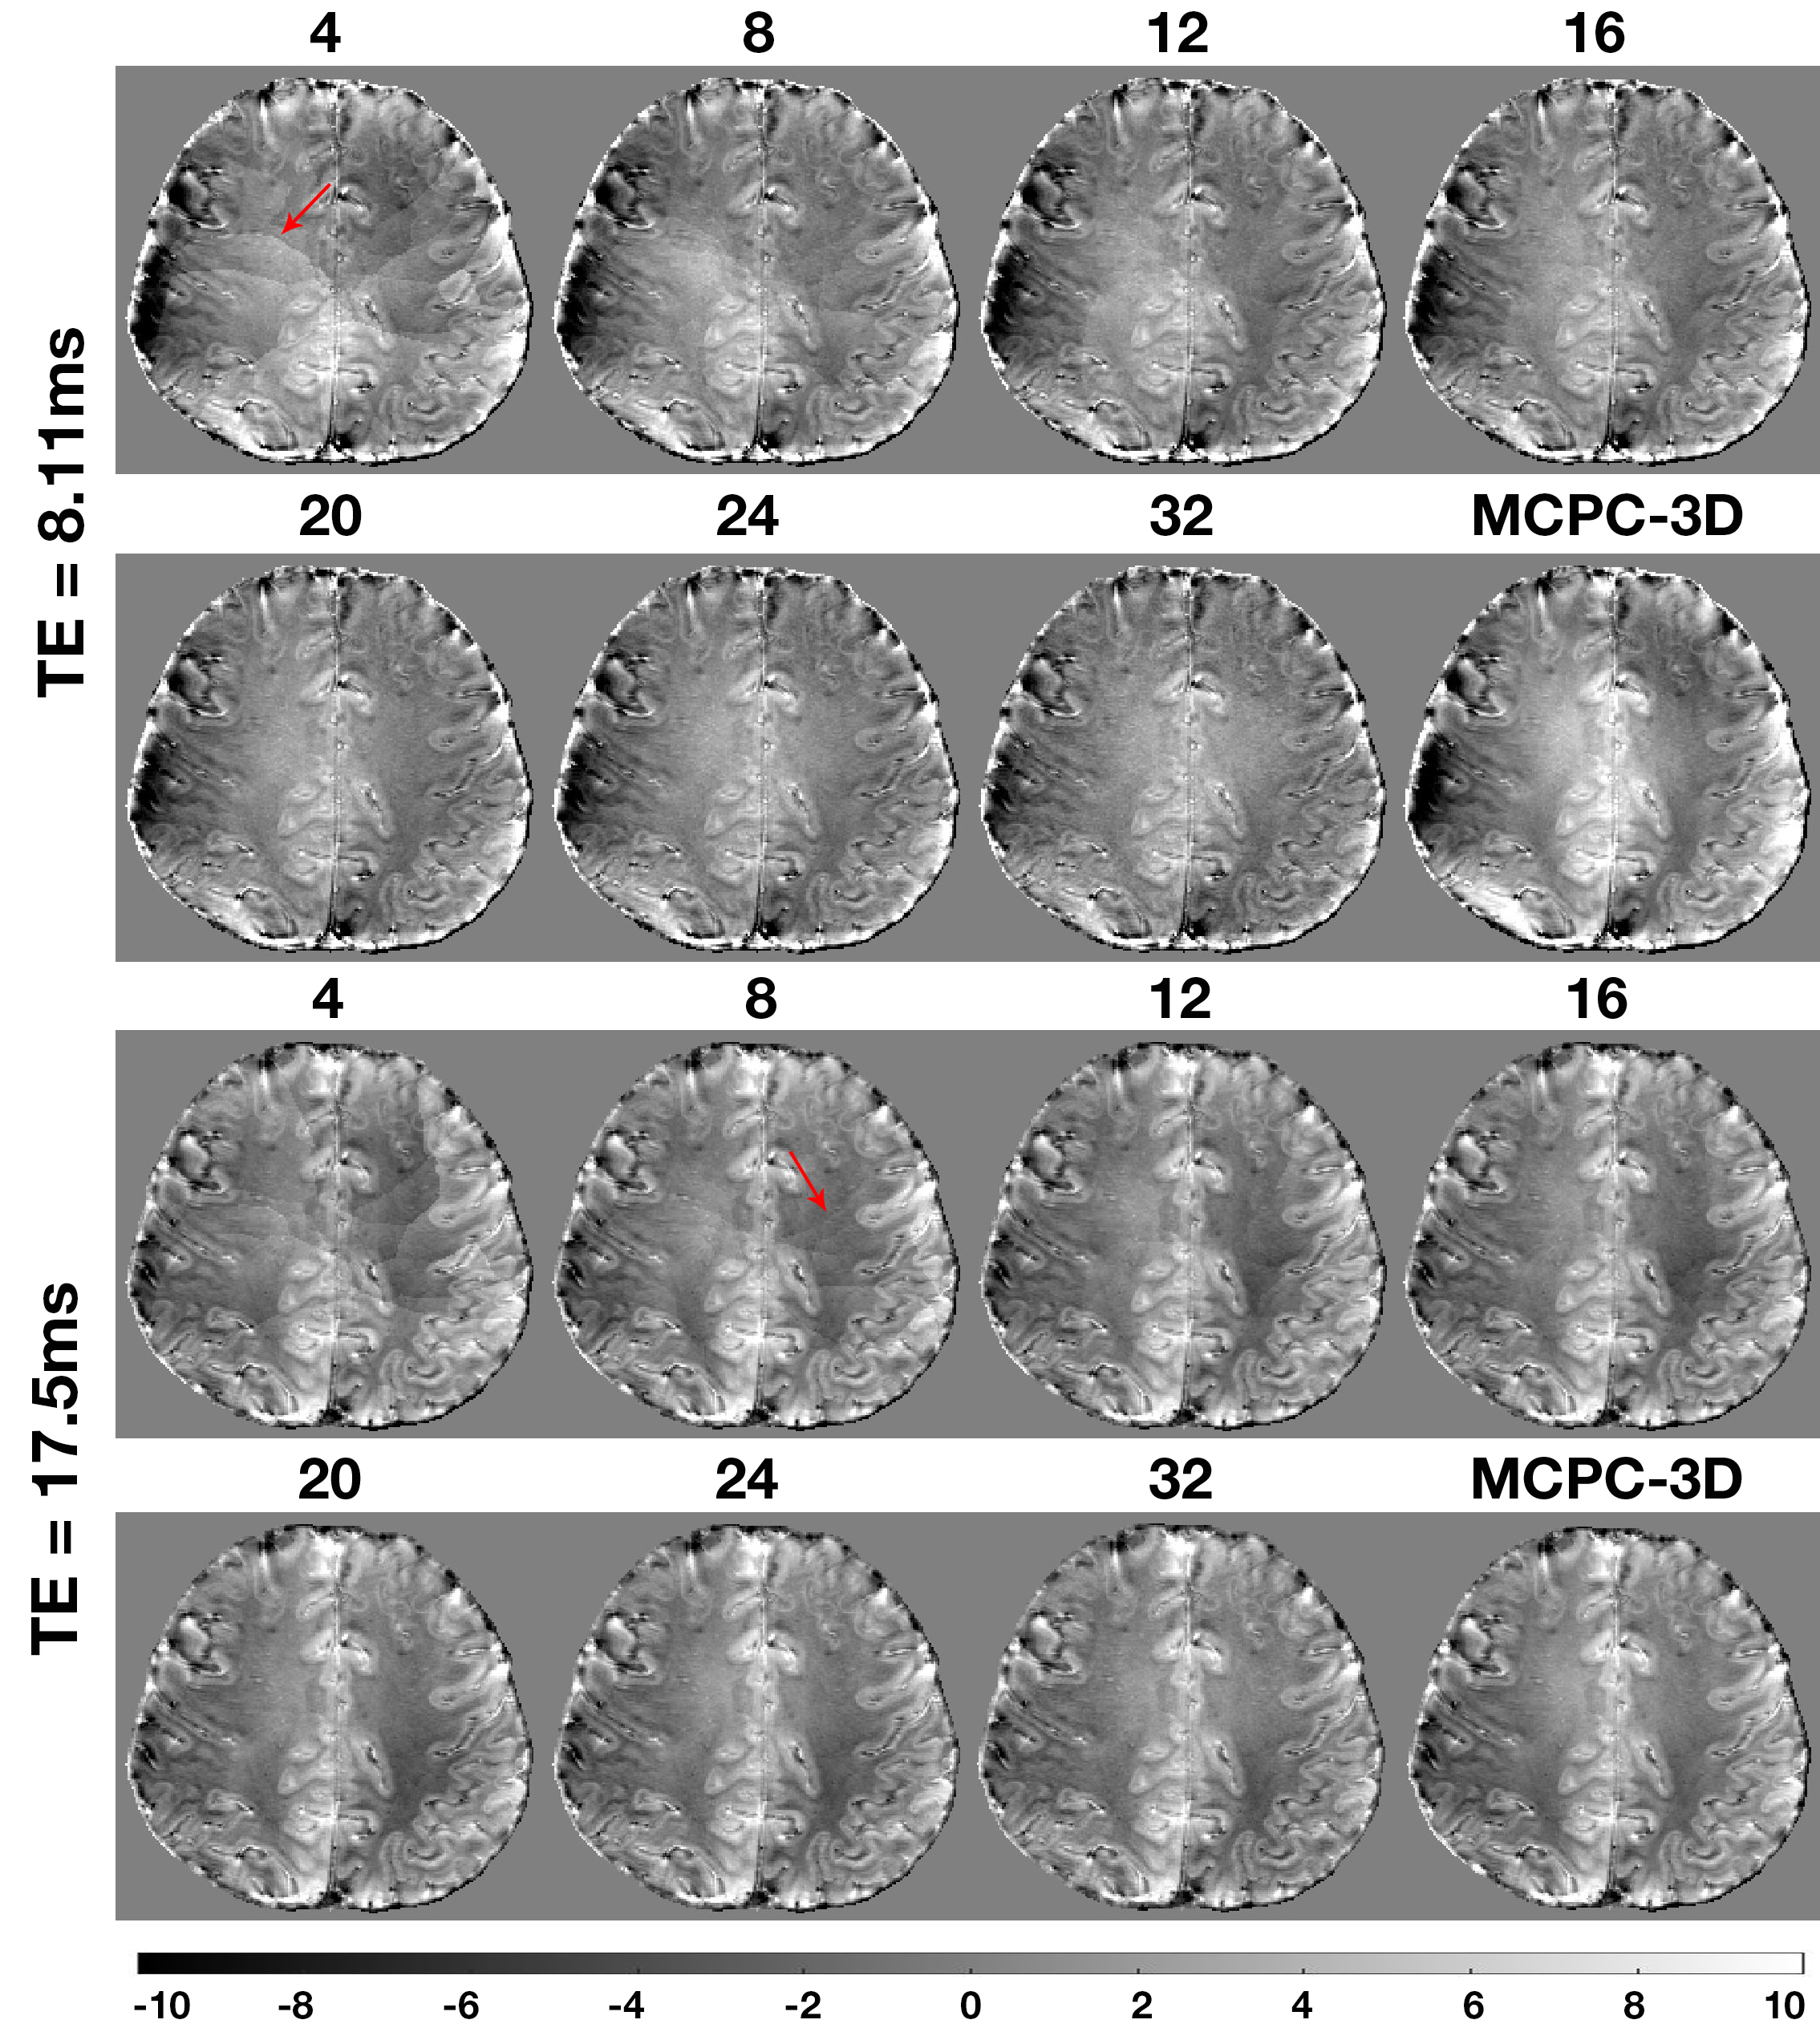
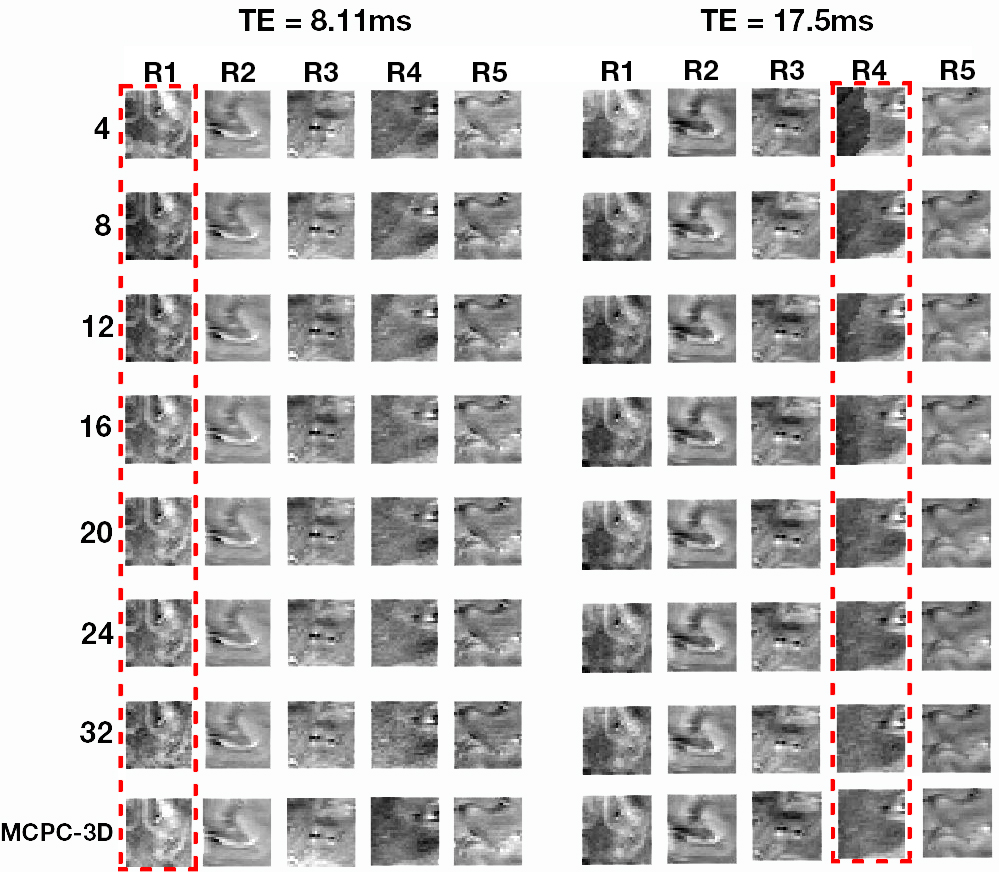
In Fig 3 the selectively combined phase images are provided alongside the result obtained using MCPC-3D. Fig 4 shows qualitative images for each of the regions highlighted in Fig 2 are shown. In Fig 5 we present quantitative results wherein statistics are provided for differences between MCPC-3D and selective combine.Discussion
The 3D phase offset correction step in Fig 1 results in a combined phase image which has artefacts at locations depicted by the arrow. These lines disappear as the number of channels used in the combined phase image increases. We attribute the presence of these lines to not having perfect correspondence between 3D offset corrected phase images, the effect of which averages out with increased number of channels. Our results depicted in Fig 4 imply that selective combine can achieve improvements in image quality using less than the total number of channels. The entropy measure indicates that noise does not necessarily decrease by increasing the number of channels used in the combined phase image. Unlike in MCPC-3D, selective combine does not use magnitude signal weighting of the individual 3D phase offset corrected images prior to combining them. Based on these results, it appears magnitude weighting may not sufficiently supress regions of high phase noise (compare 32 channel result to MCPC-3D in Fig 5).Conclusion
We have shown qualitatively and quantitatively that the use of a subset of channels can result in combined phase images with improved image quality. Improvement in phase image quality may directly result in an improvement in frequency shift and quantitative susceptibility maps.Acknowledgements
The authors acknowledge the facilities of the National Imaging Facility at the Centre for Advanced Imaging, University of Queensland. We also acknowledge funding from the Australian Research Council (DP140103593).References
1. Robinson S, Grabner G, Witoszynskyj S, Trattnig S. Combining phase images from multi-channel RF coils using 3D phase offset maps derived from a dual-echo scan. Magnetic resonance in medicine. 2011 Jun 1;65(6):1638-48.
2. Parker DL, Payne A, Todd N, Hadley JR. Phase reconstruction from multiple coil data using a virtual reference coil. Magnetic resonance in medicine. 2014 Aug 1;72(2):563-9.
3. Sood S, Urriola J, Reutens D, O’Brien K, Bollmann S, Barth M, Vegh V. Echo time-dependent quantitative susceptibility mapping contains information on tissue properties. Magnetic Resonance in Medicine. 2016 May 1.
4. Vegh V, O'Brien K, Barth M, Reutens DC. Selective channel combination of MRI signal phase. Magnetic resonance in medicine. 2015 Nov 1.
5. Robinson SD, Bredies K, Khabipova D, Dymerska B, Marques JP, Schweser F. An illustrated comparison of processing methods for MR phase imaging and QSM: combining array coil signals and phase unwrapping. NMR in Biomedicine. 2016 Jan 1.
6. Smith SM, Jenkinson M, Woolrich MW, Beckmann CF, Behrens TE, Johansen-Berg H, Bannister PR, De Luca M, Drobnjak I, Flitney DE, Niazy RK. Advances in functional and structural MR image analysis and implementation as FSL. Neuroimage. 2004 Dec 31;23:S208-19.
7. Li W, Avram AV, Wu B, Xiao X, Liu C. Integrated Laplacian-based phase unwrapping and background phase removal for quantitative susceptibility mapping. NMR in Biomedicine. 2014;27(2): 219-27.
Figures