1526
An improved image-based method for field inhomogeneity map in distorted brain EPI image1Department of Radiological Technology, Faculty of Health Sciences, Hokkaido University of Science, Sapporo, Japan, 2Department of Radiology, Graduate School of Medical and Dental Sciences, Kagoshima University, Kagoshima, Japan
Synopsis
To correct the distortion in EPI due to field inhomogeneity, an image-based method for estimating the field map from the distorted EPI image has been proposed. However, this method suffers from long computation times. Our purpose was to improve an image-based method in terms of the computation time. Whereas the previous method synthesized EPI image in k-space requiring a lot of execution of FFT, our method synthesized EPI image in the image-domain. Our method reduced the computation time in the almost same NRMSE in previous method. Our results suggest that our improved method was able to perform a reasonable estimation of the field map.
INTRODUCTION
Echo-planar imaging (EPI) is prone to spatial distortion due to magnetic field inhomogeneity. To correct the spatial distortion in EPI image, many methods have been proposed. Among the distortion correction methods, the most commonly used method is the field map based approach, which is computed from two images acquired at slightly different echo times.1 Although conventional field map methods assume a static field inhomogeneity, the obtained field map may be invalid for distortion correction in EPI images due to the subject’s position changes between field map acquisition and EPI studies.2 An image-based method for estimating the field inhomogeneity map from the distorted EPI image has been proposed, which does not require additional acquisitions to measure the field map.3 However, this method suffers from long computation times. In this study, our purpose was to improve an image-based method for the field inhomogeneity map from the distorted EPI image using T1 weighted image (T1WI).METHODS
Our basic idea to estimate the field inhomogeneity map in EPI is to reproduce the distorted EPI image based on MR imaging physics. We used a T1WI as reference image, whose histogram was changed so as to match the histogram of measured EPI image using histogram specification.4 T2 value in each voxel was estimated from the reference image. Our method synthesizes the distorted image to match the measured EPI image through the generation process of EPI image according to a single-shot EPI k-space trajectory and field inhomogeneity using an iterative conjugate gradient algorithm. In previous method, the computation time was long, because the EPI images were synthesized in k-space and FFT was executed more than a dozen times in each iteration3. To reduce the computation time, our method synthesized EPI image in the image-domain. To synthesize the distorted EPI image, an MR signal was calculated on a voxel-by-voxel basis using the estimated T2 value and field inhomogeneity ΔB. The MR signal in the presence of field inhomogeneity ΔB is given by
$$$I(x,y,\Delta B)=\sum_{u=0}^{M-1} \sum_{v=0}^{N-1} A(u,v)\cdot exp(-\frac{TEeff}{T2(u,v)})\cdot sinc (\pi (x-u-\frac{\Delta B(u,v)}{\Delta x \cdot Gx})) \cdot sinc (\pi (y-v-\frac{\Delta B(u,v)}{\Delta y \cdot Gy}))$$$
where Δx and Δy are pixel spacing in x and y direction, respectively, Gx is the gradient in the x direction, and Gy = Gbτ /Δty (Gb is the average blip gradient in the y direction during the duration τ, and Δty is the time intervals between adjacent points in the phase-encoding directions). The field inhomogeneity map ΔB was estimated by minimizing the least-square cost function using the synthesized EPI image and the measured EPI image. The spin echo (SE) EPI and T1WI data of a healthy volunteer were acquired using a 1.5-tesla clinical scanner (Magnetom, Symphony, Siemens) with an 8-channel phased-array coil. The SE EPI data was obtained by a single-shot EPI pulse sequence (FOV: 230 mm, TR=8600ms, TE=119ms, 128×128 in-plane resolution, 3 mm thickness). Three dimensional T1WI covering the same area in EPI was obtained by MPRAGE sequence (FOV: 230 mm, TR=2090ms, TE=3.93ms, TI=1100ms, FA=15°, 256×256 in-plane resolution, 1 mm thickness). To evaluate the performance of both methods, we used the normalized root mean square error (NRMSE) between the measured EPI and synthesized EPI by those methods.
RESULTS and DISCUSSION
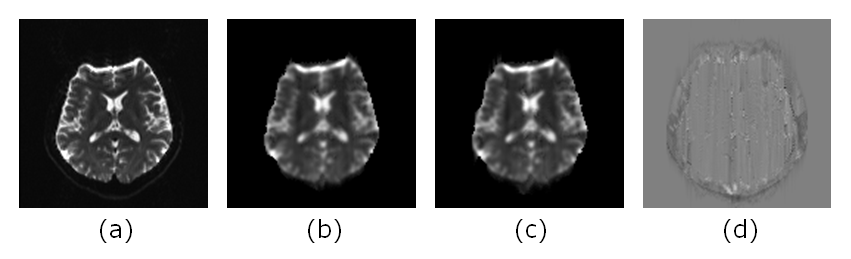
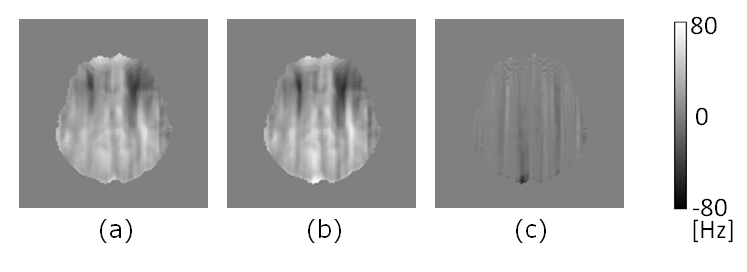
Figure 1(a), (b), (c) and (d) show the measured EPI image from a healthy volunteer, the synthesized EPI image by previous method3, the synthesized EPI image by our method, and the difference image between the images obtained by both methods, respectively. The values of the NRMSE between the measured EPI image and the synthesized EPI image by previous method and our method are 0.11 and 0.12, respectively. Figure 2(a), (b) and (c) show the estimated field inhomogeneity map by previous method and our method, and the difference image between them. The computation times in previous method and our method are 62939.8sec and 8116.9sec, respectively. Our method reduced the computation time drastically in the almost same NRMSE in previous method.CONCLUSION
We have improved an image-based method for the field inhomogeneity map from the distorted EPI image in terms of the computation time. Our results suggest that our improved method was able to perform a reasonable estimation of the field inhomogeneity map which can be used for distortion correction in EPI images.Acknowledgements
This work was supported by Japan Society for the Promotion of Science (JSPS) KAKENHI Grant Number 15K08695 and 26293278.References
1. Jezzard P, Balaban RS. 1995. Correction for geometric distortion in echo planar images from B0 field variations. Magn Reson Med 34:65-73.
2. Hutton C, Bork A, Josephs O, et al. 2002. Image distortion correction in fMRI: A quantitative evaluation. Neuroimage 16:217-240.
3. Kumazawa S, Yoshiura T, Honda H. 2015. Image-based estimation method for field inhomogeneity in brain echo-planar images with geometric distortion using k-space textures. Concept Magn Reson B. 45:142-152.
4. Coltuc D, Bolon P, Chassery JM. 2006. Exact histogram specification. IEEE Trans Image Process. 15:1143-1152.
Figures