1521
k-t Rank Separation Reconstruction for non-Cartesian parallel fMRI1Department of Radiology, Medical Physics, Medical Center - University of Freiburg, Freiburg, Germany
Synopsis
Low-rank sparse (L-S)-reconstruction has been successfully applied to k-t-accelerated applications like cardiac cine imaging. We propose a novel way of k-t rank separation for the reconstruction of non-Cartesian parallel fMRI. Instead of reconstructing the fMRI images separately, the proposed method reconstructs images jointly. This method extracts temporal signal variation information from k-t space directly, thus exactly preserving dynamic information. The results show a higher dynamic signal recovery rate and shorter reconstruction time.
Purpose
To develop a novel method for ultra-fast functional MRI reconstruction which enables more exact dynamic signal recovery.Introduction
Although the BOLD signal in fMRI varies slowly and smoothly in theory, complex brain activity and physiological noise lead to pronounced signal changes. Ultra-fast fMRI techniques can provide an adequate temporal sampling of such rapid fluctuations. Non-Cartesian parallel imaging (e.g. MREG1) is a promising strategy for fMRI because of the efficient k-space coverage that allows very high acceleration factors. However, it is a challenge to reconstruct high-quality images since the reconstruction is no longer straightforward and off-resonance artifacts are difficult to correct2.
Since the final goal of fMRI is to capture dynamic information, we suggest focusing on recovering dynamic signal variations rather than reconstructing individual time frames. In traditional image reconstruction, fMRI images are reconstructed separately (referred later as “separated-recon”), so that dynamic signal recovery strongly depends on the quality of individual images. The k-t rank separation reconstruction (k-t RSR) proposed here is based on extracting temporal basis functions from k-t space directly by singular value decomposition (SVD). The corresponding spatial basis functions, which are usually sparse at high ranks, can then be reconstructed more rapidly and more accurately. This joint k-t reconstruction concept is especially suited for fast imaging and allows precise and fast dynamic signal recovery.
Theory
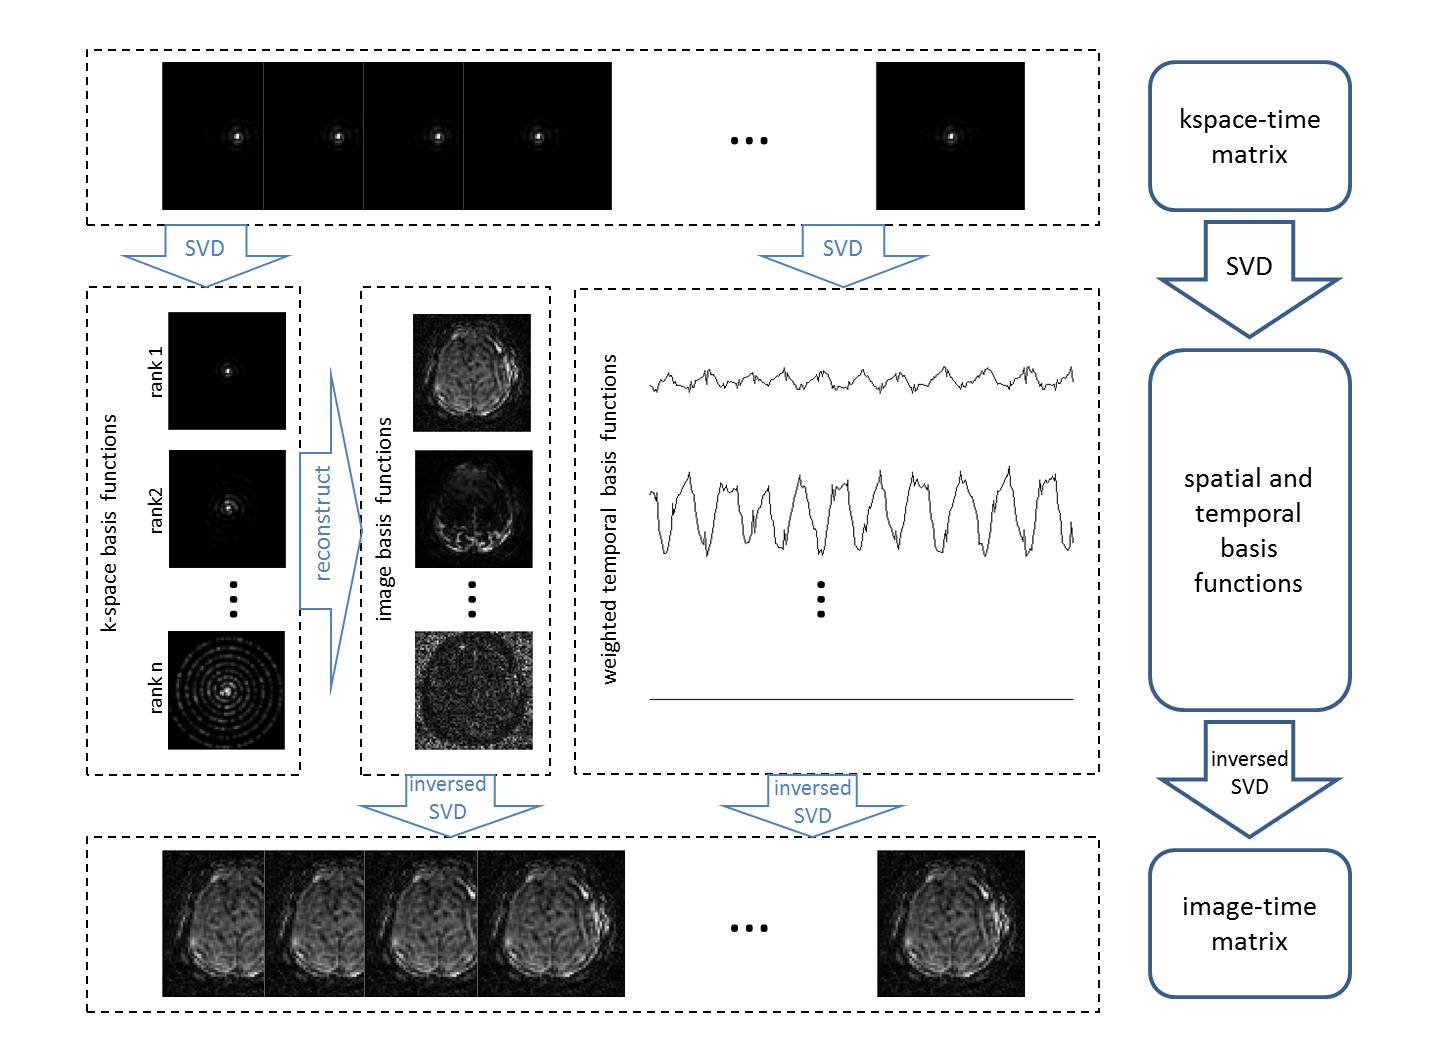
The k-t RSR method starts by rearranging the acquired k-space datasets in a density-compensated 2d k-t matrix $$$s({\bf k},t)$$$. Applying SVD to $$$s({\bf k},t)$$$: $$s({\bf k},t)=\sum_{l=1}^n v_{l}(t)\xi_{l}u_{l}({\bf k})$$where, $$$\it l$$$ is the rank, $$$\it n$$$ is the number of ranks, $$$v_{l}(t)$$$ is a temporal basis function, $$$\xi_{l}$$$ is a singular value, $$$u_{l}({\bf k})$$$ is a spatial basis function. Then the images $$$\rho({\bf r},t)$$$ could be reconstructed by:$$\rho({\bf r},t)=\sum_{l=1}^nv_{l}(t)\xi_{l}{\bf Recon}(u_{l}({\bf k})/dcf({\bf k}))$$ where, $$$dcf({\bf k})$$$ is the density compensation function. The flowchart is presented in Figure 1.Methods
A visual fMRI experiment was performed on a 3T MR scanner (Magnetom Prisma, Siemens Healthineers) with a 64-channel head coil. The single-shot 3d MREG-sequence with a stack-of-spirals trajectory (TE=35ms, TR=100ms, spatial resolution=3*3*3 mm) was used1. A reference image was acquired to calculate coil sensitivity maps and field maps.
Simulations were also performed by using a time series of EPI images as a realistic ground truth. Simulated 3d MREG k-space data were then generated from the EPI image-domain data using the same trajectory and sensitivity maps as in the above experiment. Simulations were performed both with and without taking into account off-resonance effects from the measured field maps.
The reconstruction algorithm is based on a nonlinear conjugate gradient SENSE method with time-segmented nuFFT3. We empirically determined that 100 and 20 iterations were necessary for separated-recon and high-rank components of k-t RSR, respectively. For the simulations, the dynamic error maps were calculated as $$err=\sqrt{\frac{\sum((\hat{\rho}-\overline{\hat{\rho}})-(\rho-\overline{\rho}))^{2}}{m}}$$ where, $$$\hat{\rho}$$$ and $$$\rho$$$ represent reconstructed images and ground truth, $$$\it m$$$ is the number of voxels. By removing the temporal average, the error maps thus only quantify dynamic errors across time. For the visual fMRI experiment, statistical analysis was performed with SPM12 (www.fil.ion.ucl.ac.uk/spm).
Results
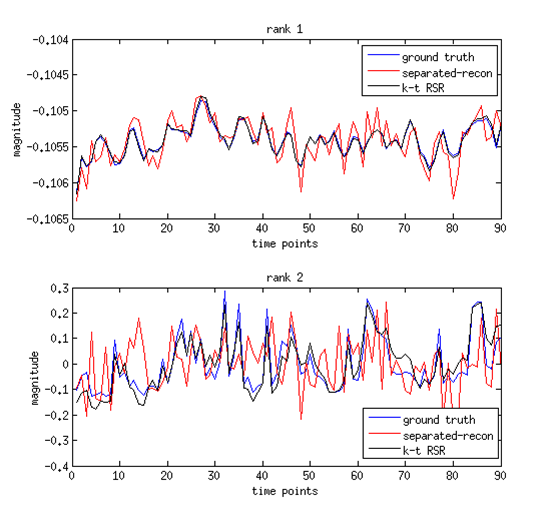
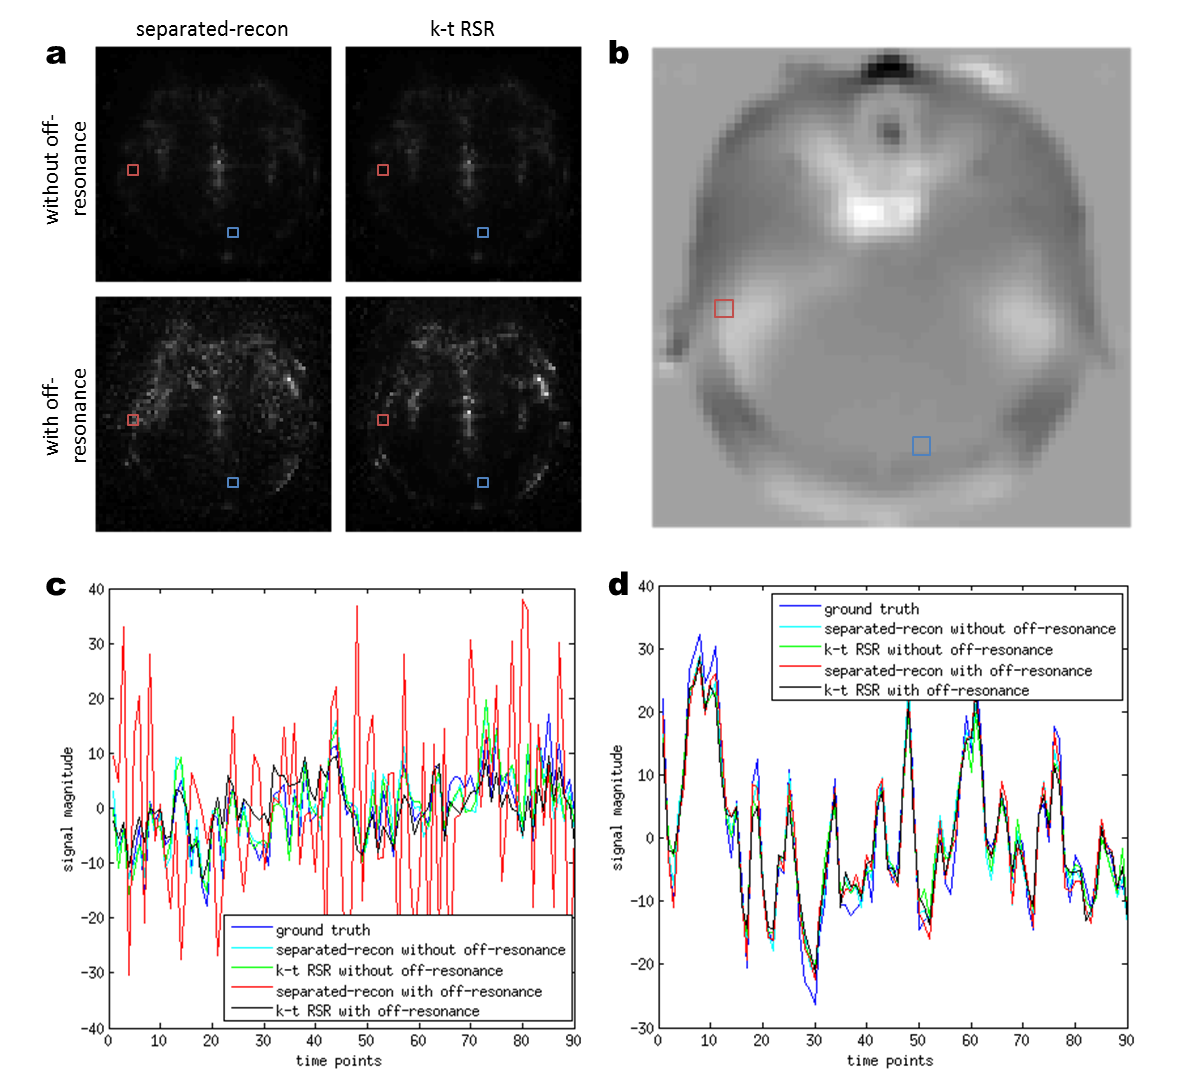
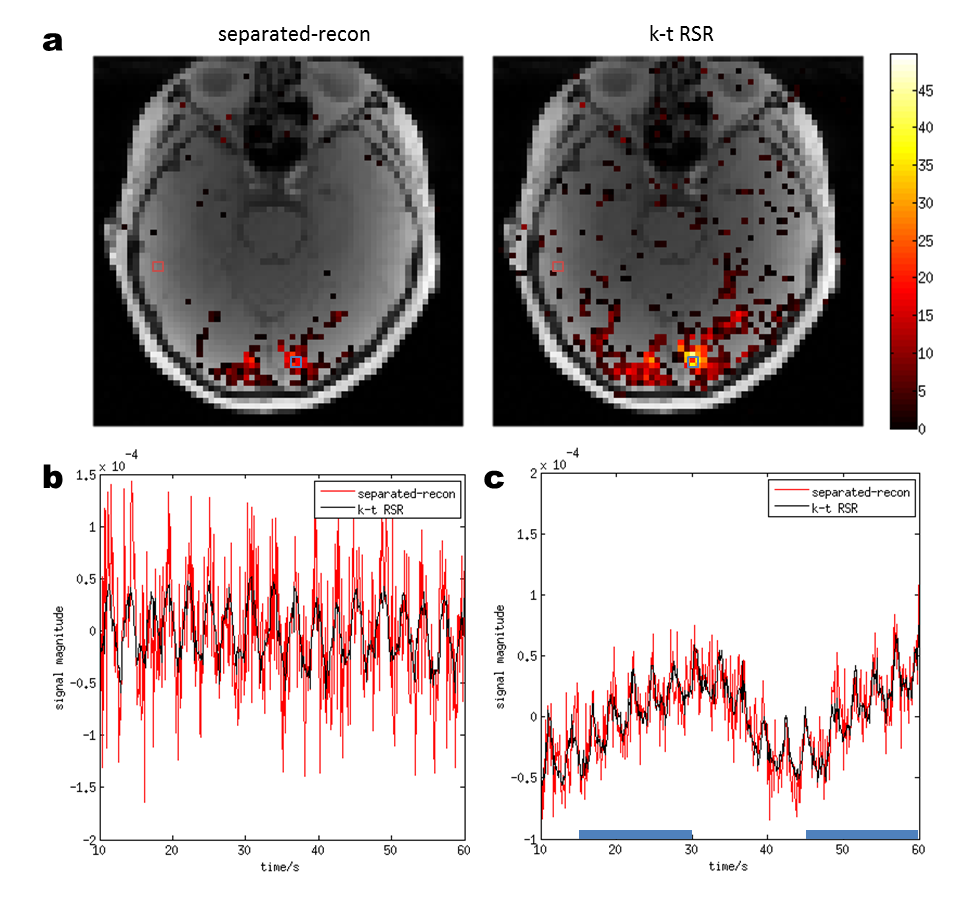
Figure 2 compares the temporal basis functions generated from ground truth, separated-recon and k-t RSR. Whereas k-t RSR recovers the dynamic information exactly, the separated-recon could not extract accurate temporal basis functions. Figure 3 compares the dynamic errors of both methods in the simulations, demonstrating that: 1) off-resonance effects are responsible for the majority of errors; 2) the error of k-t RSR is lower than separated-recon when the off-resonance field map is considered. In the real experiment, the statistical parametric map and example time series presented in Figure 4 show that k-t RSR leads to a lower high-frequency noise (and thus higher statistical t-values) than separated-recon.Discussions and Conclusions
The simulation results indicate that even with perfect knowledge of the k-space trajectory, coil sensitivity maps, and field maps, separated-recon still leads to significant dynamic time-series noise in the presence of off-resonance. In contrast, k-t RSR achieves a better recovery of dynamic signal fluctuations, which constitute the actually useful information for fMRI statistical analysis. The improvement could be attributed to the exact temporal information extracted from k-t space and the sparse high-rank spatial basis images which improve the reconstruction accuracy. Moreover, the sparse basis images can be reconstructed in fewer iterations, significantly reducing the computation time, which make non-Cartesian fast fMRI more practical. The proposed method demonstrates that joint k-t RSR reconstruction is a powerful strategy for reconstructing non-Cartesian parallel fMRI.Acknowledgements
This work was supported by the DFG Koselleck grant He 1875/28-1, the cluster of excellence EXC-1086 BrainLinks-BrainTools from the DFG, and the China Scholarship Council (CSC).References
1. Jakob Assländer, Benjamin Zahneisen, Thimo Hugger, et al. Single shot whole brain imaging using spherical stack of spirals trajectories. NeuroImage. 2013; 73: 59-70.
2. Delattre, Bénédicte MA, et al. Spiral demystified. Magnetic resonance imaging. 28.6 (2010): 862-881.
3. Sutton, Bradley P., Douglas C. Noll, and Jeffrey A. Fessler. "Fast, iterative image reconstruction for MRI in the presence of field inhomogeneities." IEEE transactions on medical imaging 22.2 (2003): 178-188.
Figures