1517
Evaluation of convex programming for super-resolution MRI reconstruction using shifted slice acquisitions1Radiology, Boston Children's Hospital and Harvard Medical School, Boston, MA, United States
Synopsis
Super-resolution methods have recently became popular due to their ability to generate isotropic high resolution images from multiple low resolution acquisitions. In this work, we developed and evaluated a convex programming solution to the super-resolution reconstruction and applied it to combine shifted thick slice T2 images into images with isotropic resolution. With this formulation, using phantom and volunteer experiments, we show that, it is possible to generate high resolution images with better resolution and accuracy compared to the previously developed methods.
Purpose
Super-resolution methods aim at reconstructing high-resolution (HR) information from coarse-scale measurements. These methods were introduced in the MR image reconstruction field in early 2000s1 and recently became popular in the fields of fetal MRI2,3 and diffusion-weighted MRI4, where low resolution (LR) images acquired with different orientations are combined to generate an isotropic resolution image. The forward problem of super-resolution can be represented by equation-1, where matrix A defines an operator that generates low-resolution images from the desired band-limited high-resolution image x. Traditionally, inspired by the super-resolution literature in image processing5, this equation is solved by what can be described as a shift-and-add (SAA)6 approach where the low resolution images are interpolated onto an HR grid (after motion correction) followed by restoration for blur and noise removal. Recently Candes et.al7 proposed casting the super-resolution solution as a simple convex problem (Equation-2) and showed that this solution gives the exact object location and amplitudes when the objects are seperated by 1/(2*fc+1) where fc is the maximum frequency of the low resolution measurements. They also showed that when the measurements are noisy, this solution results in a bounded extrapolation error that scales quadratically with the super-resolution factor. In this work, we assessed whether this convex algorithm can be used to increase the resolution of MR acquisition in the slice direction, via repeated measurements of shifted low-resolution acquisitions.
Equation 1: $$y_k=Ax_k+v_k$$
Equation
2: $$min_x
||X||_{TV} \quad \textrm{subject
to} \quad ||Ax-y||_1
<
δ$$
Methods
We solved Equation.2 by casting the dual problem as a semi-definite program, implemented using MATLAB and the convex programming (cvx) toolbox8. To test the results, we performed simulation experiments, MR phantom scans and volunteer studies. First a simulation study was performed where a T2-weighted 1x1x1mm image of an ACR phantom was used to simulate images with thicker slices (2mm). For this experiment the slice-profile was set using slice-profile measurements on the scanner and Rician noise was added to each thick-slice image to achieve an SNR of 32dB. The generated images were then used to compute a 1x1x1mm image using a) equation.2, b) shift-and-add method. The resultant images were then compared to the original ground truth image to evaluate the root-mean-square error and separability of high-resolution objects. Then same setup was tested on real images of the ACR-phantom acquired from a 3T MR scanner using a T2-weighted acquisition where 2 images were acquired with a resolution of 1x1x2mm but shifted by 1mm in the slice selection direction. Finally, 3 volunteers were imaged using an axial T2-weigted-FSE sequence with the same protocol. For all the MR exams we used FOV=256mm, in-plane resolution 1mm, slice thickness 1-2mm, TE/TR=82ms/9000ms.Results
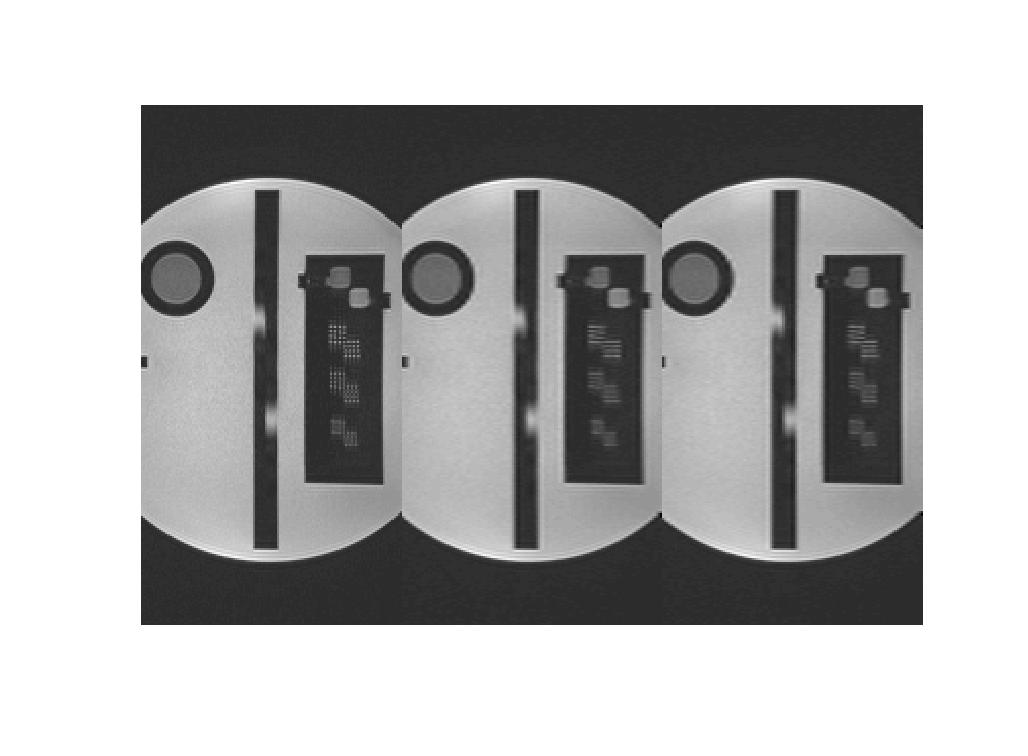
Figure.1 shows the ground truth image used for the simulation studies and
the generated low-resolution images using the forward model in
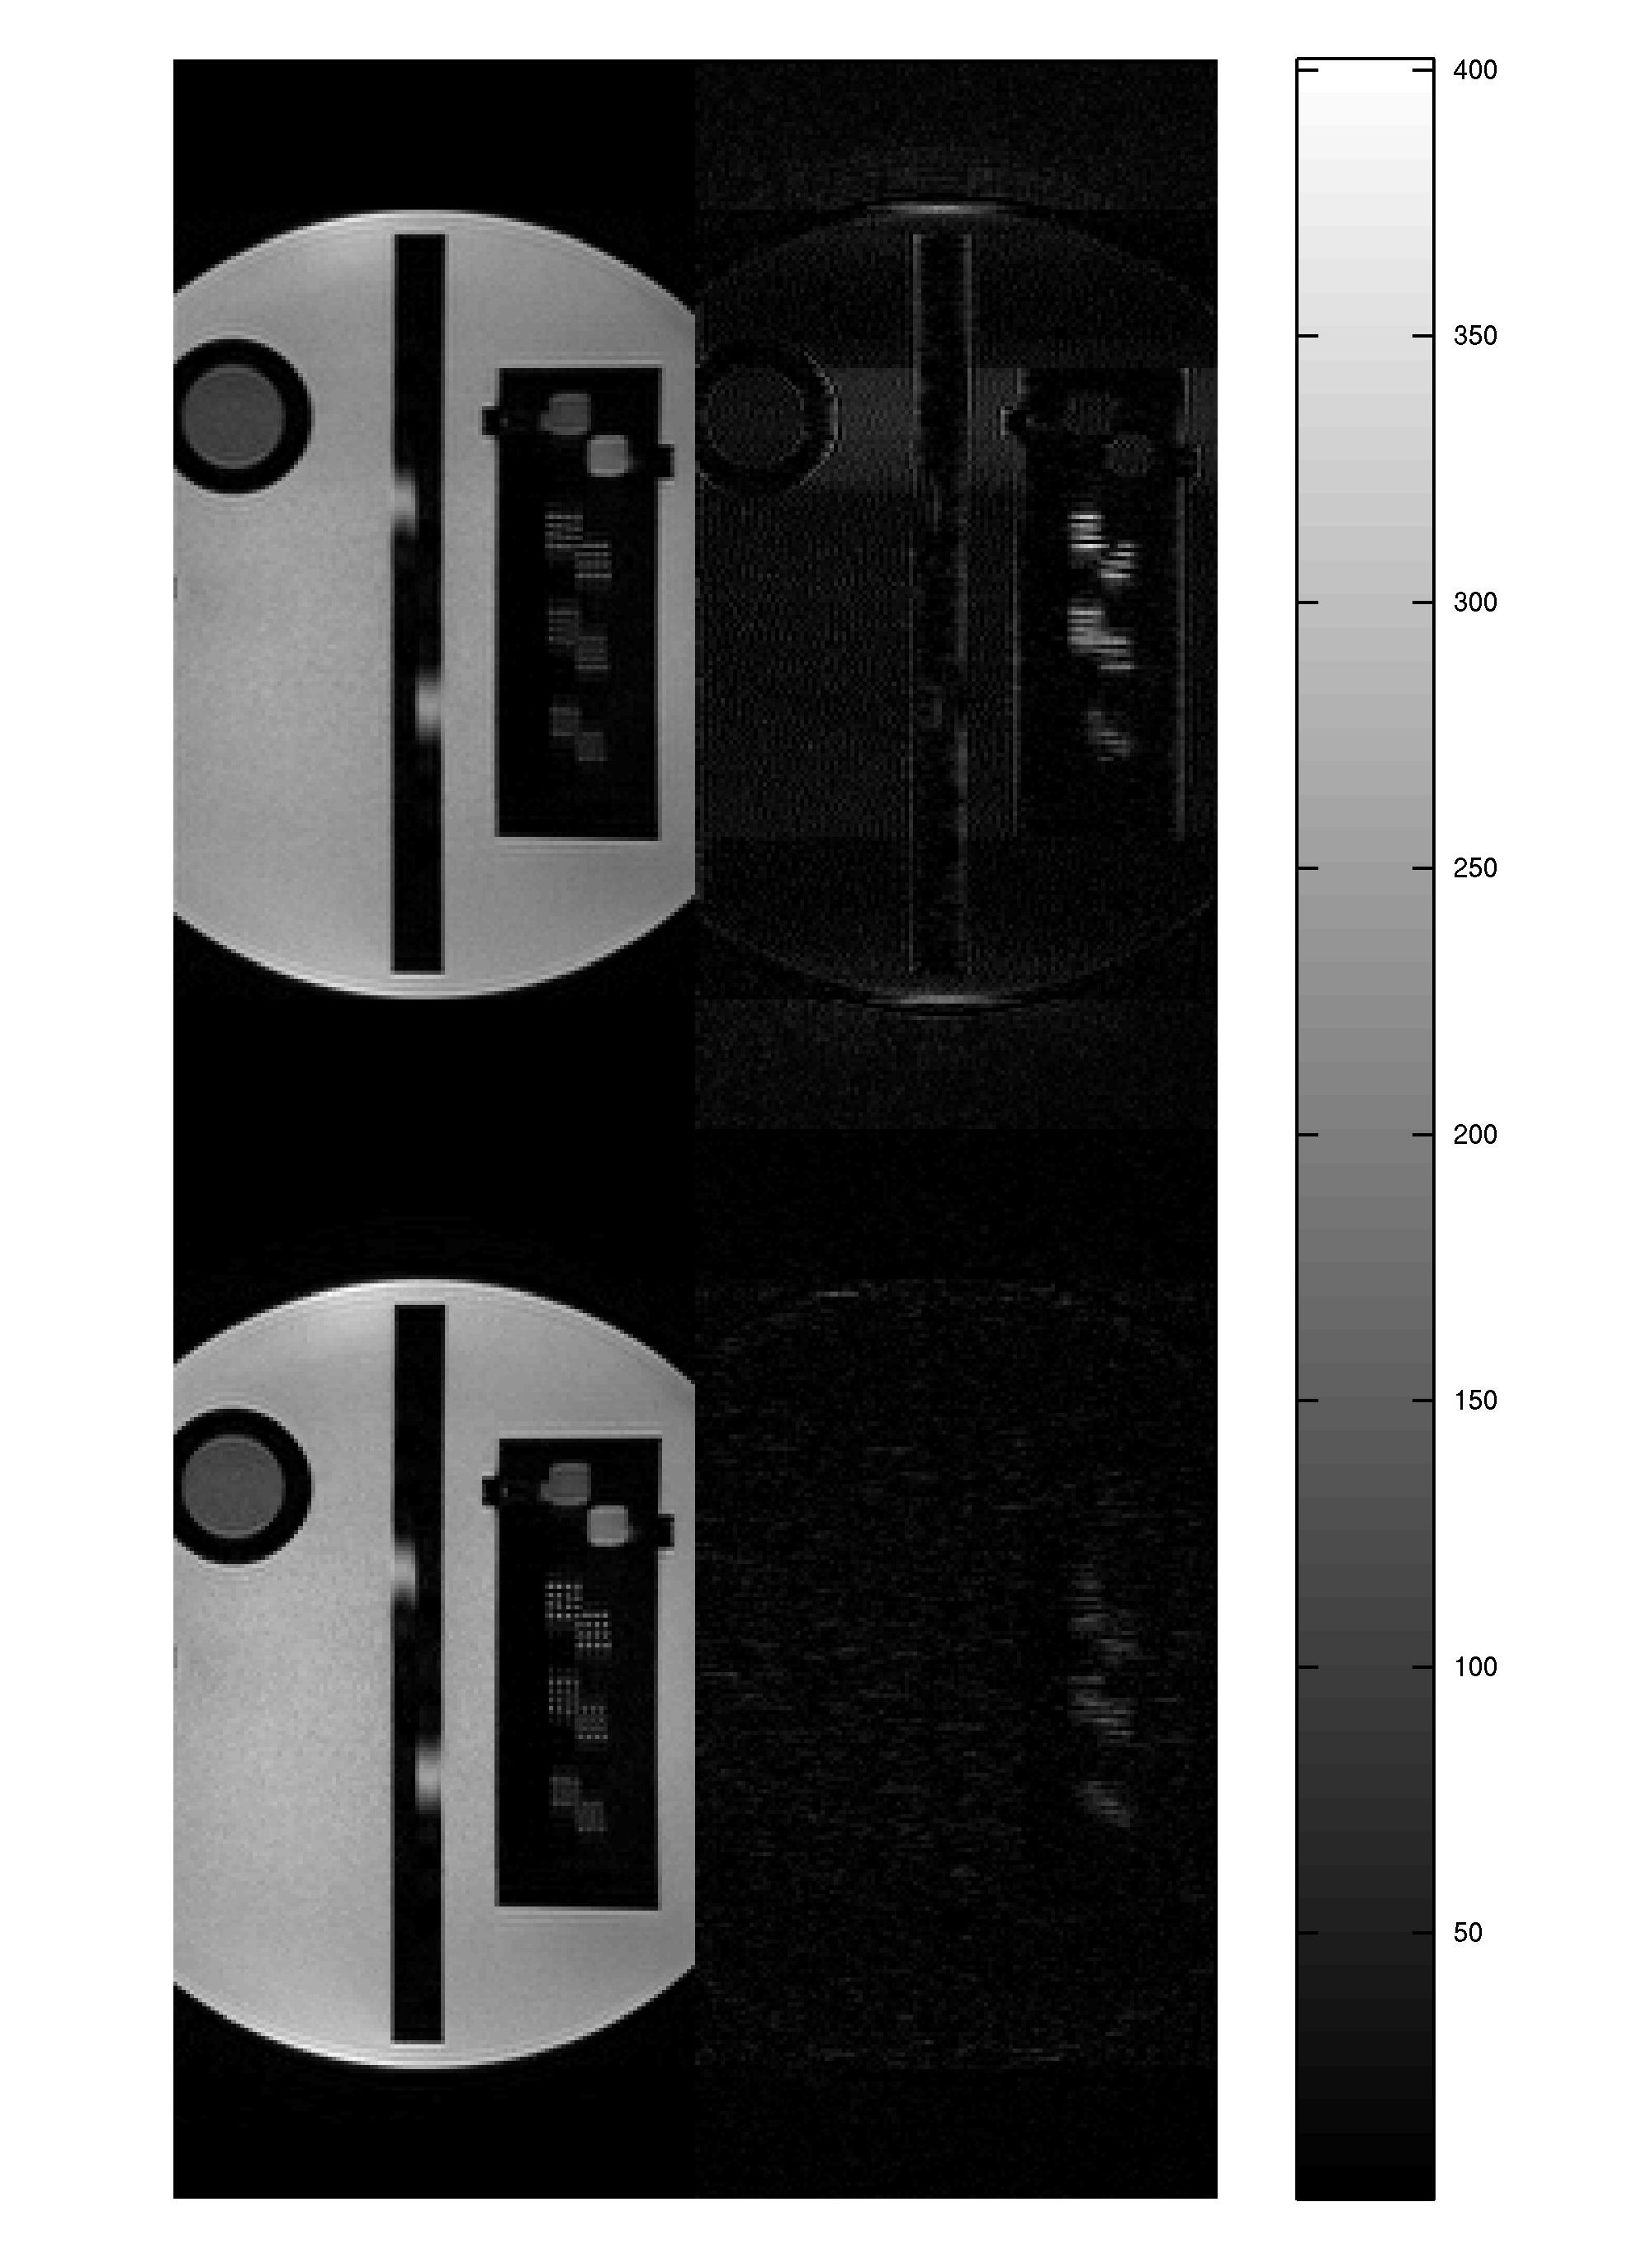
equation.1. Figure.2 shows the reconstructions via convex programming
(CP) and the SAA
method, and the difference images with the ground truth image.
Normalized
RMSE
was 1.02%
for CP (maximum
error 6.2%),
compared to 4.2%
for SAA (maximum
error 14.1%).
Signal-to-noise-ratio was 32dB for the 1x1x2mm images, 30.1dB for the CP images and
30.9dB for SAA images. As
can be seen from the images, the 4x4 point objects (separations
of 1.1mm, 1.0mm and 0.9mm from the top block to the bottom block),
are not separable in the 1x1x2 images. The separation was much
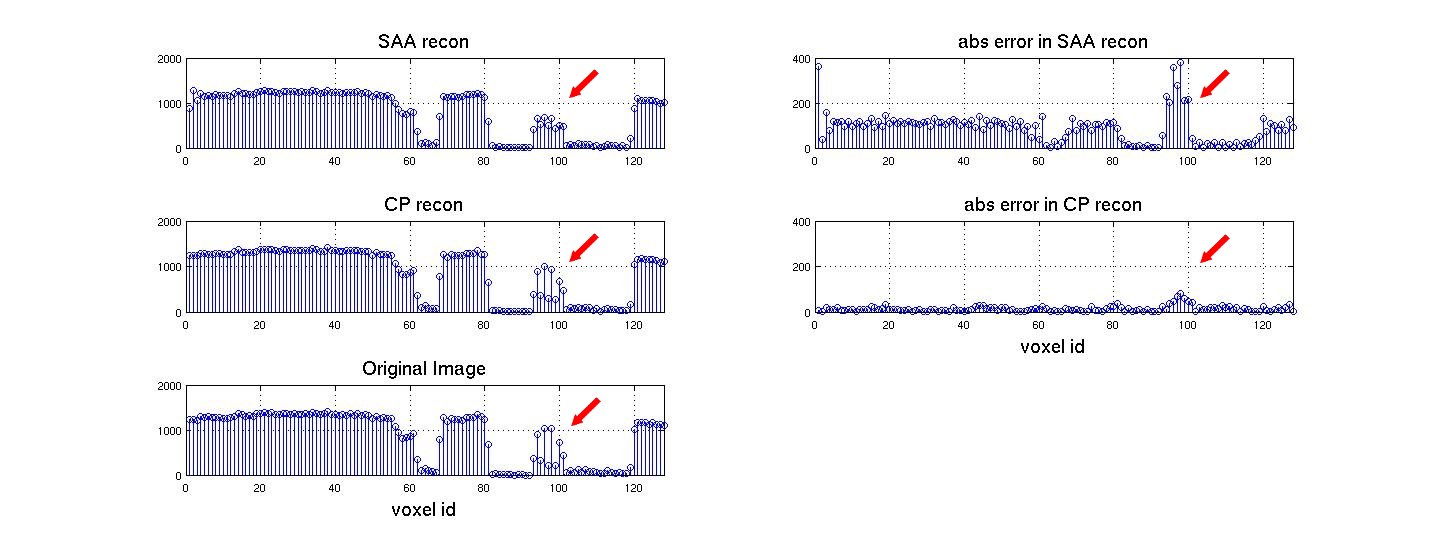
clearer in the CP images compared to the SAA images, as can be seen
in Figure.3, which shows the intensity profile through the upper
block in the slice-encoding direction (left-right in the original
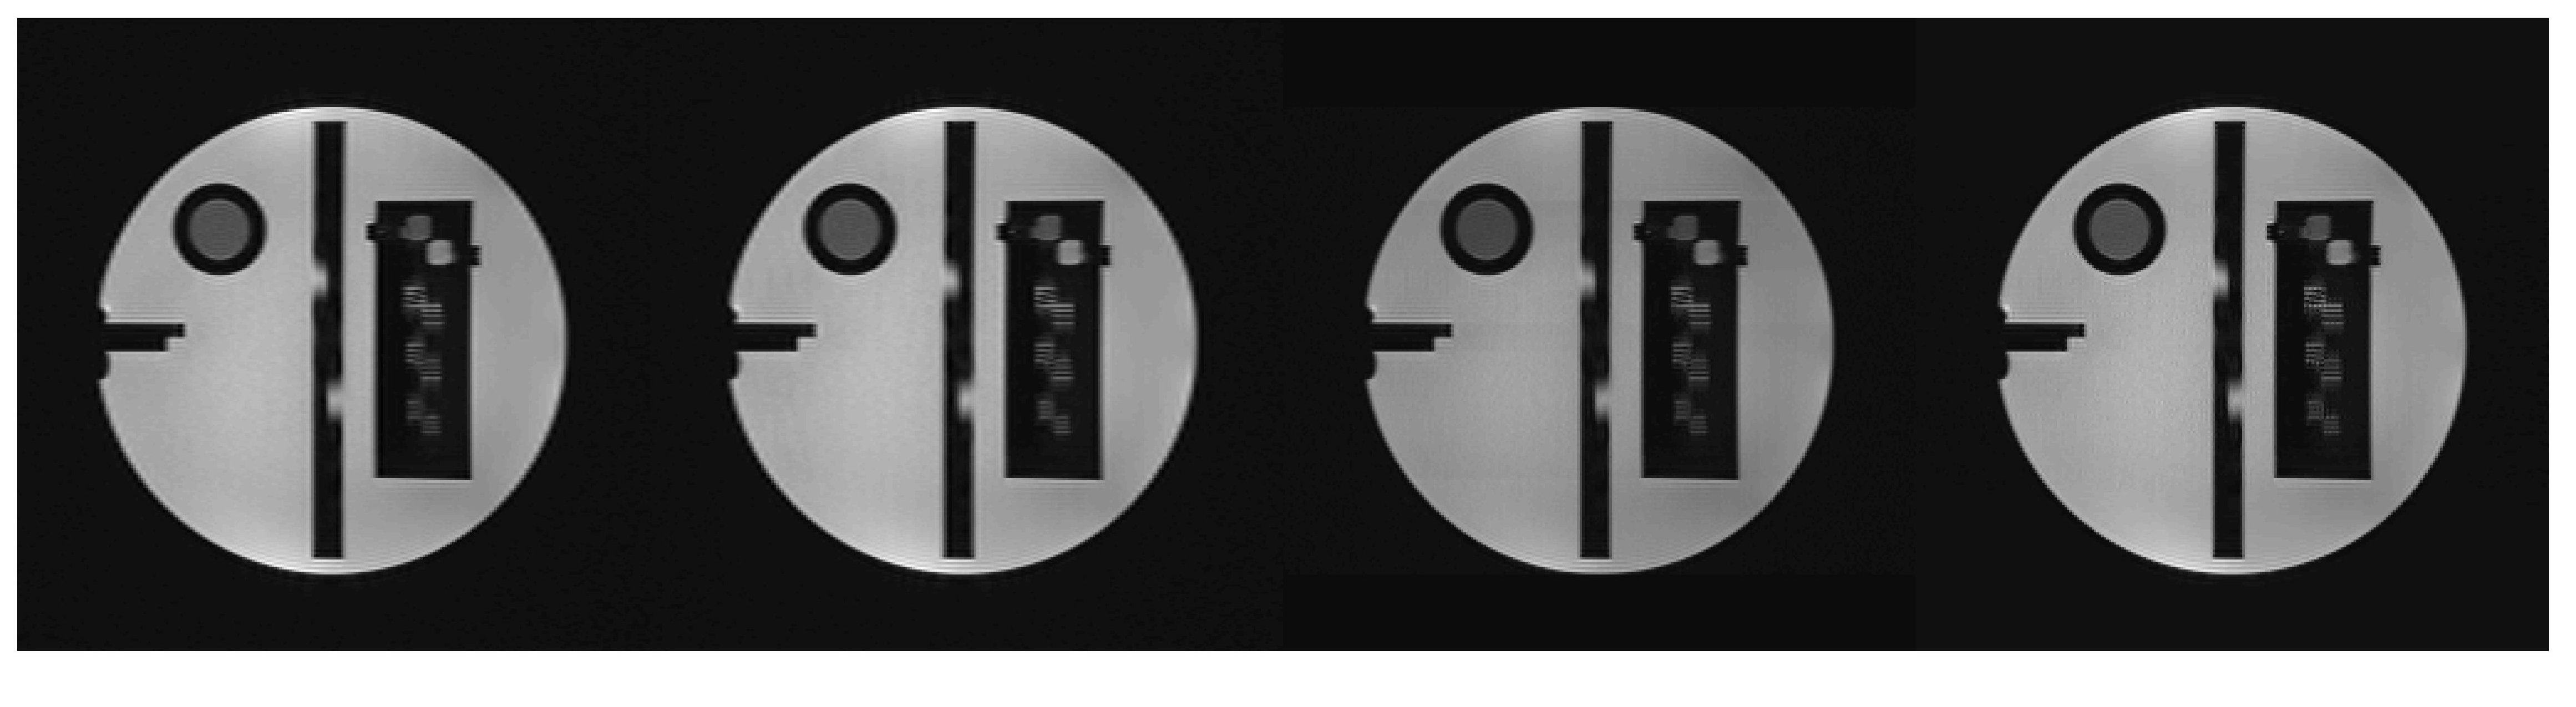
image). Figure.4 shows reconstructions from real MR data of the same
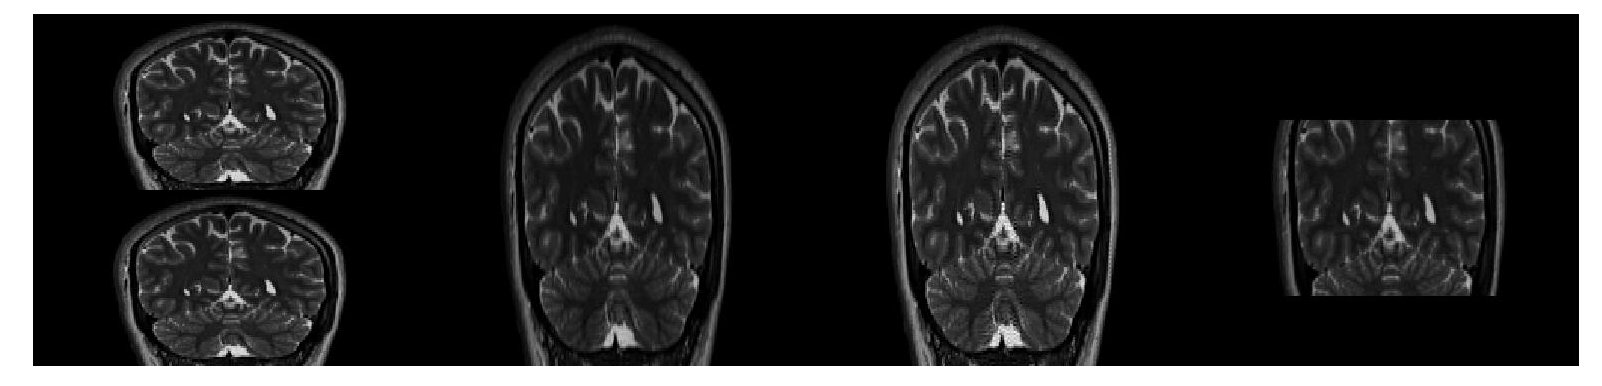
phantom and the HR image. Figure.5 shows
reconstructions from one of the volunteer studies and a 1x1x1mm image
acquired on the same volunteer.Discussion
Simulated phantom images showed near perfect reconstruction even when noise was added. The errors were slightly higher in the real MR images, most likely due to artifacts resulting from discretization of the slice profile. We also observed that error was higher in volunteer studies especially around the ventricles. This was most likely due to flow and motion artifacts between two low-resolution acquisitions.Conclusion
Both
experimental results and simulations in this study show that casting
the problem of increasing resolution in the slice direction via slice
shifts as a convex problem can improve the images in terms of
sharpness and accuracy compared to the previously used shift-and-add
methods. Possible motion between low-resolution acquisitions was not
considered in this study; a model that considers motion in matrix A
will most likely result in improved results in the volunteer studies.Acknowledgements
This work is supported by the NIH grants;R01 EB019483, R01 EB018988, R01 NS07978. R0 EB013248, R01 NS079788. The content is solely the responsibility of the authors and does not necessarily represent the official views of the NIH.References
1.Greenspan, H., Oz, G., Kiryati, N. and Peled, S., 2002. MRI inter-slice reconstruction using super-resolution. Magnetic resonance imaging, 20(5), pp.437-446.
2. Kuklisova-Murgasova, M., Quaghebeur, G., Rutherford, M.A., Hajnal, J.V. and Schnabel, J.A., 2012. Reconstruction of fetal brain MRI with intensity matching and complete outlier removal. Medical image analysis, 16(8), pp.1550-1564.
3. Gholipour, A., Estroff, J.A. and Warfield, S.K., 2010. Robust super-resolution volume reconstruction from slice acquisitions: application to fetal brain MRI. IEEE transactions on medical imaging, 29(10), pp.1739-1758.
4. Scherrer, B., Gholipour, A. and Warfield, S.K., 2012. Super-resolution reconstruction to increase the spatial resolution of diffusion weighted images from orthogonal anisotropic acquisitions. Medical image analysis, 16(7), pp.1465-1476.
5. Park, S.C., Park, M.K. and Kang, M.G., 2003. Super-resolution image reconstruction: a technical overview. IEEE signal processing magazine, 20(3), pp.21-36.
6. Farsiu, S., Robinson, D., Elad, M. and Milanfar, P., 2003, November. Robust shift and add approach to superresolution. In Optical Science and Technology, SPIE's 48th Annual Meeting (pp. 121-130). International Society for Optics and Photonics.
7. Candès, E.J. and Fernandez-Granda, C., 2013. Super-resolution from noisy data. Journal of Fourier Analysis and Applications, 19(6), pp.1229-1254.
8. Michael Grant and Stephen Boyd. CVX: Matlab software for disciplined convex programming, version 2.0 beta. http://cvxr.com/cvx, September 2013.
Figures