1506
SNR Efficiency of Combined Bipolar Gradient Echoes: Theoretical Expressions and Experimental Verification1Oncology, University of Alberta, Edmonton, AB, Canada, 2Medical Physics, Cross Cancer Institute, Edmonton, AB, Canada
Synopsis
Multi-echo bipolar pulse sequences are becoming increasingly popular in structural brain imaging applications that require high SNR efficiency and minimal geometrical distortions or water-fat shifts. However, various discrepant expressions for the SNR as a function of T2* and the sampling bandwidth were previously reported, making it unclear as to how multiple bipolar echoes should be combined to maximize SNR. In this study, we compare some traditional single-echo (low-bandwidth) FLASH and MPRAGE sequences with their multi-echo bipolar (high bandwidth) counterparts and validate the SNR theory via phantom measurements. Bipolar MPRAGE/FLASH yield SNR gains of ~1.3/1.6-fold, in good agreement with the theory.
- Purpose
High-bandwidth bipolar multi-echo gradient
echo pulse sequences have become increasingly popular for 3D structural brain
imaging due to advantages such as reduced susceptibility-induced geometrical
distortions and
water-fat shifts [1–3]. However, the SNR efficiency (SNR per square root of the
total scan duration) of these sequences has not been studied in detail, and
various inconsistent expressions for the SNR model as a function of T2*
and the sampling bandwidth have been reported in the literature [4–6], making
it unclear as to how the multiple echoes should be combined to maximize the
SNR. In this study, we compare some traditional single-echo (low-bandwidth)
FLASH and MPRAGE sequences with their multi-echo bipolar (high bandwidth)
counterparts and validate the SNR theory via phantom measurements.Theory
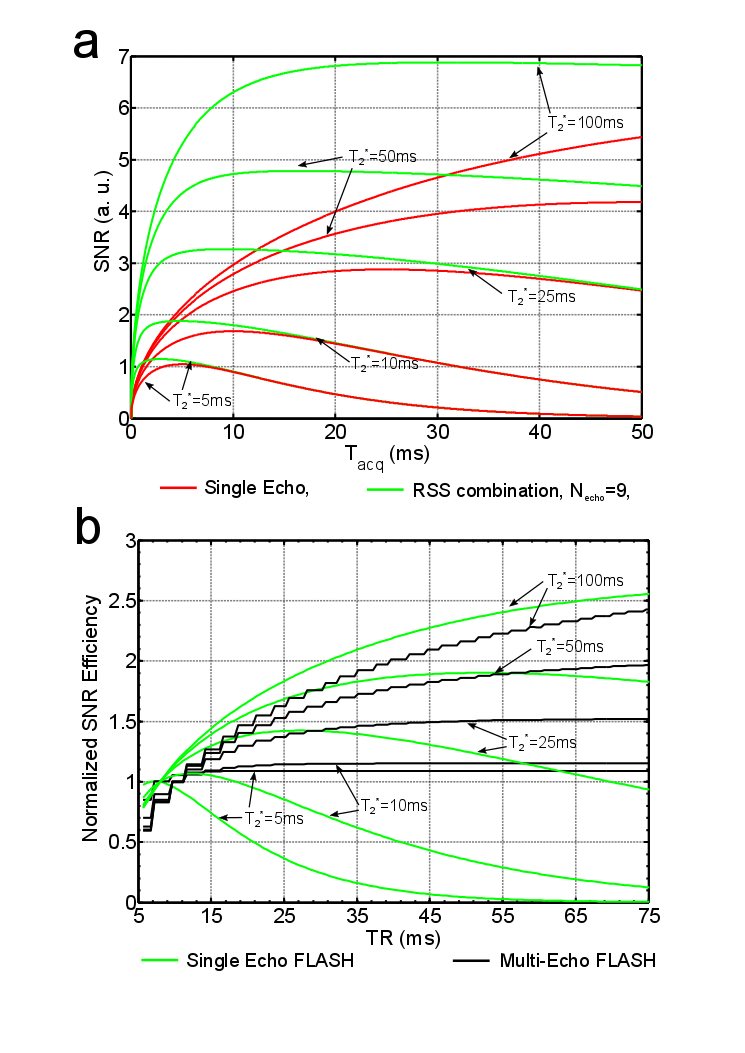
According to [4], the SNR of a full echo (i.e. TE ≈ Tacq/2) as a function of acquisition time Tacq is
$$SNR\propto\sqrt{T_{acq}}e^{-T_{acq}/(2T_{2}^{*})}$$ Eq. 1
In the case of a multi-echo sequence, the root-sum-of-squares (RSS) of the magnitude images (a.k.a. Multi-echo Recombined Gradient Echo or MERGE) is the optimal combination that maximizes the SNR in the presence of T2* decay [7]. In this case, Eq. 1 becomes
$$SNR\propto\sqrt{T_{acq}}\sqrt{\sum_{n=1}^Ne^{-2TE_{n}/T_{2}^{*}}}$$ Eq. 2
Incorporating the effect of parallel imaging acceleration and the signal yield as a function of all the scan parameters yields
$$SNR\propto\ \frac{\sqrt{T_{acq}}}{g\sqrt{R}}\cdot S_{0}\cdot D(TE;T_{2}^{*}), D= \begin{cases}e^{-TE/T_{2}^{*}}, & N_{echo}=1\\\sqrt{\sum_{n=1}^{N_{echo}}e^{-2\cdot TE_{n}/T_{2}^{*}},} & N_{echo}> 1\end{cases}$$ Eq.3
Here, S0 is the magnitude signal yield as a function of T1 and extrinsic scan parameters [i.e. S0,FLASH=S(α, TR; T1) , S0,MPRAGE=S(α, TR, TI, TD, TRMP; T1)]. TI is the inversion time, TD is the delay time, TRMP is the shot duration, R is the parallel-imaging acceleration factor, g is the geometry factor and TEn is the echo time(s). Figure 1 shows the predicted SNR (assuming g≈1 as obtained using regularized SENSE reconstruction) for a single-echo versus a bipolar multi-echo FLASH sequence as a function of Tacq in (a) and TR in (b).
Methods
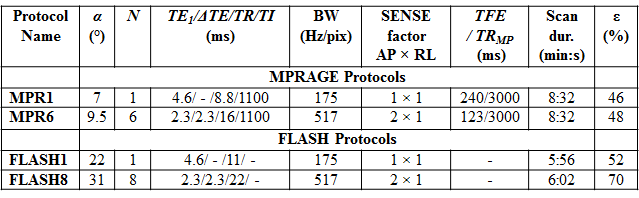
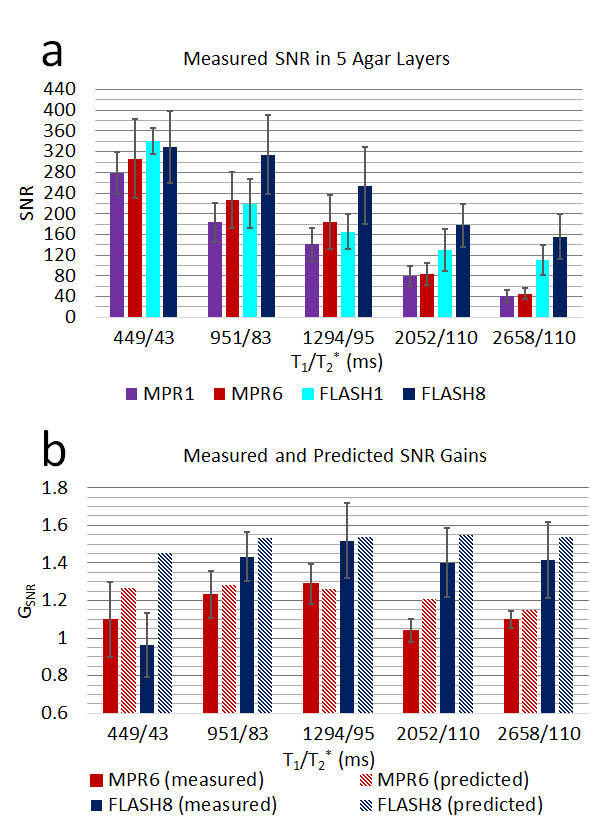
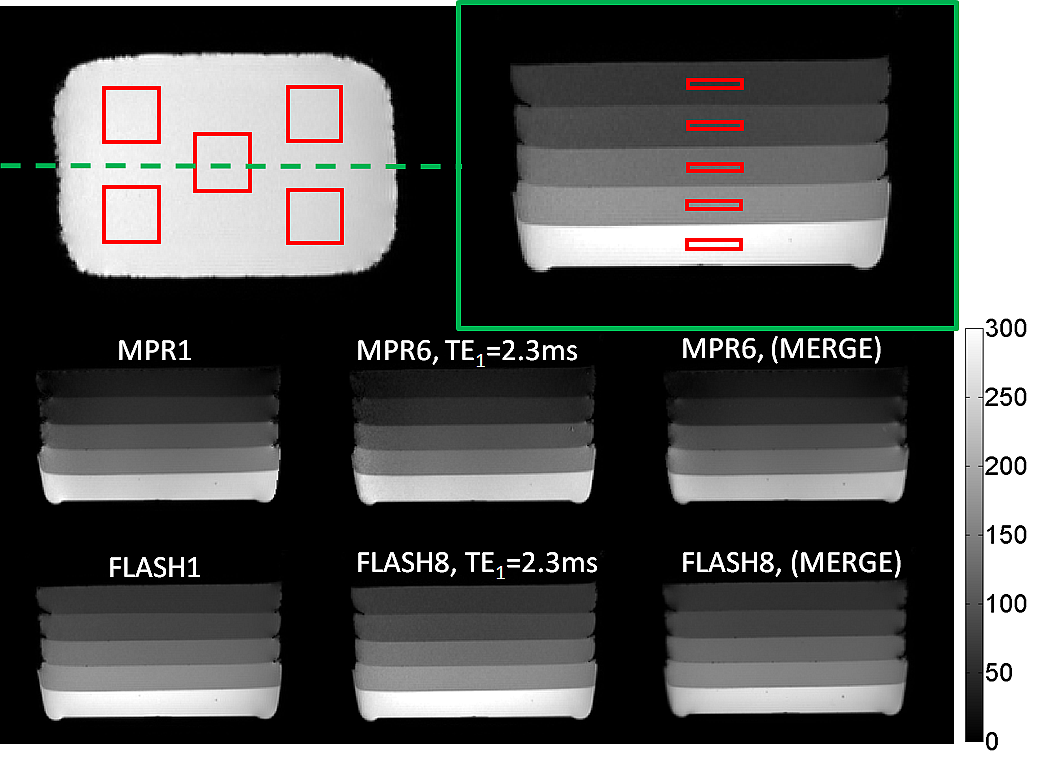
The SNR theory of Eqs. 1 and 2 was verified experimentally using 4 MnCl2-doped gelatin beakers (T2*=10, 21, 39, 76 ms). A single-slice 2D FLASH sequence (α/TR=50°/200ms) was tested with varying Tacq (1–25ms) and enough echoes to fill the TR (1–32 echoes). To verify Eq. 3, a 3D 8-echo FLASH and a 6-echo MPRAGE sequences were optimized on a Philips 3T Achieva scanner to yield identical scan time ( <9 min) and comparable contrast to a low-bandwidth single-echo FLASH and MPRAGE (see the Table in Figure 2). All sequences were tested on a 5-layed agar phantom doped with MnCl2 to mimic T1/T2*of various tissue classes. An 8-channel head array operated in SENSE mode was employed for signal reception. For each agar layer, the SNR was measured in 5 ROIs using the method of [8].Results
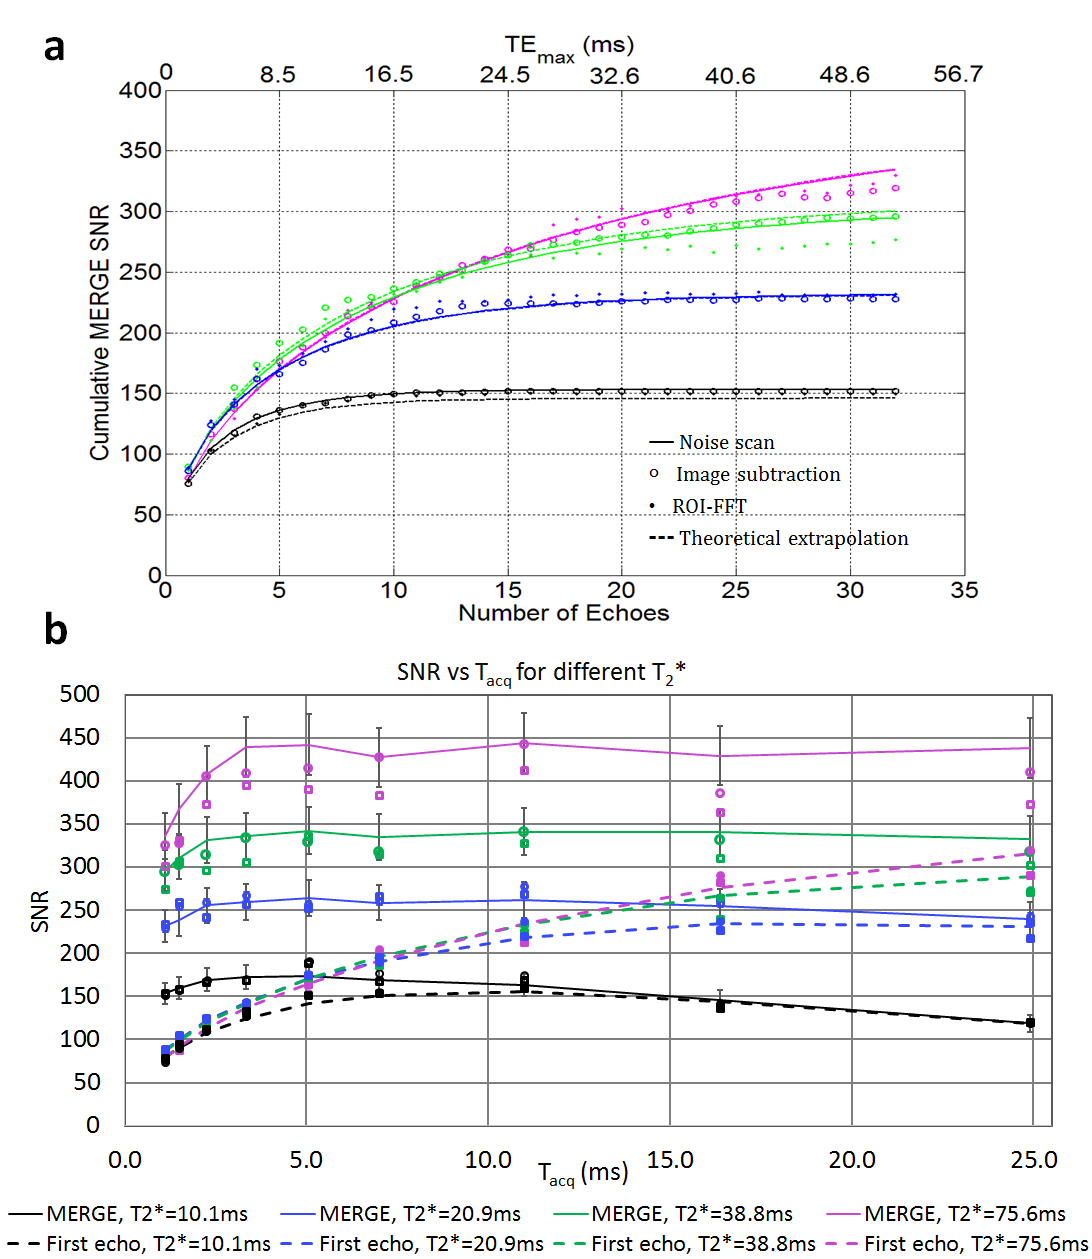
As shown in Fig. 3, the measured SNR agrees well with the theory (Eqs. 1 and 2). The RSS combination of echoes causes the SNR to converge toward an asymptote. The measured SNR gains for 3D FLASH and MPRAGE (Fig. 4a) agree with the theory (Fig. 4b), except in the bottom layer (short T1/T2* mimicking fat) of the FLASH8 image, probably owing to a higher B1 non-uniformity (or g>1) than in other layers. SNR gains of 1.28 and 1.52 for MPR6 and FLASH8, over MPR1 and FLASH1, respectively, are achieved in layer 3 (T1/T2*=1294/95 ms). Sagittal images of the phantom with ROI locations are displayed in Figure 5. Note how the contrast in MPR6/ FLASH8 at TE1 is equivalent to that in MPR1/FLASH1, respectively, despite significantly different scan parameters.Discussion
This study compares the SNR efficiency of bipolar multi-echo gradient echo sequences over their single-echo counterparts (FLASH and MPRAGE) and verifies the theoretical expressions. At 3T, optimized multi-echo sequences can enable SNR gains of 1.3–1.6 with a mere 8-channel receiver array despite 3-fold higher bandwidths, depending especially on the sequence parameters, and on the T2*. These gains arise from a combination of increased signal yields (by using longer TR and higher flip angles), and the combination of multiple echoes. The measured SNR gains in the agar phantom agree well with the theory, as long as moderate regularized SENSE accelerations are employed (≤3-fold with an 8-channel head array) which ensures that g ≈ 1.Conclusion
Multi-echo bipolar sequences are recommended for structural brain imaging applications where high SNR and geometrical fidelity are required, (e.g. radiation treatment planning and image-guided surgery). However, since local SNR gains may depend considerably on hardware and parallel imaging implementation, careful phantom validations (as performed in this work) should be performed prior to routine clinical use.Acknowledgements
Funding from the Alberta Cancer Foundation, Alberta Cancer Research Institute, and Natural Sciences and Engineering Research Council (Canada) is gratefully acknowledged. We also thank Philips Healthcare for technical support and Dr. Roger Luechinger for the PATI program used for data transfer.References
1. Helms G. and Dechent P. Increased SNR and reduced distortions by averaging multiple gradient echo signals in 3D FLASH imaging of the human brain at 3T. J Magn Reson Imaging 2009; 29:198-204. 2. Fischl B, Salat DH, Van Der Kouwe AJW et al. Sequence-independent segmentation of magnetic resonance images. Neuroimage 2004; (23 Suppl 1): S69-S84.
3. Van Der Kouwe AJW, Benner T, Salat DH et al. Brain morphometry with multi-echo MPRAGE. Neuroimage 2008; 40: 559-569.
4. Fleysher L, Fleysher R, Liu S et al. Optimizing the precision-per-unit-time of quantitative MR metrics: examples for T1, T2, and DTI. Magn. Reson. Med. 2007;57:380–7.
5. Vinitski S, Griffey R, Fuka M et al. Effect of sampling rate on magnetic resonance imaging. Magn Reson Med 1987; 5:278-285.
6. Rahmer J, Bornert P, Groen J et al. Three-dimensional radial ultra-short echo-time imaging with T2 adapted sampling. Magn Reson Med 2006; 55:1075-1082.
7. Jutras J-D, Wachowicz K, Gilbert G and De Zanche N. SNR efficiency of combined bipolar gradient echoes: comparison of 3D FLASH, MPRAGE and multiparameter mapping with VFA-FLASH and MP2RAGE. Magn Reson Med 2016; (early view). DOI 10.1002/mrm.26306
8.
Preibisch C and Deichmann R. T1
mapping using spoiled FLASH-EPI hybrid sequences and varying flip angles. Magn
Reson Med 2009; 62: 240-246.
Figures