1501
A new ultrafast 3D gradient-echo-based imaging method: RASE-IIJaeKyun Ryu1,2, WonBeom Jung1,2, Sun Young Chae1,3, Geun-Ho Im4,5, Jung Hee Lee1,3,4, Seong-gi Kim1,2, and Jang-Yeon Park1,2
1Center for Neuroscience Imaging Research, Institute for Basic Science (IBS), Suwon, Korea, Republic of, 2Department of Biomedical Engineering Sungkyunkwan University (SKKU), Suwon, Korea, Republic of, 3Department of Health Sciences and Technology, SAIHST, Sungkyunkwan University, Seoul, Korea, Republic of, 4Center for Molecular and Cellular Imaging, Samsung Biomedical Research Institute, Seoul, Korea, Republic of, 5Department of Radiology, Samsung Medical Center, Sungkyunkwan University, Seoul, Korea, Republic of
Synopsis
One version of a new ultrafast gradient-echo-based 3D imaging technique using spatiotemporal encoding (RASE-II) is proposed which provides constant TE across all spins. RASE-II maintains most of appealing features of other spin-echo-based SPEN imaging methods such as no Nyquist ghosting and high tolerance to field inhomogeneities. RASE-II also has less sensitivity not only to SAR and B1-inhomogeneity effects because of low flip angles, but also to T2* signal modulation due to constant TE. As a promising tool for fMRI, RASE-II shows significant improvement of tSNR over GE-EPI. Its performance is demonstrated by lemon and in-vivo rat brain imaging at 9.4T.
Purpose
A new ultrafast gradient-echo-based 3D imaging method is proposed using spatiotemporal encoding1, 2 (SPEN), which is dubbed RASE (Rapid Acquisition with Sequential Excitation). Two versions of RASE (I and II) are available: One is to enable a much shorter effective TE than EPI counter parts and the other provides constant TE across an object to be imaged. Here the second one (RASE-II) is introduced and demonstrated by lemon and in-vivo rat brain imaging on a 9.4-T (Bruker-BioSpec, 94/30 US/R) animal scanner. A potential application for fMRI was also tested by examining tSNR maps from time series.Method
The sequence diagram of RASE-II is illustrated in Fig.1a. A frequency-swept chirp pulse is used for sequential spin excitation which produces a quadratic phase that localizes a signal in both time and space during data acquisition in the presence of gradient. In RASE-II, spin excitation and data acquisition are performed with the same duration and, between them, a rephasing gradient is applied to make all the spins experience constant TE (Fig.1b). Also note that the slab-selective direction is spatiotemporally encoded, which allows a flexibility for reducing the echo train length and the effective TE3. For demonstration, high-resolution lemon and in-vivo rat brain imaging was performed using a single-channel transceiver volume coil with 72-mm diameter and a surface coil with 35-mm diameter, respectively. Images were reconstructed offline with MATLAB (ver.8.2.0; R2013b) using the super-resolution algorithm4. For lemon imaging, 2D-GRE, GE-EPI, and RASE-II sequences were used for comparison. Scan parameters in common were: FOV = 65×65 mm2, matrix = 128×128, number of slices = 48, slice thickness (THK) = 0.3125 mm. In GRE imaging as a reference, TR/TE = 310/3 ms, flip angle (FA) = 33°. In GE-EPI imaging, volume-TR/TE = 3,600/36.6 ms, FA = 90°. For RASE-II imaging, shot-TR/TE = 57/29.5 ms, FA (Ernst angle) = 14.3°, R-value (pulse_length × bandwidth) = 256. In-vivo rat brain imaging was performed using GE-EPI and RASE-II. To evaluate temporal signal fluctuations, time series were acquired in the resting state with 60 volumes and tSNR maps were calculated by dividing the temporal mean value of each voxel by the temporal standard deviation. Same scan parameters were: volume-TR/TE = 2,400/20 ms, FOV = 30×15 mm2, matrix = 96×48, number of slices = 48, THK = 0.3125 mm, FA (Ernst angle) = 75°(GE-EPI), 13.4°(RASE-II). In RASE-II imaging, shot-TR = 50 ms, R-value = 64.Results
Figure 2 shows lemon images from 2D-GRE (a), GE-EPI (b), RASE-II (c). RASE-II provided better image quality with less distortion than GE-EPI because of higher tolerance to field inhomogeneites due to larger gradient amplitudes as well as less T2* effects due to local rephasing mechanism in the SPEN direction. Figure 3 shows axial images of in-vivo rat brain (a, c), their tSNR maps (b, d), and the histogram of tSNR distribution in the brain area (e) obtained from GE-EPI and RASE-II. It is clearly shown that tSNR of RASE-II was overall higher than that of GE-EPI, as it was previously reported that 3D imaging provides better tSNR than 2D counterparts in case that thermal noises are dominant compared to physiological noises, e.g., in high-resolution 3D imaging5, 6.Discussion & Conclusion
Despite a gradient-echo-based acquisition scheme, RASE-II inherits most of appealing features of other spin-echo-based SPEN imaging methods such as no Nyquist ghosting in the SPEN direction and higher immunity to geometric distortions due to field inhomogeneities than EPI counterparts1, 2. In addition, low flip angles make RASE-II less sensitive to specific absorption rate (SAR) and B1-inhomogeneity. Moreover, since RASE-II is able to provide constant TE across all spins, it is barely affected by T2* signal modulation seen in GE-EPI. With regard to fMRI, the 3D characteristics of RASE-II with low flip angle reduces inflow effects as well as physiological noises7. As shown in Fig.3, high-resolution RASE-II imaging significantly improves tSNR over GE-EPI in the resting-state fMRI scheme. In conclusion, RASE-II will be promising in many GE-EPI applications including fMRI, especially offering more benefits at ultrahigh fields, e.g., 7 T and above.Acknowledgements
This work was supported by IBS-R015-D1References
[1] Camberlain R et al., Mag Reson Med 2007;58:794-799. [2] Ben-Eliezer N et al., Mag Reson Imaging. 2010;28:77-86. [3] Ryu JK et al., ISMRM. 2015;6897. [4] Chen Y et al., Mag Reson Med. 2013;69:1326-1336. [5] Poser B.A at al., Neuroimage. 2010;51:261-266. [6] van der Zwaag w at al., Mag Reson Med. 2012;67:344-352. [7] Gao J.H at al., Neuroimage. 2012;62:1035-1039.Figures
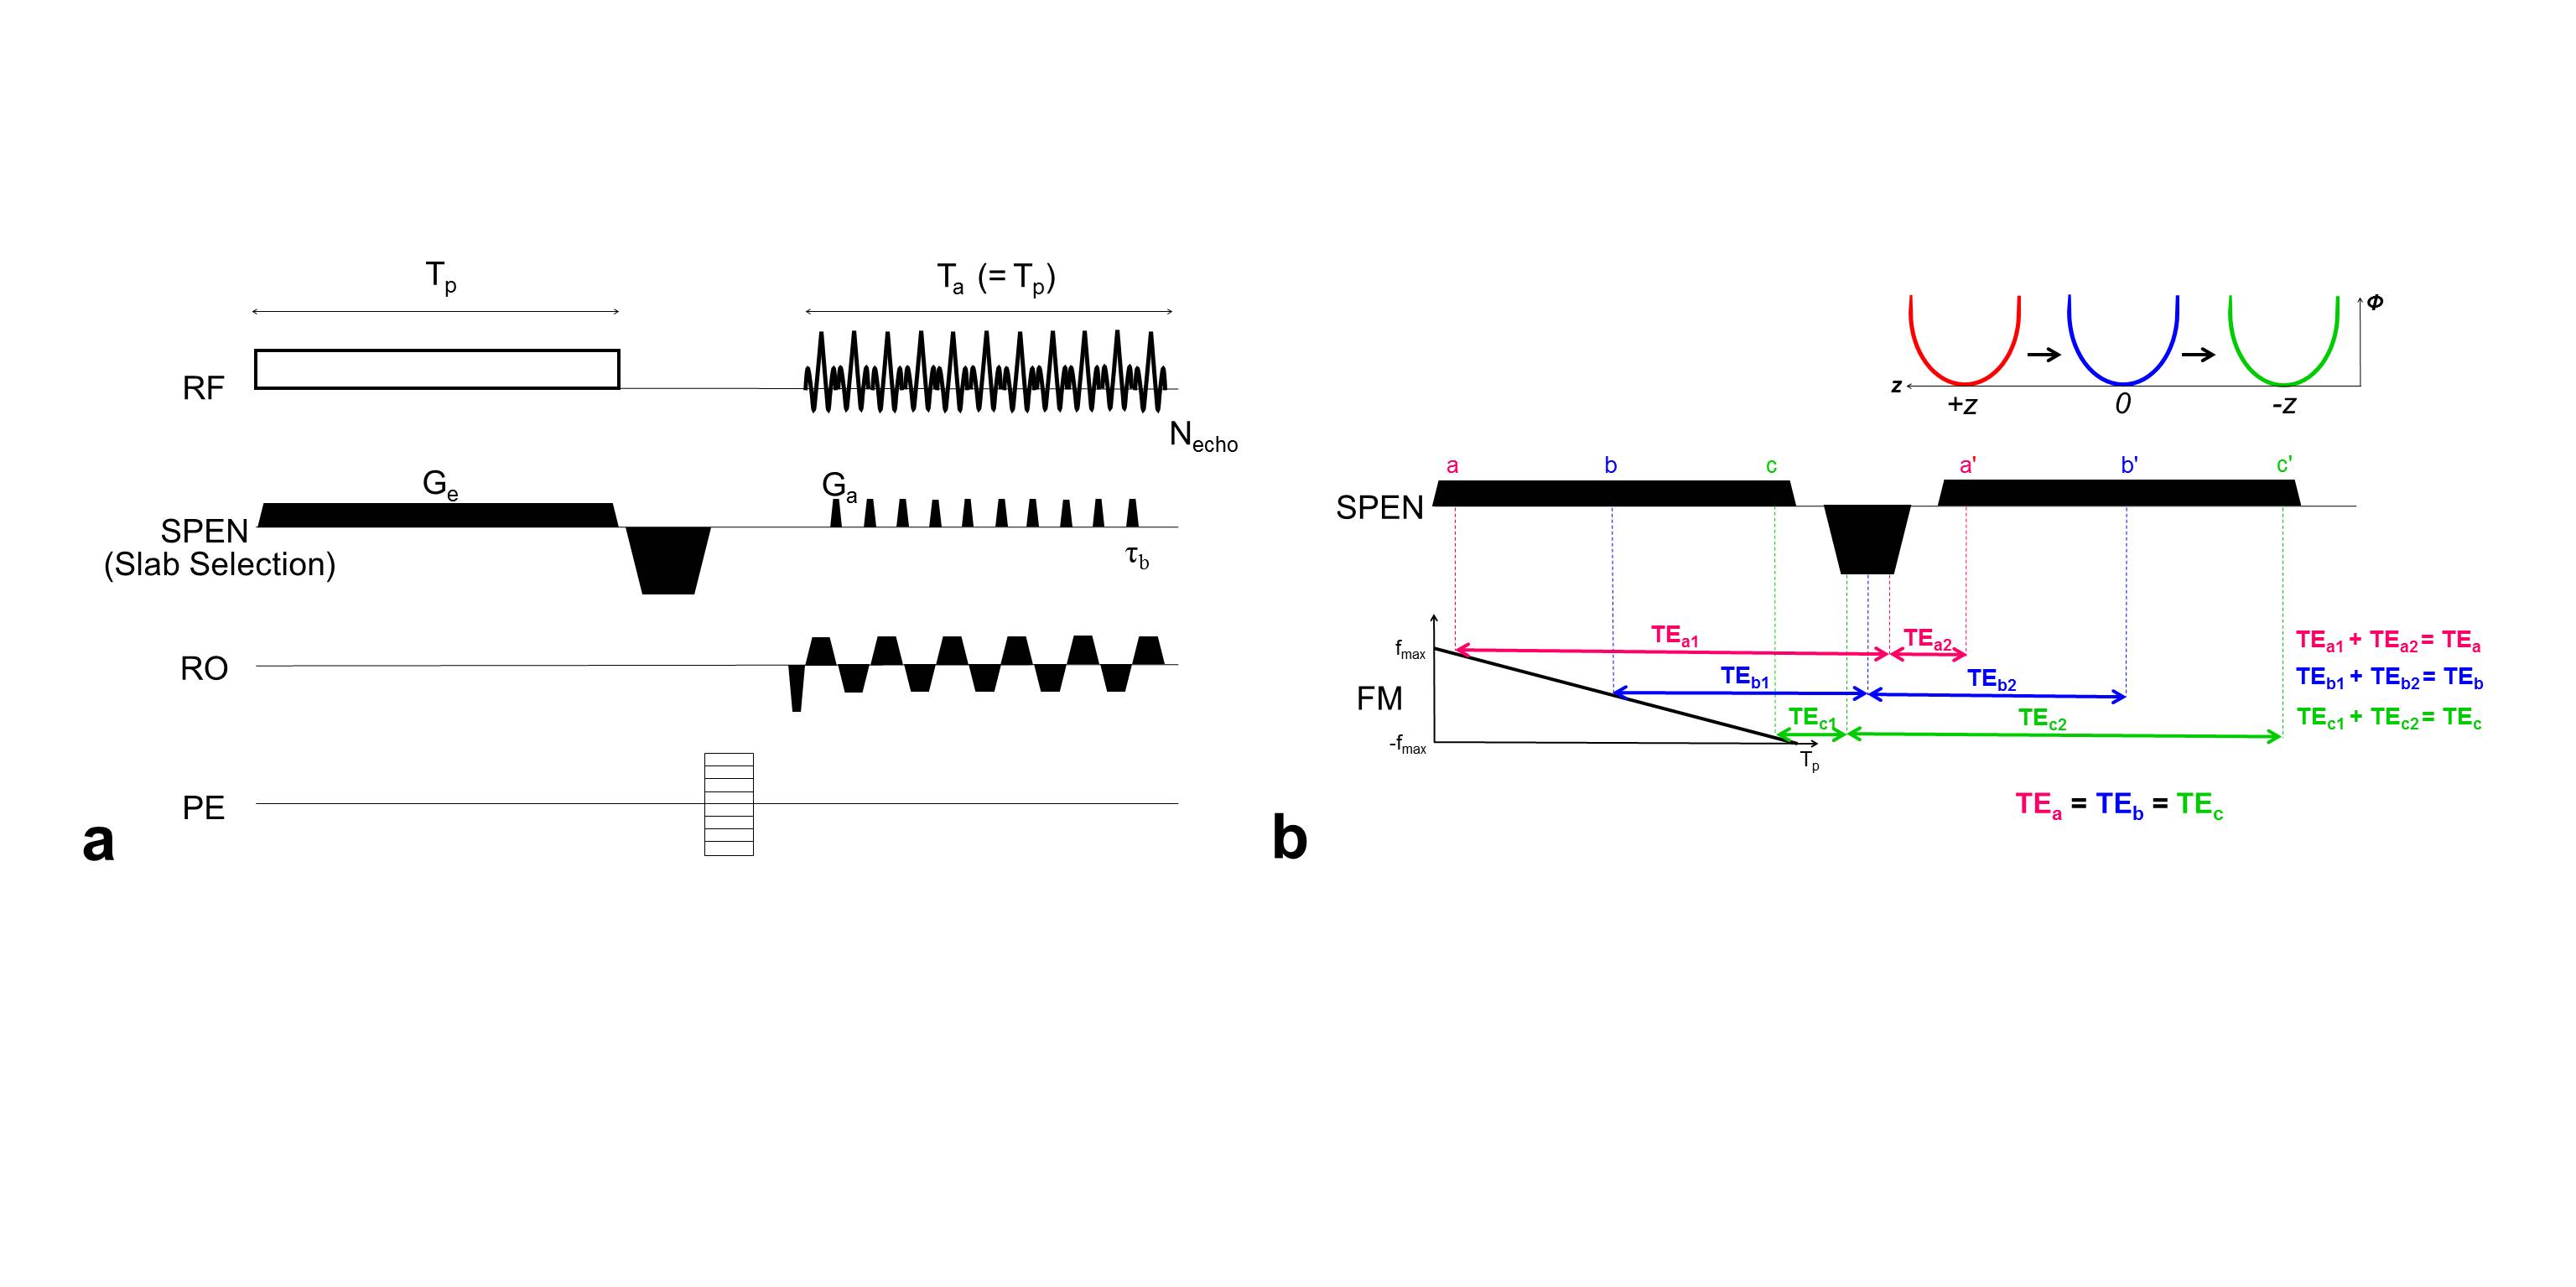
RASE-II sequence diagram(a) and schematic
description of its sequential and local excitation and rephasing mechanism in
the SPEN direction(b). In RASE-II, the excitation duration of the chirp pulse(Tp) is set to be same as total
acquisition time(Ta) having
a rephasing gradient between them. As shown in (b), all the spins experience
the same TE in a way that spin isochromats excited first are rephased first(red colored a, a’) and the ones excited late are rephased late(green colored
c, c’). The slab-selective(SS) direction was set to be the SPEN direction. RF:Frequency-swept chirp pulse, Ge:Excitation gradient, Ga:Acquisition gradient, RO:Read-out direction, PE:Phase-encoding direction.
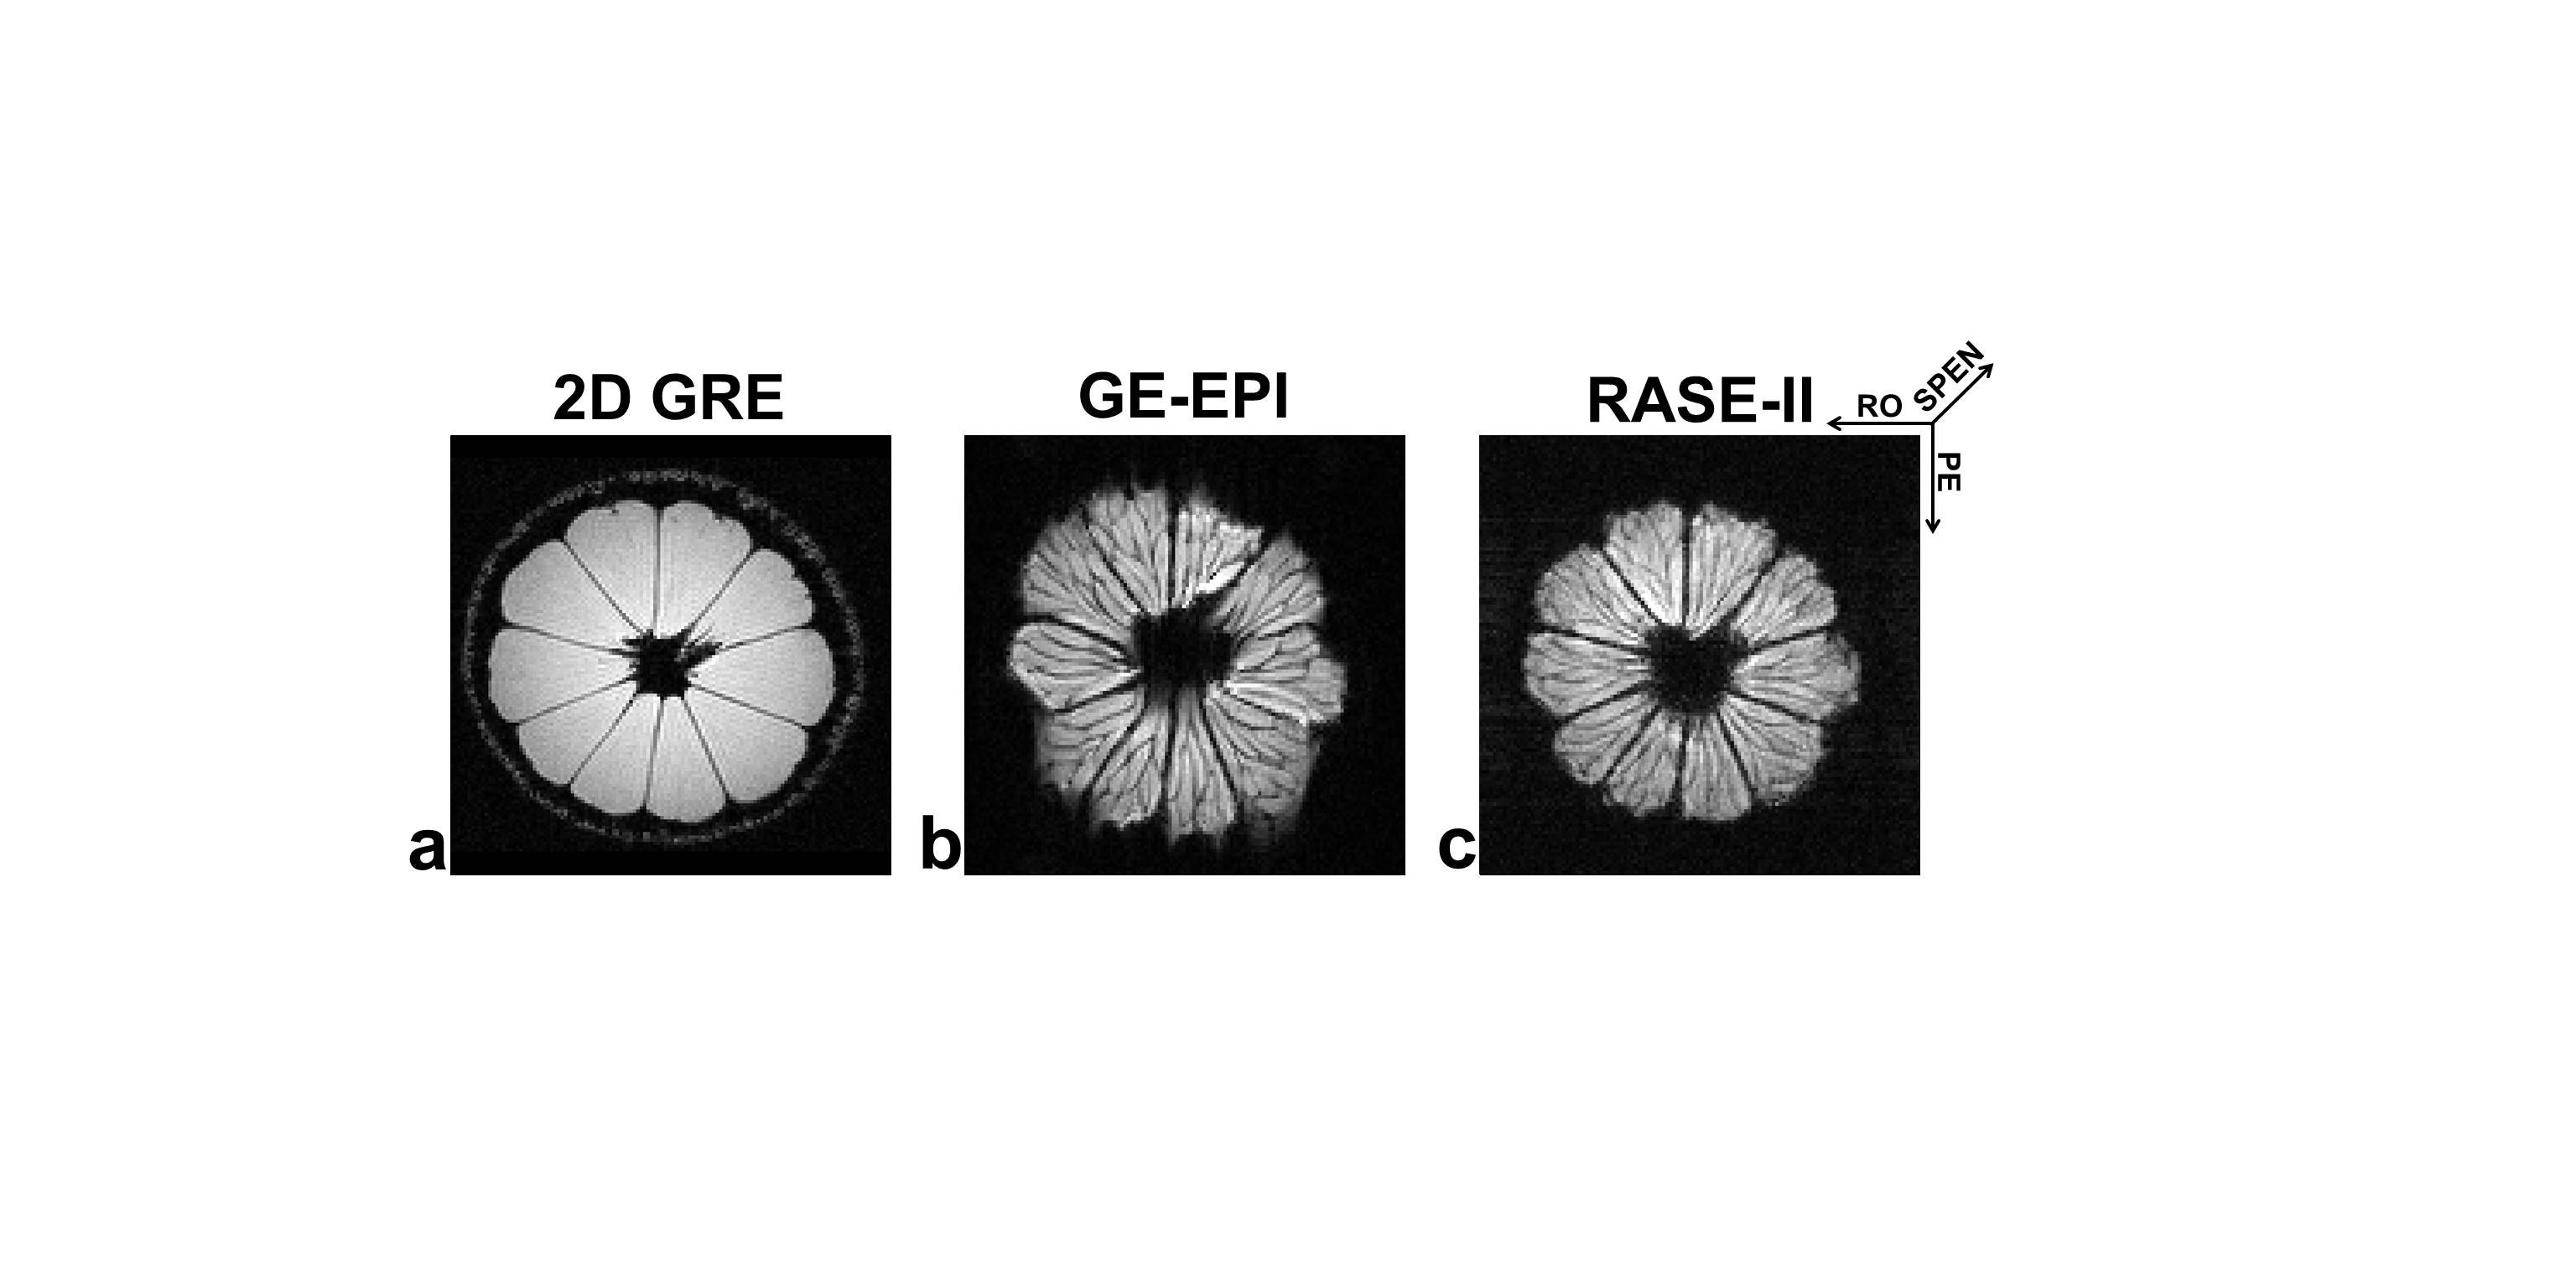
Axial slices of high-resolution lemon images
acquired with 2D GRE (a), GE-EPI (b), and RASE-II (c). The SPEN direction of
RASE-II as a slab-selective direction is through the plane. The two axes of
images have phase-encoding and read-out directions. RASE-II shows better image quality with less distortion than GE-EPI because of higher tolerance to field inhomogeneites due to larger gradient
amplitudes as well as less T2*
effects due to local rephasing mechanism in the SPEN direction.
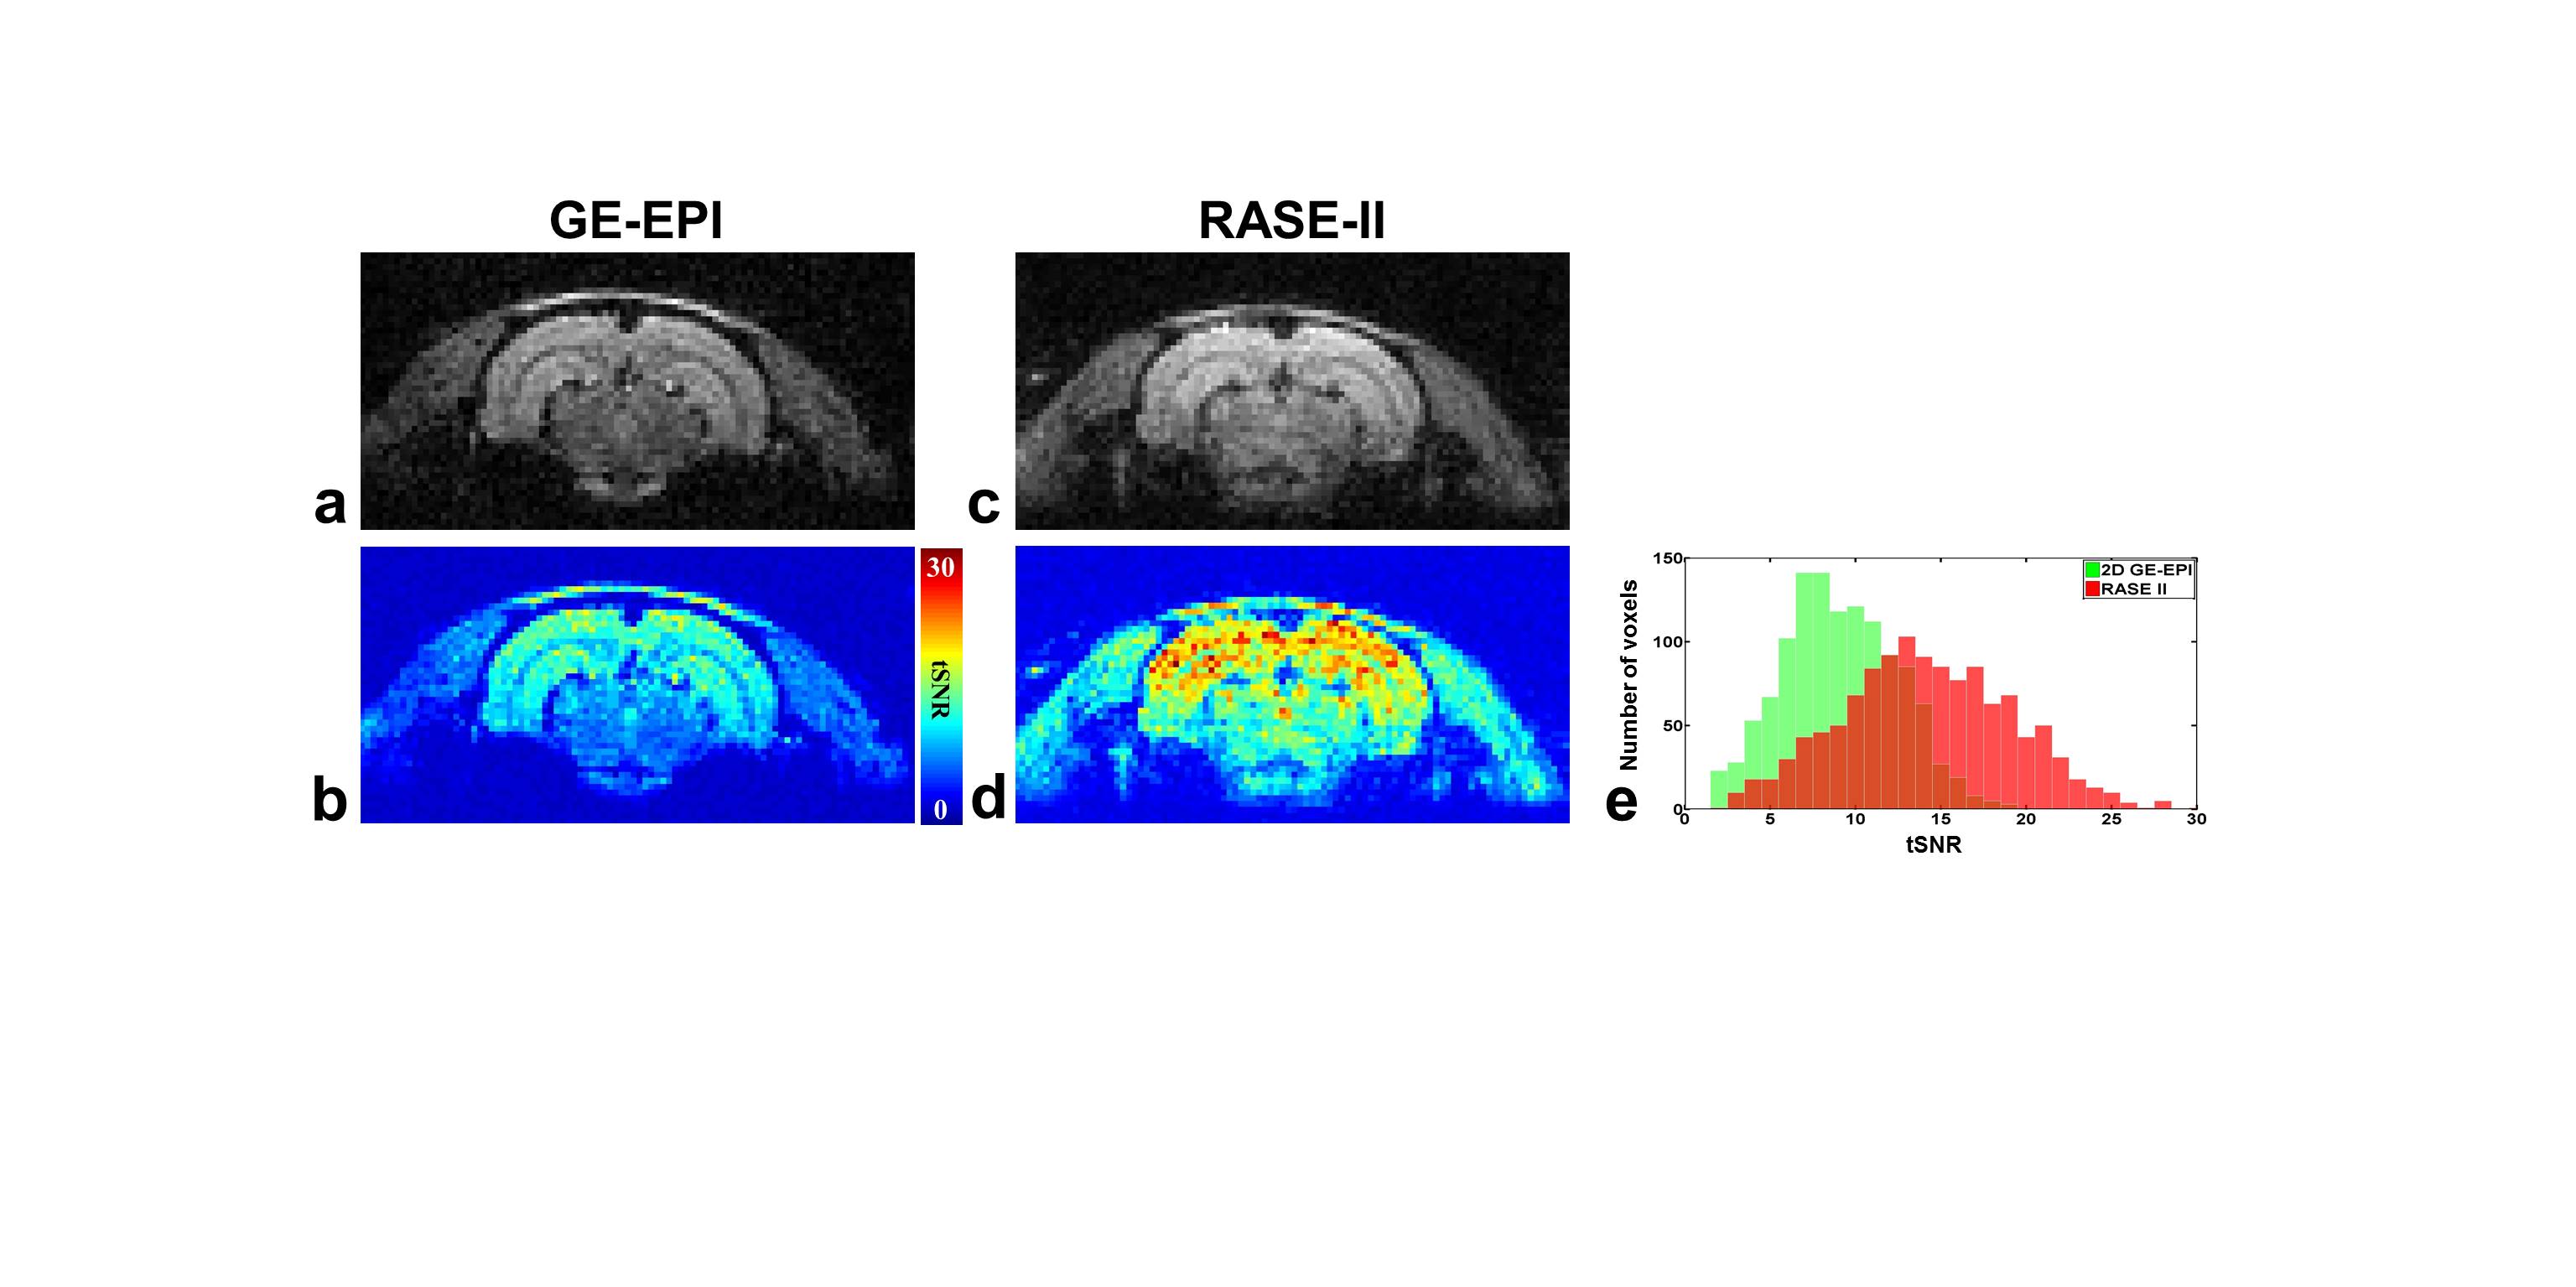
The top row shows the axial
images of in-vivo rat brain from
GE-EPI (a) and RASE-II (c). The bottom row shows the tSNR map acquired from time series of each pixel in GE-EPI (b) and
RASE-II (d). As whon in (b) and (d), tSNR of RASE-II was overall
higher than that of GE-EPI. For better
representation of tSNR improvement, a
histogram of tSNR distribution is
also displayed in (e). The range of the tSNR
value was between 0 and 30.