1497
Territorial Arterial Spin Labeling by Using Asymmetrically RF-shimmed Labeling Pulse with 4-channel RF Transmit at 3T1Healthcare Business Unit, Hitachi, Ltd., Tokyo, Japan
Synopsis
Territorial ASL (tASL) using asymmetrically RF-shimmed labeling pulse was proposed. By using 4-channel RF transmit coil, spatially asymmetric transmission was applied to pCASL pulse. Proposed method does not require longer duration of RF pulse. Also, by using knowledge of B1 map, appropriate scaling was applied to the tASL image, and labeling efficiency was consistent between nonselective ASL and tASL. Proposed method was implemented to a 3T MRI system, and demonstrated tASL in-vivo by a volunteer study. tASL of RICA, LICA, and VBA was imaged.
Purpose
The purpose of this study is imaging blood perfusion from each internal carotid artery (ICA) and vertebral basilar artery (VBA) by using regional RF shimming with 4-channel RF transmit coil at 3T.Introduction
Territorial arterial spin labeling (tASL1, 2) selectively visualize blood perfusion of right and left ICA (RICA and LICA) and VBA. In tASL, 2D excitation is used to selectively label blood flow from each blood vessel. However, 2D excitation needs longer duration of RF pulse. In pseudocontinuous ASL (pCASL), shorter interval of labeling pulses is required for efficiently labeling blood. And 2D excitation may degrade labeling efficiency due to its longer duration. Recently, regional RF shimming3-5 using 4-channel RF transmit coil is proposed to decrease SAR and improve spatial homogeneity of RF pulse in specific region. And regional RF shimming was also applied to selective TOF6. In this study, we applied asymmetrically RF-shimmed labeling pulse in 3D ASL imaging to selectively visualize blood perfusion from RICA, LICA, and VBA. The presented method is expected to visualize blood perfusion from each blood vessel without using longer interval of labeling pulse and with information of B1 maps.Materials and Methods
Experiments
Experiments were conducted using 3T whole body MRI system (Hitachi, Ltd.). B1 maps were acquired using 4-channel RF transmit and receive coil. A 15-channel receive only head coil was used for 3D ASL scan.
Calculation of RF shimming parameters for labeling pulse
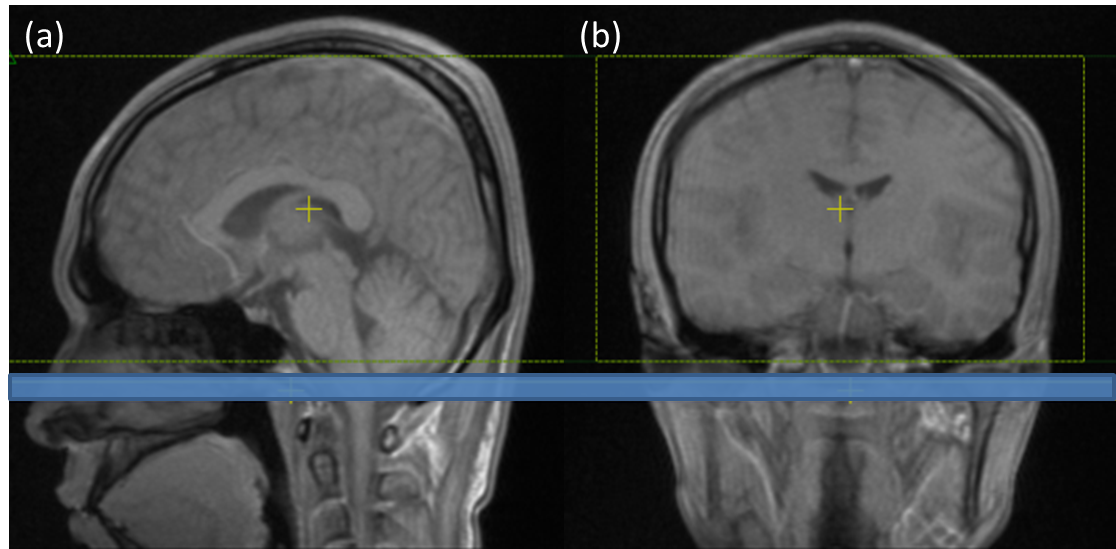
Figure 1 shows the slice of labeling pulse with blue rectangle. B1 map at the slice was acquired with multi Td method7, 8. RF shimming parameters were calculated as follows. Set three ROIs (ROIL, R, V) at the locations of two ICAs and VBA. The size of ROIs was 23 mm × 23 mm.RF shimming parameters were determined to minimize B1 in two of the three ROIs, subject to B1 in another ROI is higher than 0.8 times mean of B1 with QD transmission.Three RF shimming parameters were calculated to selectively visualize tASL of RICA, LICA, and VBA.
3D ASL scan
A healthy volunteer after obtaining written informed consent in accordance with our IRB guidelines was evaluated. Scan parameters were as follows; labeling time and post labeling delay was 1500 msec, the interval of pCASL pulses was 1300 µsec, flip angle of pCASL pulse was 35°, and matrix was 64 x 64 x 20. 3D fast spin echo was used as readout sequence. The labeling pulse was applied to RICA, LICA, and VBA. For comparison, nonselective ASL was also acquired.
Calculation of tASL image
B1 at each ROI was calculated for three B1 maps corresponding three RF shimming parameters to calculate tASL by solving equation (1).
$$\left(\begin{array}{c}ASL_1 \\ ASL_2 \\ASL_3 \end{array}\right) = \left( \begin{array}{c} B_R^1 & B_L^1 & B_V^1\\ B_R^2 & B_L^2 & B_V^2 \\ B_R^3 & B_L^2 & B_V^2 \end{array}\right)\left(\begin{array}{c}ASL_R \\ ASL_L \\ASL_V\end{array}\right) \left(1\right)$$
Where ASLi are ASL image acquired with i-th (i=1,2,3) RF shimming parameter. ASLR,L,V are tASL image of RICA, LICA and VBA. BiR,L,V is B1 of i-th (i=1,2,3) RF shimming parameter at RICA, LICA, and VBA.
Evaluation
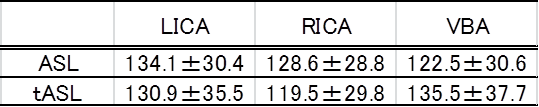
Signal intensity of nonselective ASL and tASL image was evaluated. Mean and standard deviation of signal intensity in the territory of RICA, LICA, and VBA was compared between nonselective ASL and tASL.
Results and Discussions
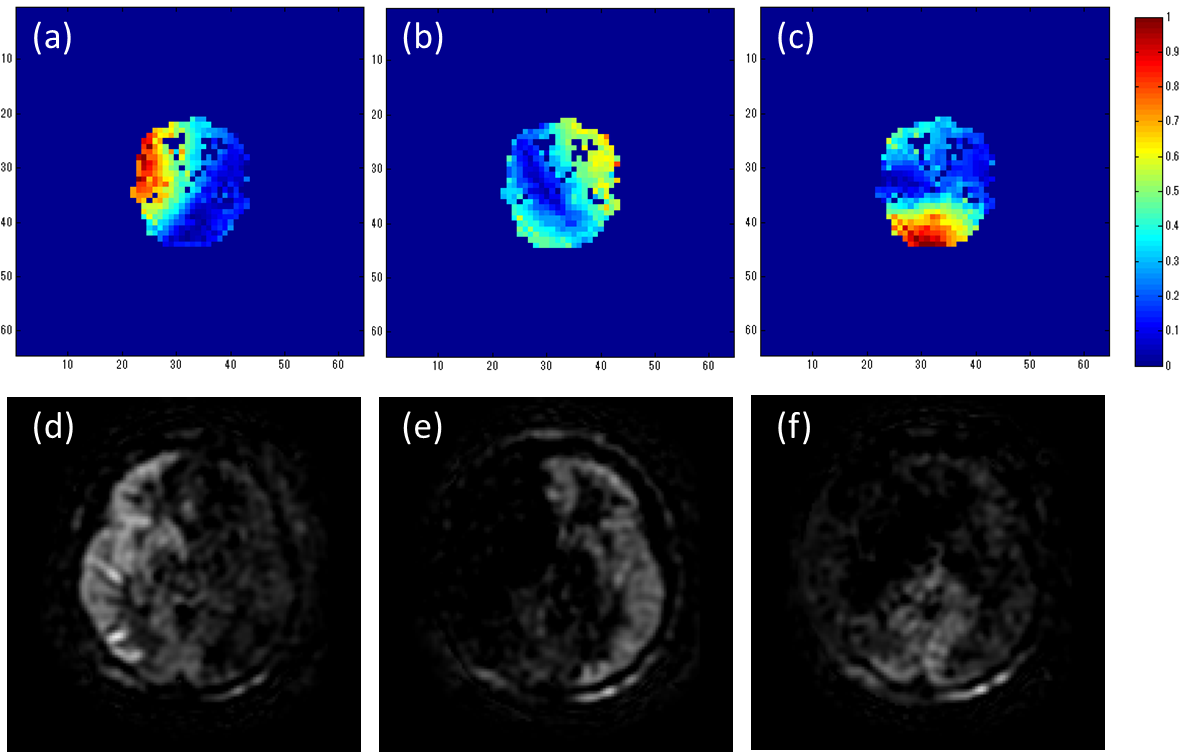
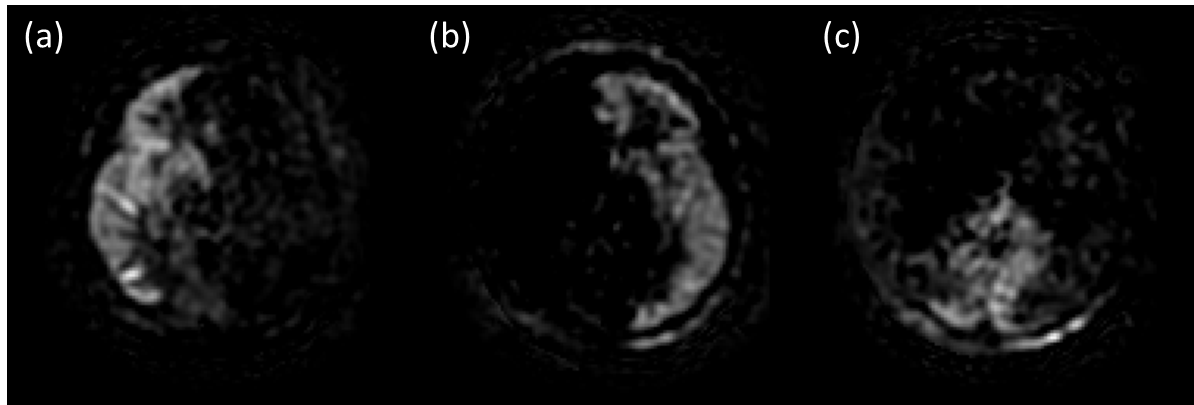
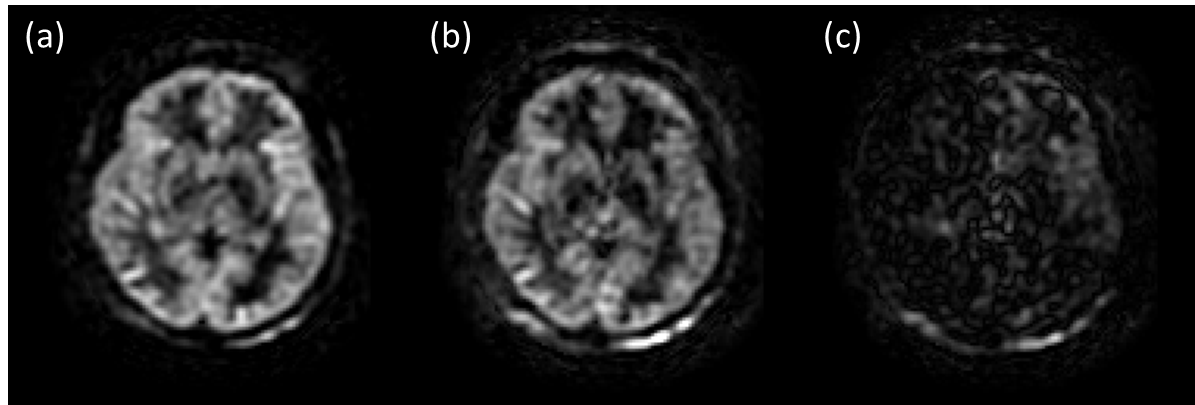
Figure 2 shows B1 maps at labeling slice. Spatially asymmetric B1 distribution is achieved in all cases. However, B1 in VBA region in Figure 2 (a) and (b) is small but not zero, and small signal in VBA region in ASL image is visualized in Figure 2 (d) and (e). Figure 3 shows tASL of RICA, LICA, and VBA calculated by equation (1). Territory of each artery was clearly visualized and the small signal in VBA region was almost disappeared. Figure 4 shows nonselective ASL image, sum of tASL images, and difference between the two ASL images. The two ASL images were similar, and the difference was small. In table 1, signal intensity of each artery was summarized. Signal intensity was almost same between nonselective ASL and tASL for RICA, LICA, and VBA. The reason of this consistency between nonselective ASL and tASL is appropriate scaling was applied by using information of B1 map in solving equation (1). And same interval of pCASL pulses between nonselective ASL and tASL also affected the consistency.Conclusions
Territorial ASL by using asymmetrically RF-shimmed labeling pulse was presented. The results demonstrates this technique visualize perfusion from RICA, LICA, and VBA selectively.Acknowledgements
No acknowledgement found.References
[1] Nigel P. Davies et al. MRM 2003; 49: 1133-1142. [2] Bing Wu et al. ISMRM 2016; 24: 2876 [3] K. Ito et al. ISMRM 2014; 22: 942. [4] Y. Kaneko et al. ISMRM 2013; 21: 2756. [5] Y. Kaneko et al. ISMRM 2015; 23: 3132. [6] K. Ito et al. ISMRM 2016; 24: 3836. [7] K. Ito et al. ISMRM 2013; 21: 2598. [8] K. Ito et al. ISMRM 2013; 21: 2599.Figures