1495
Rapid background magnetic field inhomogeneity correction in MR-based oxygen imaging1Neurology, Washington Univ. in St. Louis, St. Louis, MO, United States, 2Radiology, Peking University Hospital, Beijing, People's Republic of China, 3Radiology, Washington Univ. in St. Louis, St. Louis, MO, United States, 4Pediatrics, Washington Univ. in St. Louis, St. Louis, MO, United States
Synopsis
Quantitative blood oxygenation level dependent (qBOLD) technique provides an invaluable and noninvasive means for mapping brain oxygen extraction fraction (OEF) and R2’ in various neurological disorders. However, background magnetic field inhomogeneity causes errors in the measurement. In this work, we propose a triple echo asymmetric spin echo sequence with imbedded Z-shimming table to measure and correct the adversary effect of the field inhomogeneity. With both simulation and 16 patient image sets, we have demonstrated the effectiveness of the proposed technique.
Introduction
Quantitative blood oxygenation level dependent (qBOLD) technique provides an invaluable and noninvasive means for mapping brain oxygen extraction fraction (OEF) and R2’ (also a widely-used surrogate marker of OEF). These information are important to study neurological diseases with impaired oxygen metabolism. The qBOLD based oxygenation mapping approach relies on the measurement of the susceptibility induced by deoxyhemoglobin (deoxyHb) for OEF and R2’, and this technique suffers from the background magnetic field variation, ΔB. It is challenging to separate the physiological unrelated ΔB effect from those due to deoxyHb. We developed a triple echo asymmetric spin echo (ASE) sequence with an imbedded Z-shimming table to measure and correct the field inhomogeneity simultaneously with the oxygenation imaging.
Methods
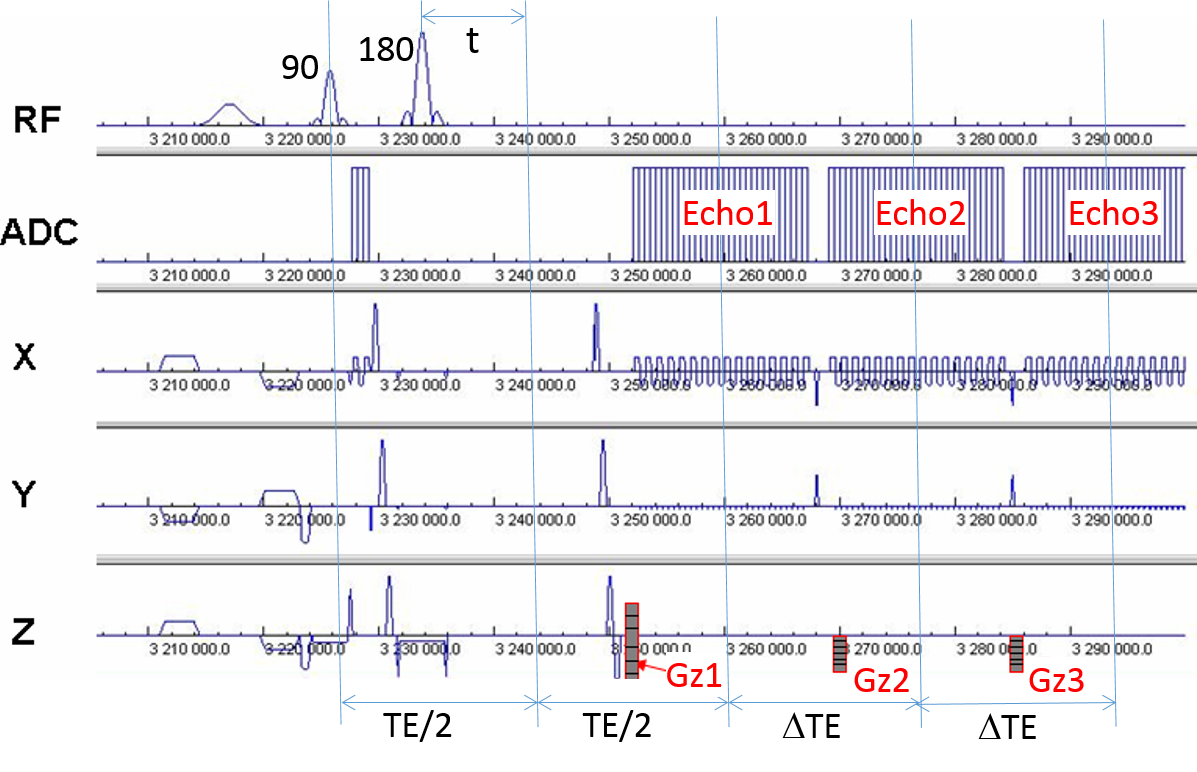
A triple echo ASE EPI technique is developed as demonstrated in Fig. 1. In an ASE sequence, the offset of 180 pulse from TE/2 is denoted as t. The three ASE echoes were acquired at a TE of 41.2 ms, 71.8ms and 102.6 ms, respectively, and t ranges from 0 to 13 ms. This sequence is able to cover a wide range of R2’ decay from a single measurement, resulting in a three-fold improvement in acquisition efficiency compared to a conventional single echo ASE. This sequence was repeated 112 times with varying t. Three Z-shimming tables were applied to echo 1, 2 and 3, respectively (Gz1,Gz2 and Gz3 in Fig 1). The 8 steps Z-shimming tables were only applied in measurements with a specific t. In combination with the three echoes, this sequence can yield 24 sets of images for DB measurements and correction at an expense of 24 seconds.
After accounting for ΔB effect and Z-shimming table, the original qBOLD signal model as developed in [1] is given as, $$$s(t)=c\cdot\exp[-R_{2}\cdot T_{E}-\lambda\cdot fc(\delta\omega\cdot 2t)]\cdot sinc[(\gamma\cdot 2t\cdot\triangle B+G_{z}\cdot T_{h})/2\pi]$$$ (Eq. (1)) [2]. Gz is the z-shimming gradient and Th is the slice thickness. ΔB was solved through a nonlinear quasi-Newton, Broyden-Fletcher-Goldfarb-Shannon minimization of the following objective function, $$$(\triangle B,C_{1},C_{2},C_{3})=argmin (\sum_i(s_{i}-C_{1}sinc((\gamma\cdot 2t\cdot\triangle B+G_{z}*T_{h})/2\pi))^2+\sum_j(s_{j}-C_{2}sinc((\gamma\cdot 2t\cdot\triangle B+G_{z}*T_{h})/2\pi))^2+\sum_k(s_{k}-C_{3}sinc((\gamma\cdot 2t\cdot\triangle B+G_{z}*T_{h})/2\pi))^2)$$$ (Eq. (2)). Once ΔB is calculated, OEF, R2’ and some other parameters were solved as the least square solutions to a 2nd order and linear order term approximating the original signal equations (Eq. (1)) [1]. We have performed both simulation study and analyzed real clinical images for evaluation.
Results
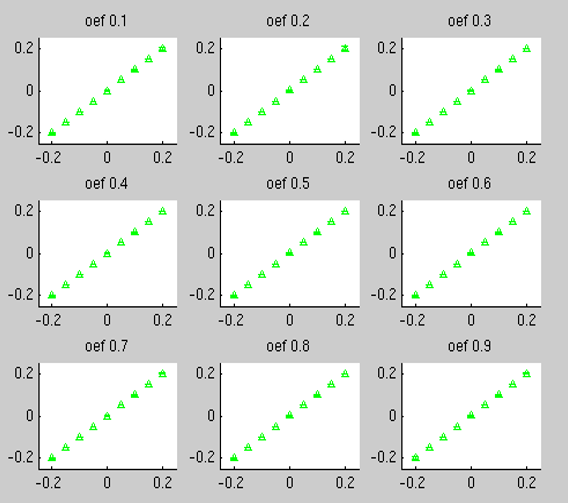
We generated signals across a wide range of OEF (0.1-0.9) and (-0.2ppm - 0.2 ppm) assigned to Eq. (1) with comparable Gaussian noise as measured in realistic images added. The proposed solver (Eq. (2)) was able to recover ΔB values accurately (Fig. 2).
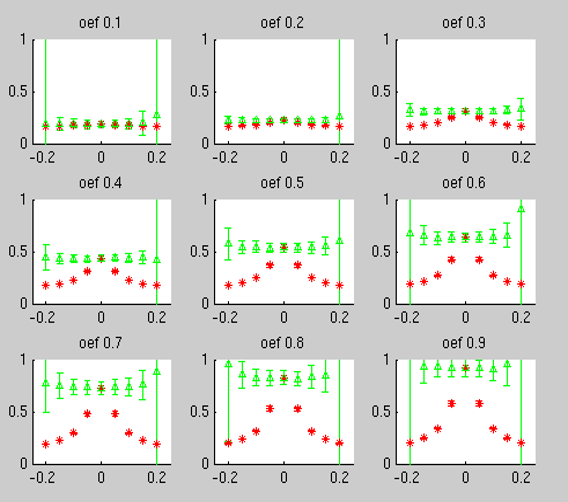
Using the simulated signals, we compared the OEF results by neglecting and including the ΔB effect, and the results are given in Fig. 3. Except at an extreme OEF (such as 0.1 or 0.9), significantly improved agreement with the ground truth values were obtained after compensating the ΔB effect for OEF in the range of (0.2-0.8).
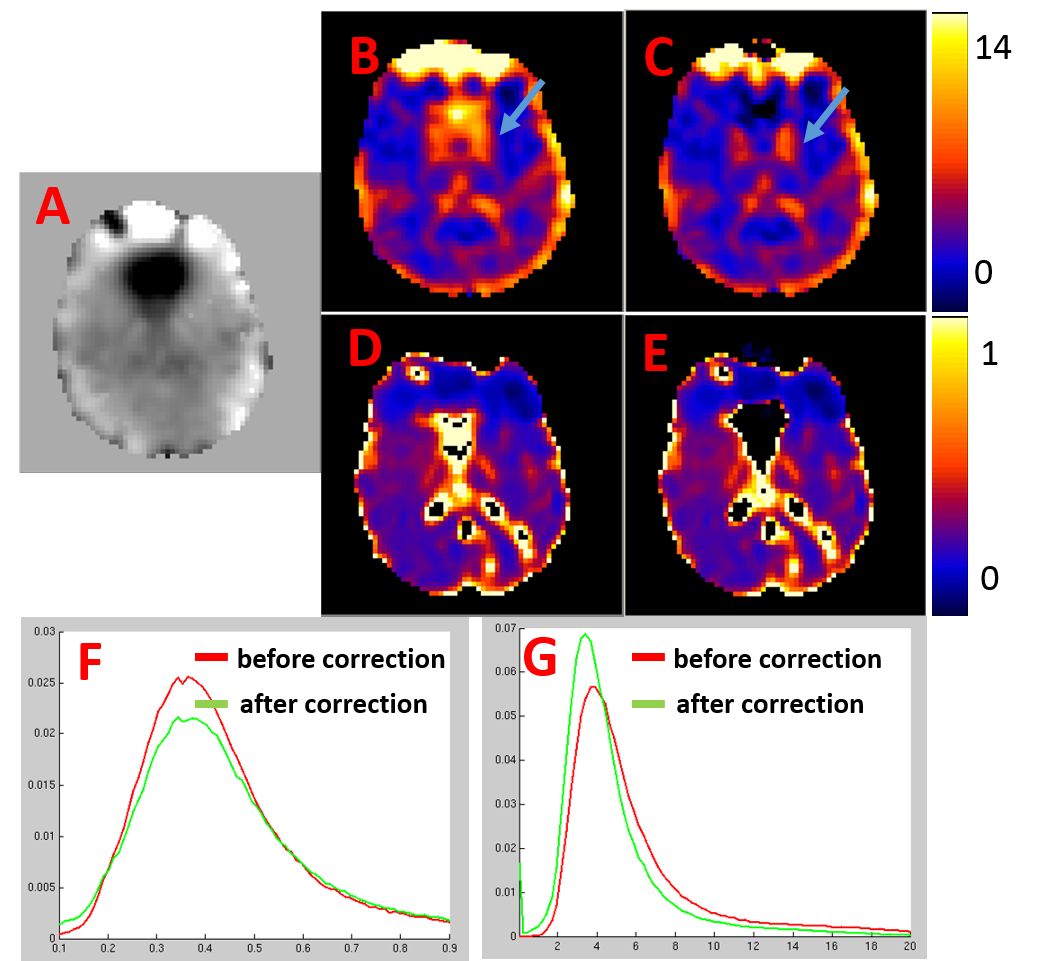
Moreover, we further evaluated the proposed technique in 16 subjects. One slice of ΔB (A), R2’ (B and C for before and after correction), OEF (D and E for before and after correction) maps were given for one subject in Fig. 4. The histograms of OEF and R2’ after pooling all the voxels from all the subjects were given in Fig. 4F and 4G. ΔB's effect is more dramatic on R2' than on OEF. After ΔB correction, the R2' histogram shifted towards left (Fig. 4).
Discussions and Conclusions
Our methods have several distinct advantages. First, this method is flexible. There is no need that a Z-shimming gradient perfectly matches the ΔB. Instead, these Z-shimming table signal was used to generate signal variations that only pertain to ΔB so that signal from deoxyHb and ΔB can be separated. Second, this method is rapid. With an 8 step Z-shimming table, only 24 seconds are needed to generate 24 data sets to estimate and then correct for ΔB. Third, there is no loss of SNR in the acquired images, while the tailored RF excitation and the high spatial resolution methods suffer from reduced SNR. Fourth, the ΔB estimation and correction are all accomplished using a single data set without potential geometry mismatch between an ASE and a separate high resolution 3D gradient echo sequence as proposed before.
In summary, we have developed and validated a rapid ΔB estimation and correction method using a triple echo ASE with three Z-shimming tables and a joint MR imaging post processing technique. It is able to compensate the background field inhomogeneity and measure brain oxygenation simultaneously.
Acknowledgements
Funding support NIH 1R01NS082561.References
[1] Dmitriy A. Yablonskiy, Quantitation of Intrinsic Magnetic Susceptibility-Related Effects in a Tissue Matrix. Phatom study. MRM 39:417-428 (1998)
[2] Hongyu An and Weili Lin, Cerebral Oxygen Extraction Fraction and Cerebral Venous Blood Volume Measurements Using MRI: Effects of Magnetic Field Variation. MRM 47:958–966 (2002)
Figures