1492
On the Influence of Intra-Voxel Dephasing in FISP-MRF with Variable Repetition Time1Medical Physics in Radiology, German Cancer Research Center (DKFZ), Heidelberg, Germany, 2Institute for Forensic Medicine and Traffic Medicine, 3Physikalisch-Technische Bundesanstalt (PTB), Braunschweig and Berlin, Germany
Synopsis
In this
Introduction
Magnetic Resonance Fingerprinting (MRF) is a promising technique for rapid multiparametric imaging [1] that allows high spatial undersampling factors. The quantitative maps can be reconstructed by comparing the measured data to precomputed simulations [1]. A correct and accurate reconstruction of the relaxation times requires, firstly, varying sequence parameters to create unique signal evolutions for every tissue (fingerprints) and, secondly, excellent agreement between simulation and measurement. Intra-voxel dephasing is frequently neglected in the simulation models, but some tissues are inherently prone to strongly varying magnetic fields, which can lead to systematic misdetermination of relaxation parameters. In this work we investigate the impact of intra-voxel dephasing on standard FISP-MRF [2] measurements and propose the use of a constant TR, a technique that has been applied in MRF already for other purposes [3], to improve the robustness against locally changing magnetic fields.Background
The MRF principle in conjunction with a FISP-type sequence has been shown to provide robust and accurate quantification of T1 and T2 parameters [2], while seemingly being insensitive to B0 changes [2]. However, large off-resonance distributions, as present at ultra-high fields, do affect parameter mapping as will be demonstrated. The exponential T2* decay of the apparent magnetization is the result of intra-voxel dephasing, where a Lorentzian off-resonance probability distribution is assumed [4].Method
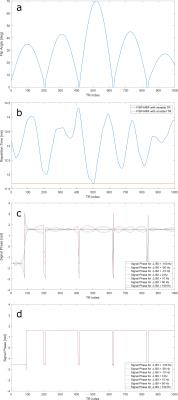
The following Bloch simulations were performed in MATLAB (The MathWorks, USA). Flip angle and the TR pattern in the variable case, were identical to [2] (also displayed in Fig. 1a-b); likewise, the TE was held constant and a sinc pulse (BWTP=8) was used. For the fixed TR, the minimal value of 11.68ms was used, assuming this time is limited by the readout duration and the gradient switching. To replicate T2* relaxation, multiple simulations with different off-resonances in the range of ±100Hz in steps of 0.1Hz were performed. The resulting signals were weighted according to a Lorentzian probability distribution and then summed on a complex basis. In addition, measurements using an agarose phantom doped with Magnevist (Bayer AG, Germany) were performed on a Symphony 1.5T scanner (Siemens, Germany) in combination with a 4-channel head coil. For this detailed investigation, a fully sampled Cartesian MRF sequence without acceleration was utilized, and after each acquisition train a 10 second pause was inserted allowing the magnetization to relax. The linear off-resonance distribution of 8.6Hz/mm was achieved by modifying the shim current along the y-axis.Results
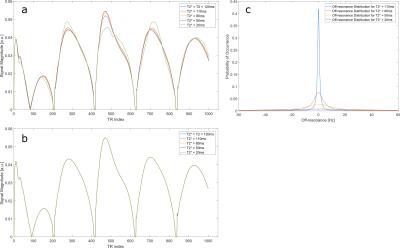
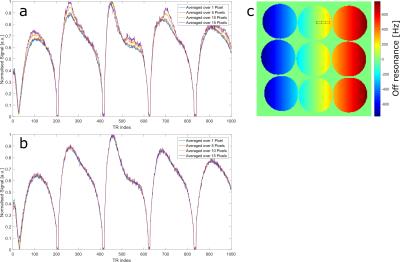
Figure 1c-d shows the simulated signal phase of isochromats (ensembles of spins with a common Larmor frequency) with different off-resonance throughout the acquisition train. For the MRF pattern with varying TR, a dependence of the signal phase on the length of the TR becomes apparent, even though a constant TE was used. The signal phase of the free induction decay (fid) signal path remains constant, but the phase of the echo pathways change. Temporal changes of the phase difference between isochromats will cause signal magnitude modulations as displayed in figure 2a & 3a. Figure 1d shows that switching to an MRF-pattern with constant TR generates a temporally constant phase that provides robustness against intra-voxel dephasing (see Fig. 2b & 3b). The dephasing results in a time-constant reduction of the signal magnitude and therefore does not affect parameter determination except for an increased noise level. Figure 3 further emphasizes this effect in a phantom measurement where intra-voxel dephasing was simulated by averaging over increasing areas along the direction of linearly growing off-resonances.
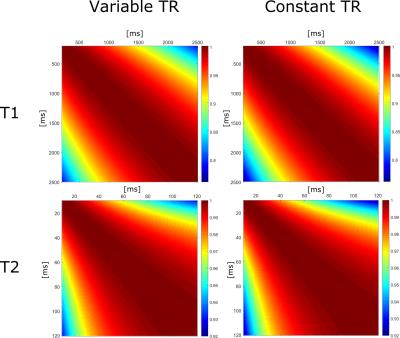
Figure 4 illustrates the correlation between fingerprints, which can be seen as an indication of the encoding capability [5]. Since the correlation between any two fingerprints, for an acquisition with constant TR does not increase, a loss in the encoding capability is not expected.
Discussion
It has been shown that FISP MRF measurements with a variable TR are susceptible to intra-voxel dephasing, which may generate temporal signal modulations that are likely to cause quantification errors in relaxation parameters. This can be alleviated by fixing TR without loss of encoding capability. Even though the correlation matrix is not an absolute measure of the encoding capability [6], it can be used as a relative measure between MRF-pattern of identical length. In addition to the increased robustness, a gain in the efficiency of the MRF measurement can be noted as the small delays within each TR are removed. For the pattern used, this adds up to 1.543 seconds per interleave, which corresponds to a reduction of 11.28% of the acquisition train duration.Acknowledgements
No acknowledgement found.References
[1] Ma D, Gulani V, Seiberlich N, Liu K, Sunshine JL, Duerk JL, Griswold MA. Magnetic Resonance Fingerprinting. Nature 495, 187–192.
[2] Jiang Y, Ma D, Seiberlich N, Gulani V, Griswold MA. MR fingerprinting using fast imaging with steady state precession (FISP) with spiral readout. Magn. Reson. Med., 74: 1621–1631.
[3] Hamilton J, Deshmane A, Griswold MA, and Seiberlich N. MR Fingerprinting with Chemical Exchange (MRF-X) for In Vivo Multi-Compartment Relaxation and Exchange Rate Mapping. In Proceedings of the 24rd Annual Meeting of the ISMRM, Singapore, Singapore, 2016. Abstract 0431
[4] Bernstein MA, King KF, Zhou XJ. Handbook of MRI Pulse Sequences. Academic Pr. Inc
[5] Cohen O, Sarracanie M, Armstrong BD, Ackerman JL, Rosen MS. Magnetic Resonance Fingerprinting Trajectory Optimization. In Proceedings of the 22rd Annual Meeting of the ISMRM, Milan, Italy, 2013. Abstract 0027
[6] Sommer K, Amthor T, Koken P, Doneva M, Börnert P. Towards Judging the Encoding Capability of Magnetic Resonance Fingerprinting Sequences. In Proceedings of the 24rd Annual Meeting of the ISMRM, Singapore, Singapore, 2016. Abstract 0429
Figures

Figure 1:
Figure a-b) show the flip angle and TR pattern used, respectively. Both are identical to the pattern published in [2]. Figures c-d) show the signal phase evolution during the acquisition train for a variable TR (c) and a constant TR (d). For all off-resonances the phase of the first acquisition was normalized to -pi/2.

Figure 2:
Figure a) displays the temporal signal magnitude evolution during standard FISP MRF sequence with variable TR for different T2* values (T1 = 1800ms, T2 = 120ms). Figure b) shows the same plot for a FISP MRF sequence with constant TR. The complex signal vectors in both plots were normalized to an identical norm. The off-resonance distribution for the corresponding T2* values can be seen in c). The simulated range of off-resonances was ±100Hz, but only ±60Hz is displayed in c).

Figure 3:
Figure a) displays the normalized signal magnitude of a FISP MRF sequence with variable TR measured in an agarose phantom with a linear off resonance distribution, as seen in c). b) Shows the signal magnitude for a FISP MRF sequence with constant TR. The averaged areas are indicated by the black boxes in c).

Figure 4:
Correlation matrices with respect to T1 and T2 for FISP MRF with variable and fixed TR. These were calculated as presented in [5]. Although subtle, a general decrease in the correlation between any two fingerprints can be observed for constant TR.