1490
Multiple‑TR neuronal resonance-MRI (NR-MRI) for detection of weak oscillating magnetic field1Department of Bio and Brain Engineering, Korea Advanced Institute of Science and Technology (KAIST), Daejeon, Korea, Republic of, 2Graduate School of Medical Science and Engineering, Korea Advanced Institute of Science and Technology (KAIST), Daejeon, Korea, Republic of
Synopsis
We propose a new approach termed neuronal resonance MRI (NR-MRI) with multiple TRs for detection of weak oscillating magnetic field. NR MRI could detect signals from oscillating magnetic fields with random frequency, phase, and on/off intervals, without synchronization between MR acquisition and neuronal oscillation. The detected signals showed higher SNR with increasing number of dynamic scans, demonstrating that temporal averaging is possible with NR-MRI. Two‑TR approach showed multiple frequency components in an absolute frequency spectrum with no a priori target frequency information while suppressing the systematic noises, which warrants further investigation.
Introduction
Many researchers have tried to use MRI to directly detect neuronal activity, but the detectability is still controversial (1,2). In this work, a novel method termed neuronal resonance MRI (NR MRI) with two repetition‑time (TR) approach is proposed to detect the signals generated by neuronal oscillation directly.Materials and Methods
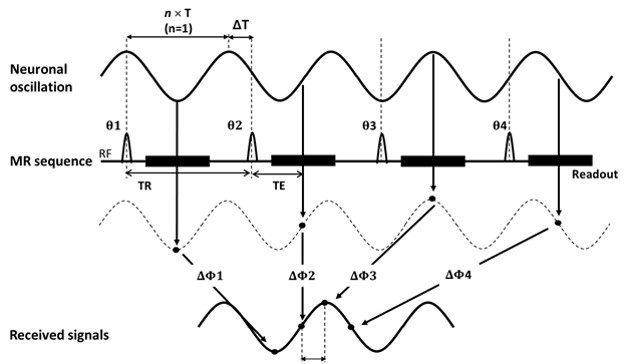
The NR-MRI technique consists of (i) dynamic acquisition with multiple phase offsets between neuronal oscillations and an MRI sequence and (ii) pixel-by-pixel Fourier analysis of the dynamic data (Figure 1). When the relative phase offset between oscillating magnetic field and the MRI sequence is repetitively changed in dynamic images, phase signals induced by the oscillating field are also dynamically changed. The periodic phase signal changes can be analyzed by 1D Fourier transform. Since the dynamic changes of the phase offset depends on the frequency of the oscillating magnetic field, a frequency of interest should be set at first. In order to evaluate the oscillating magnetic field with no a priori frequency information, a strategy of data acquisition at two different times to repeat (TRs) is proposed. Gradient echo echo planar imaging (GE EPI) experiments were performed to distinguish stimulation-induced peaks from systematic noises in a phantom with and without electrical stimulations. The sensitivity of NR-MRI was evaluated at various ΔB (0.5-10 nT), different numbers of dynamic images (1000 – 5000), and various TEs (20 – 55 ms). To evaluate the effect of the frequency and phase changes, stimulation frequency and phase were randomly changed during imaging. The two TR experiments were performed for stimulations with (i) one frequency component of 25Hz and also with (ii) two simultaneously applied frequency components of 10 and 15 Hz. Two TRs of 90 and 91 ms were alternatively applied during every 100 TRs. The dynamic data at each TR were converted into spectrums after temporal Fourier transform, where the frequency dimension was scaled based on the sampling rate determined as remainder of division of the TR by the period of the target oscillation frequency. An absolute frequency spectrum with no a priori target frequency information was also obtained by (i) scaling the two spectra from the two TRs along the frequency dimension (horizontal axis) based on each TR and the period of a frequency of interest, (ii) multiplying the two spectra after a linear interpolation, (iii) selecting the value at the frequency of interest, and then (iv) repeating these procedures in a range of frequencies of interest from 1 Hz to 50 Hz with 1 Hz step. All the spectra from single or two TR were (i) subtracted by the mean value of the background noises, (ii) divided by standard deviation of the background noises, and then mean SNR spectra could be obtained. Default amplitude and stimulation frequency in the middle of the phantom were 5 nT and 25 Hz, respectively.Results
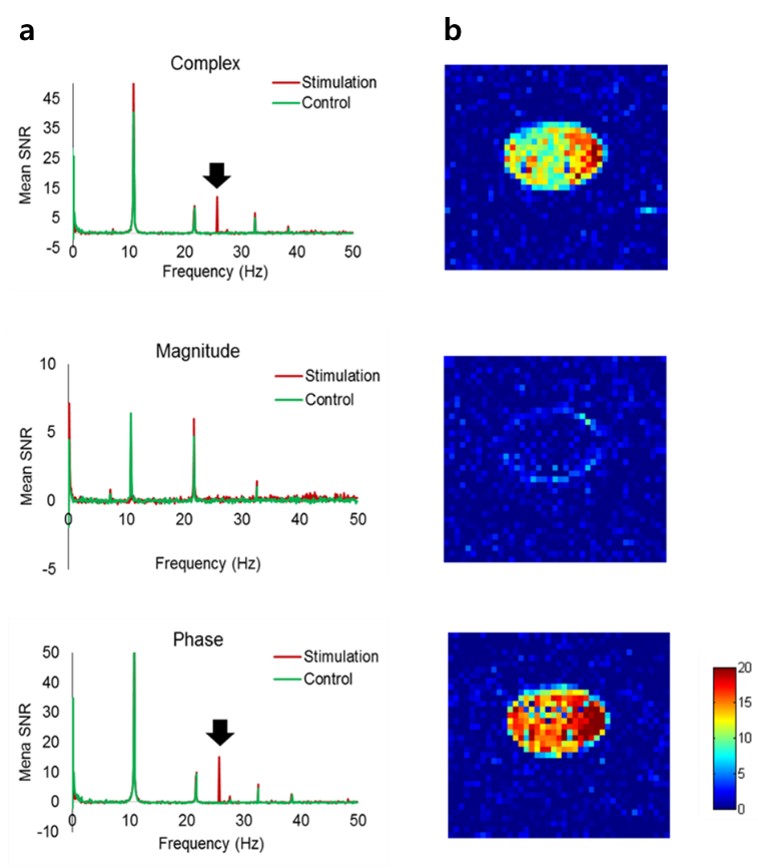
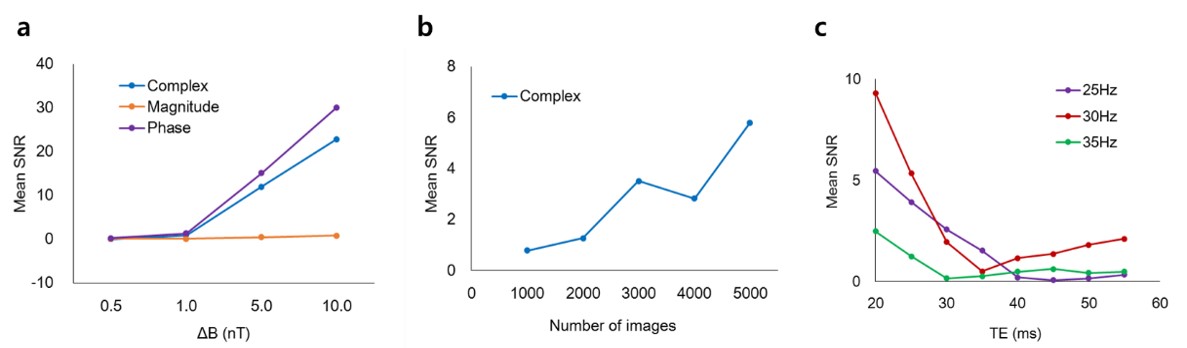
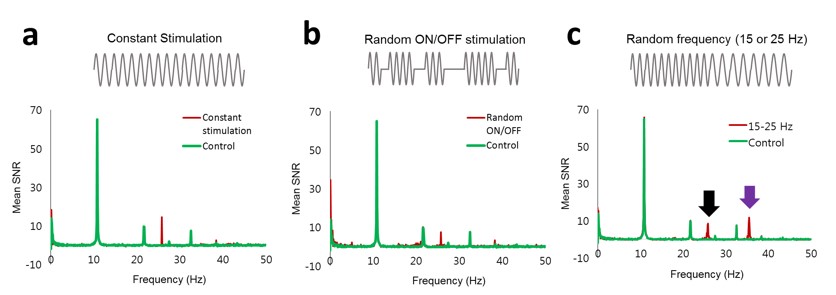
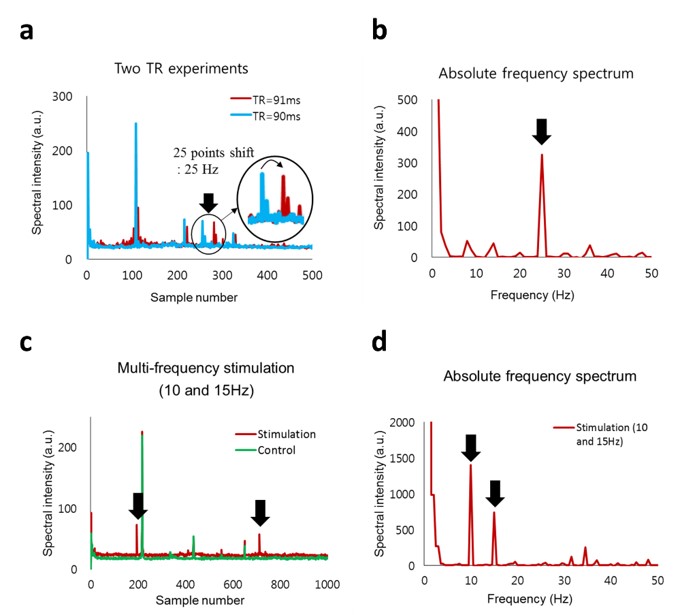
Figure 2 shows representative mean SNR spectra with and without stimulation (25 Hz, 5 nT). The peak produced by stimulation was observable at 25 Hz in complex and phase datasets of the stimulation scan. The peak increased with the stimulation amplitude (Figure 3a) and the number of dynamic scans (Figure 3b), due to temporal averaging effects. SNR of the peak was also dependent on TE (Figure 3c). When TE was close to the stimulation period (40, 33, and 29 ms for 25, 30, and 35 Hz, respectively), SNR of the peak was close to zero presumably due to the fact that integration of an oscillating field in one period becomes zero (or a constant value). NR-MRI could detect the peak(s) generated by stimulation with random changes in frequency, phase, and on/off intervals (Figure 4). When TR changed from 90 to 91 ms, the peak produced by stimulation was shifted in the amount of the stimulation frequency (25 Hz, corresponding to 25 points) (Figure 5a). The absolute frequency spectrum from the two TRs highlighted the peak, while suppressing many other frequency components (Figure 5b). When stimulation with two different frequencies were applied, the absolute frequency spectrum highlighted two peaks at 10 and 15 Hz with no aliasing, while suppressing other systematic noises (Figure 5d).Discussion and Conclusion
NR MRI could detect signals from oscillating magnetic fields with random frequency, phase, and on/off intervals, without synchronization between MR acquisition and neuronal oscillation. The detected signals showed higher SNR with increasing number of dynamic scans, demonstrating that temporal averaging is possible with NR-MRI. The two‑TR approach showed multiple frequency components in an absolute frequency spectrum with no a priori target frequency information while suppressing the systematic noises, which warrants further investigation.Acknowledgements
No acknowledgement found.References
1. Huang J. Detecting neuronal currents with MRI: a human study. Magnetic resonance in medicine 2014;71(2):756-762.
2. Luo QF, Jiang X, Gao JH. Detection of Neuronal Current MRI in Human Without BOLD Contamination. Magnetic resonance in medicine 2011;66(2):492-497.
Figures