1489
MR Imaging of Magnetic Ink Patterns via Off-Resonance Sensitivity1Radiology, Stanford University, Stanford, CA, United States, 2Bioengineering, Stanford University, Stanford, CA, United States, 3Electrical Engineering, Stanford University, Stanford, United States
Synopsis
Printed magnetic ink creates predictable B0 field perturbations based on printed shape and magnetic susceptibility. This can be exploited for contrast in MR imaging techniques that are sensitized to off-resonance, such as fat-suppressed imaging with spectral presaturation. Magnetic ink therefore has the potential to be used in temporary tattoos for creating MR-visible skin markings of arbitrary shape and size, with applications in surgical planning, radiation therapy, tracking of joint movement, or other image registration scenarios. Here we characterize the susceptibility variations of magnetic ink and demonstrate application for MR-visible skin markings.
Purpose
Magnetic susceptibility differences between materials cause geometry-dependent variations in the B0 field1,2. Magnetic ink used to print bank checks for magnetic ink character recognition (MICR) has a higher iron oxide content than conventional printer ink3, and a much higher magnetic susceptibility than that of water. MR methods sensitive to the susceptibility-induced off-resonance can therefore be used to visualize and identify the ink pattern. Compared with current MR markers (such as Beekley spots), arbitrary MR-visible skin markings may offer advantages in applications such as surgical planning, radiation therapy, tracking of joint movement, or other image registration scenarios. The purpose of this work was to systematically evaluate the ability to see magnetic ink patterns in MRI via B0 field simulations and gradient-echo scans with spectral presaturation pulses in phantom and in vivo.Methods
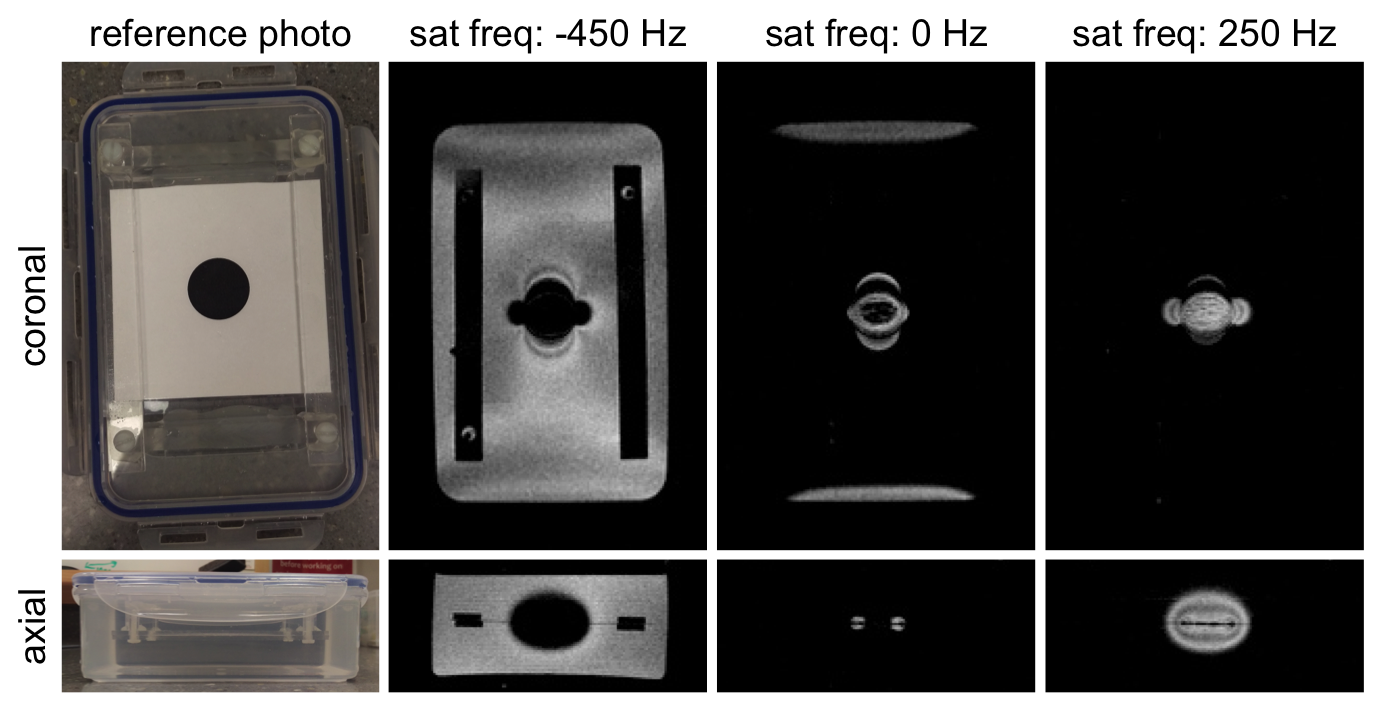
A 1”-diameter circle was printed with MICR toner on standard printer paper, which was trimmed, laminated, and submerged in water (Figure 1). Coronal scans of the phantom were acquired on a GE Discovery MR750 3T scanner with an 8-channel cardiac coil. Two 3D gradient-echo scans (ΔTE = 0.5 ms) with 1 mm isotropic resolution were acquired for B0 field mapping4,5. Gradient-echo scans with a spectral presaturation pulse (590 Hz bandwidth) were also acquired, with the saturation frequency adjusted over the range -500 to 500 Hz.
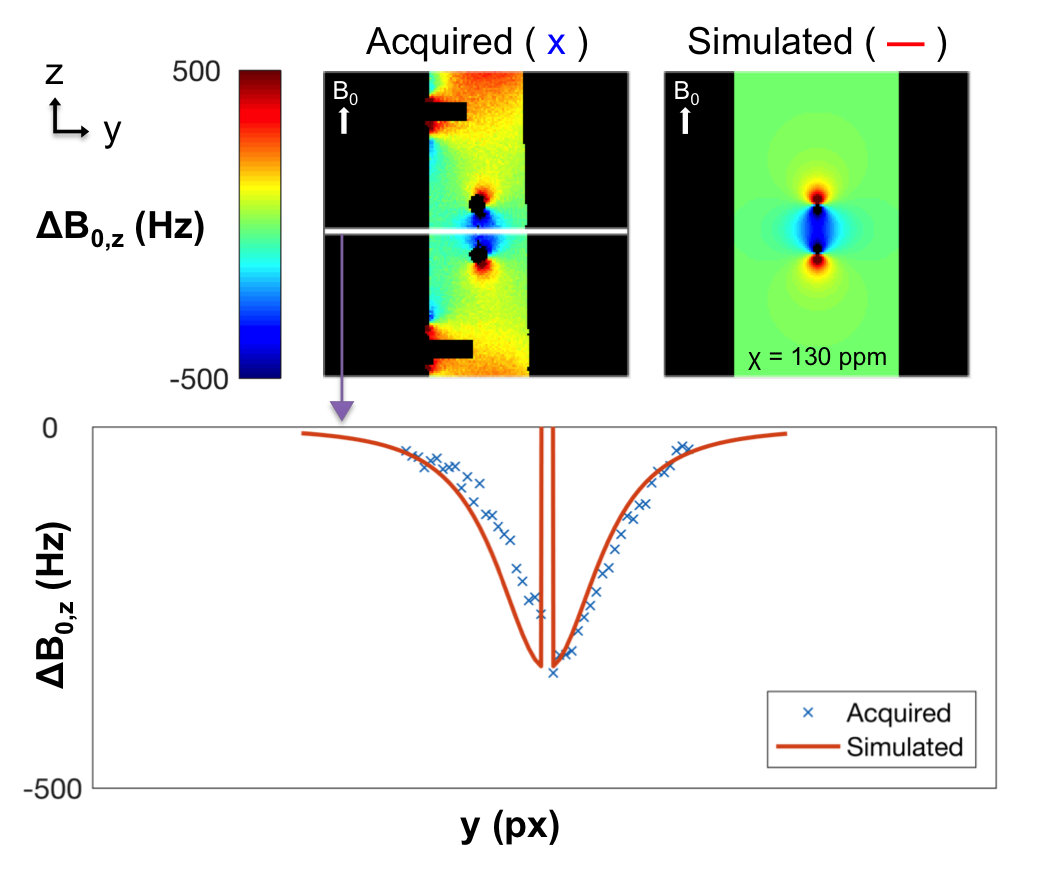
Simulated B0 field maps (1 mm isotropic resolution) were generated by convolving the volume-average magnetic susceptibility distribution (χ) of the ink with a dipole kernel2,6, where χ was chosen to minimize the mean squared error between the acquired and simulated field maps in high-signal areas near the center of the phantom.
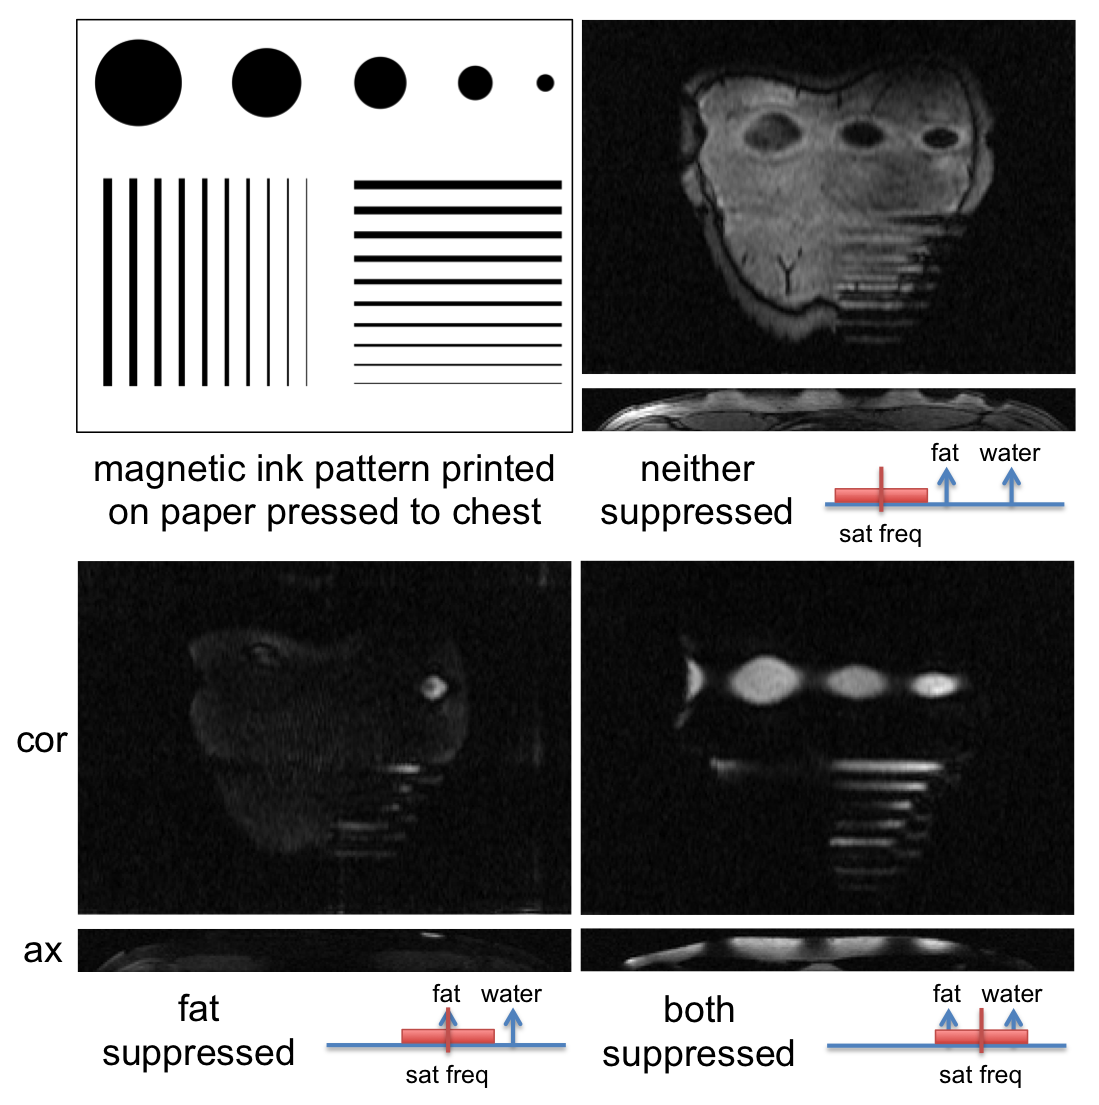
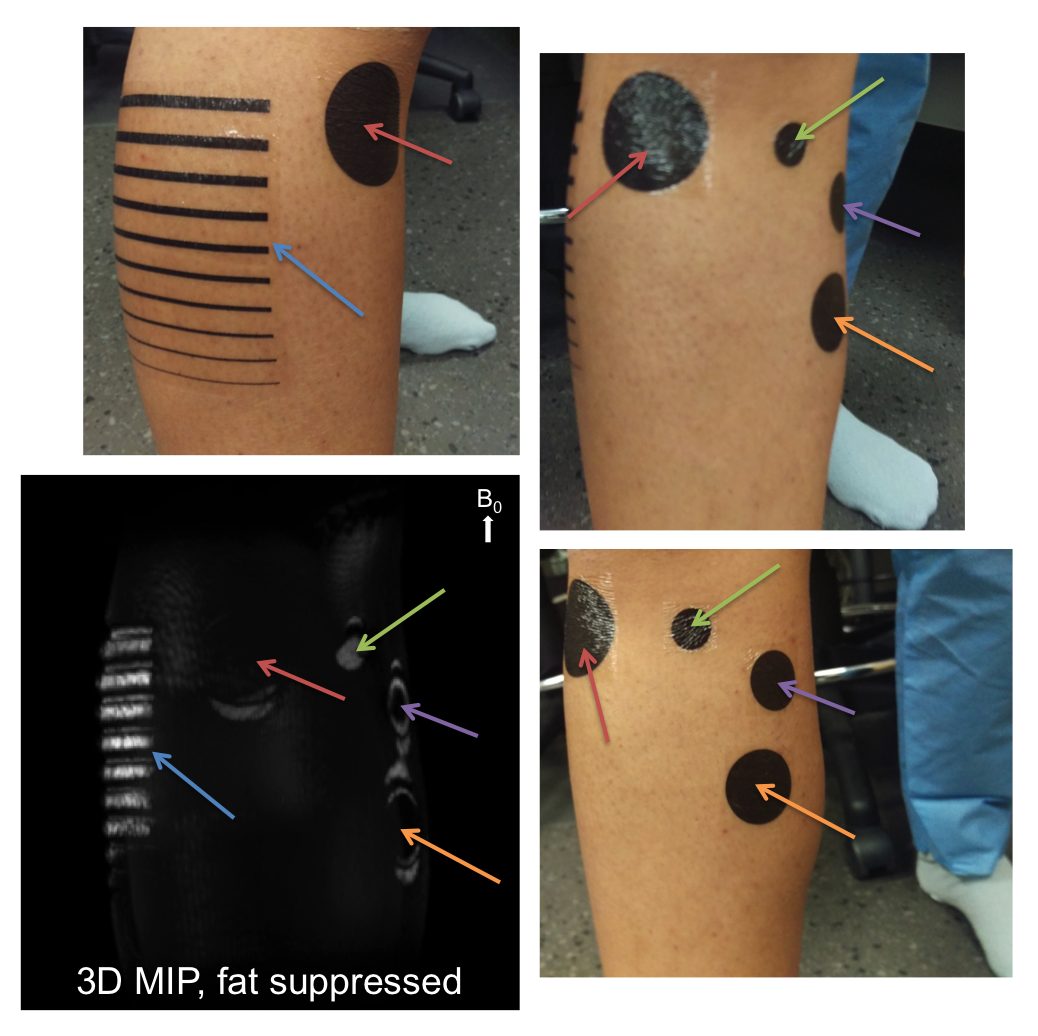
Coronal 3D breath-held gradient-echo scans with saturation pulses tuned to suppress fat, both fat and water, or neither were acquired in a healthy male volunteer with a magnetic ink pattern printed on paper pressed against the skin of his chest. Higher resolution, sagittal 3D gradient-echo scans with saturation pulses tuned to suppress fat, water, or both were acquired in a healthy volunteer with temporary tattoos printed in magnetic ink applied to the skin of the calf (Figure 5).
Results and Discussion
The saturation frequency can be tuned to highlight desired regions of the geometry-dependent B0 distortions due to the ink pattern by specifying the resonance frequencies that are suppressed, producing images with different contrasts (Figure 1).
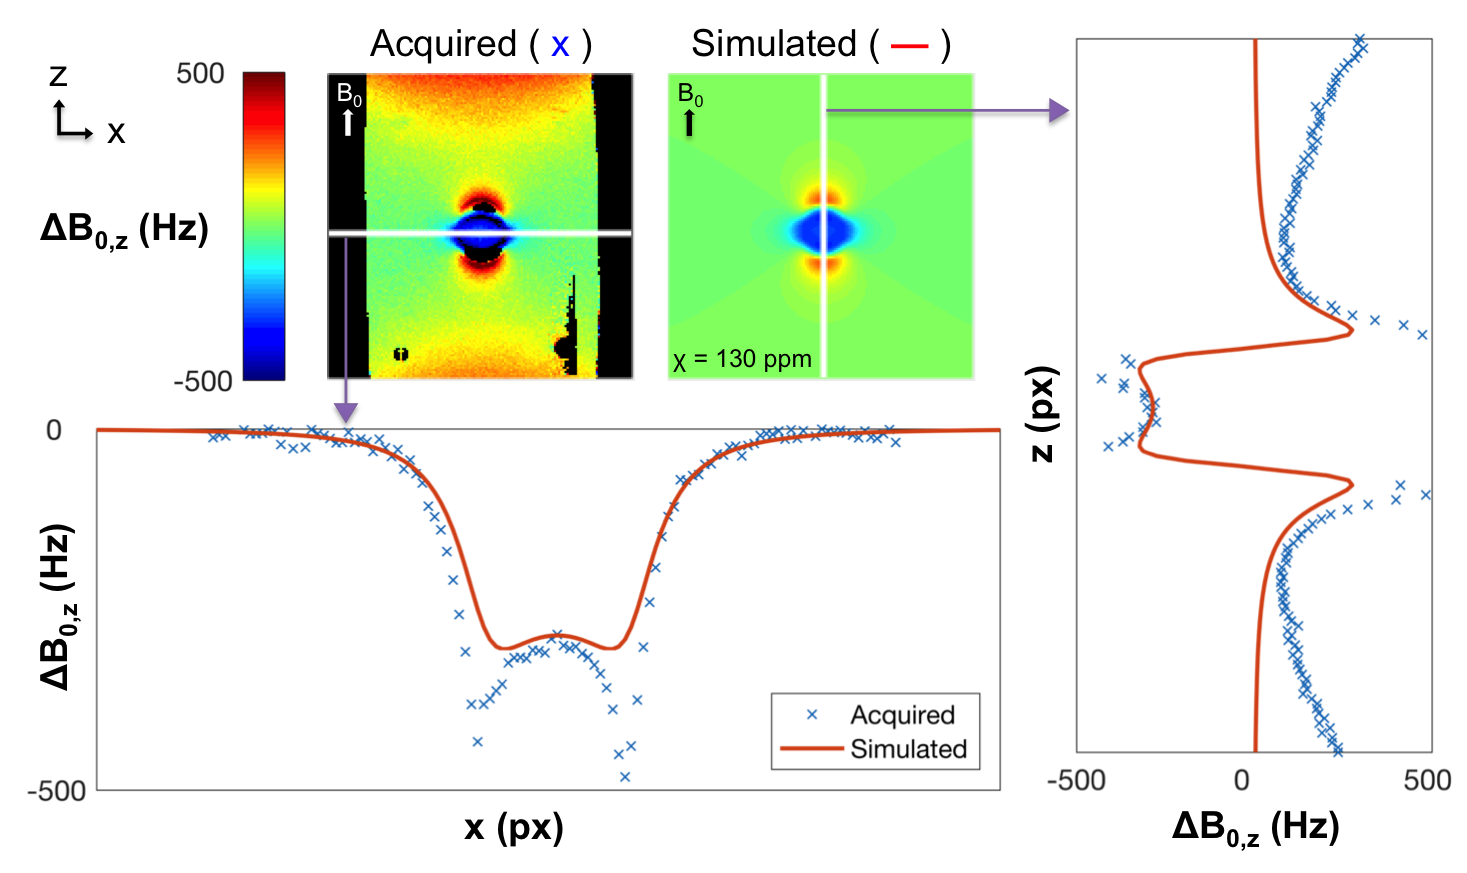
In this phantom, a volume-average estimate of χ=130 ppm minimized the mean squared error. Assuming a 10 μm thickness of ink, this implies χ=13,000 ppm in the ink. Signal line plots comparing the sagittal acquired vs. simulated field maps corresponded well (Figure 2). The signal line plots in the coronal plane corresponded well at the circle’s center, but not at its edges (Figure 3). This discrepancy may be due to the resolution of the simulation. The correspondence also worsened towards the edges of the phantom due to the interface with air.
The field distortions of the magnetic ink pattern pressed to the skin of a human subject were visible with different contrasts as the saturation frequency was adjusted, similar to phantom results (Figure 4). Due to the off-resonance, the pattern was visible in the images where both fat and water were suppressed, and produced signal voids in images where neither was suppressed. The vertical lines in the pattern were not visible because they were parallel to the B0 field. The signal in the patterns was brighter than the other tissues because it came from subcutaneous fat.
The temporary tattoos applied to the calf were visualized with a 3D maximum intensity projection (MIP) of the images acquired with fat suppression (Figure 5). Colored arrows indicate which patterns in the photos correspond to which patterns in the MIP. The patterns appeared brighter than the other tissues because the signal came from subcutaneous fat. However, the visibility of the tattoos varied from one side of the leg to the other, perhaps due to B0 variations across the leg that could be improved with shimming.
Although there have been several reports of tattoos causing burning or heating in MRI7, neither of the scanned subjects reported any heating or burning sensation due to the ink during scanning. Loop-shaped patterns were avoided until a more careful characterization of heating can be performed.
Conclusion
We have shown that arbitrary magnetic ink patterns create predictable field perturbations and are visible in MR images sensitive to this off-resonance. We have also demonstrated the feasibility of using these magnetic ink patterns as temporary tattoos to create MR-visible skin markings.Acknowledgements
NIH R01 EB009055, NIH P41 EB015891, GE HealthcareReferences
1. Schenck JF. The role of magnetic susceptibility in magnetic resonance imaging: MRI magnetic compatibility of the first and second kinds. Med Phys. 1996;23(6):815-850.
2. Koch KM, Hargreaves BA, Pauly KB, Chen W, Gold GE, King KF. Magnetic resonance imaging near metal implants. J Magn Reson Imaging. 2010;32(4):773-787.
3. MICR – Magnetic Ink Character Recognition. What is MICR? Troy Group, Inc. 2007-2014. http://www.whatismicr.com/index.html. Accessed November 3, 2016.
4. Bernstein MA, Grgic M, Brosnan TJ, Pelc NJ. Reconstructions of phase contrast, phased array multicoil data. Magn Reson Med. 1994;32(3):330-334.
5. Nayak KS, Nishimura DG. Automatic field map generation and off-resonance correction for projection reconstruction imaging. Magn Reson Med. 2000;43(1):151-154.
6. Salomir R, de Senneville BD, Moonen CTW. A fast calculation method for magnetic field inhomogeneity due to an arbitrary distribution of bulk susceptibility. Concepts Magn Reson Part B (Magn Reson Engineering). 2003:19B(1):26-34.
7. DeBoer S, Fishman D, Chwals W, Straus C, Amundson T. Body Piercing/Tattooing and Trauma Diagnosis Imaging: Medical Myths vs Realities. J Trauma Nurs. 2007;14(1):35-38.
Figures