1488
Spectral-Model Based Undersampling of Multi-Phase MSI: Application to Diffusion-Weighted Imaging Near Metal1Radiology, Medical College of Wisconsin, Milwaukee, WI, United States, 2Applications and Workflow, GE Healthcare, Milwaukee, WI
Synopsis
Diffusion weighted imaging around metal implants is a difficult task that requires a combination of multi-spectral MRI approaches with non-CPMG spin-echo refocusing techniques. Current implementations of this approach have shown promising initial clinical results. Further work on improving the acquisition efficiency of these techniques are required to achieve robust clinical viability. Here, we present an approach that utilizes the MSI spectral domain to enable spectral undersampling of diffusion-weighted acquisitions. The approach is also easily extendable to other multi-phase implementations of MSI, such as thermometry or relaxometry, where multiple volumes of data need to be acquired for quantitative computations.
Introduction
Multi-spectral MRI (MSI) collects multiple acquisitions at discrete off-resonant frequencies to reduce frequency and slice-selective image distortions induced by metal implants1,2. Morphological (proton density, T1, T2, STIR) 3D fast-spin-echo contrasts of MSI are available major vendor platforms. MSI can also be implemented through a 2D formalism for more limited volumetric coverage needs3. In collecting and encoding multiple volumes at repeated off-resonance intervals, MSI techniques are difficult to implement in rapid fashion. This is particularly relevant for applications of diffusion-weighting4,5, thermometry6, or dynamic contrast enhancement near metal implants. In such applications, multiple image volumes or slices must be acquired in relatively quick succession to capture dynamic or multi-parametric phenomena.
Here, we describe and demonstrate a mechanism for accelerating such MSI acquisitions. This mechanism uses the redundant information contained in the MSI spectral domain to acquire fewer bins in successive "multi-phase" volumetric or slice acquisitions.
Methods
Here, we consider an application of MSI to diffusion-weighted imaging. In this application, a T2-weighted MSI image is acquired, followed by at least one more MSI image acquired under the influence of diffusion-weighting gradients. Initial demonstrations of MSI diffusion-weighting have leveraged non-CPMG PROPELLER approaches7 combined with 2D-MSI techniques3. Despite promising initial feasibility demonstrations, these MSI diffusion prototypes still require several minutes of acquisition per single slice.
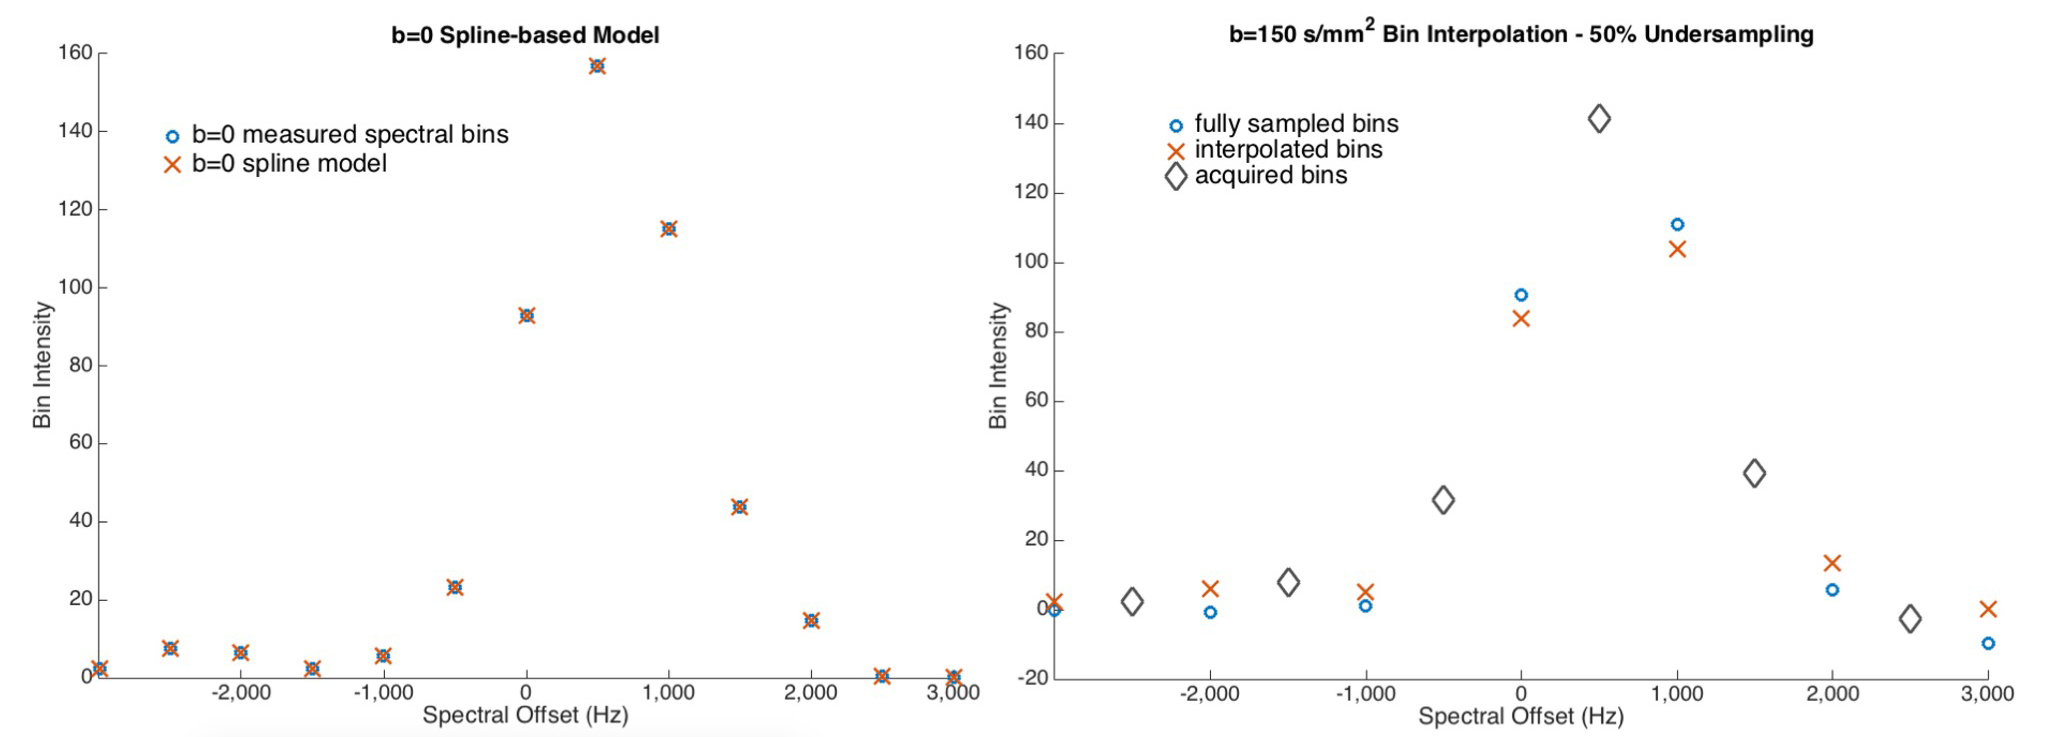
The total time of these acquisitions can be reduced by undersampling the spectral domain acquired for the b>0 images. To do so, we first compute a cubic spline model of the spectral domain in the b=0 image and then fit the undersampled spectral points in the b>0 images to this model, allowing for interpolation of the missing spectral acquisitions.
An in-vivo pelvic dataset of a sacral interference screw is utilized for this analysis. The acquired multi-spectral data for this case was retrospectively re-sampled to allow for analysis of uniform bin undersampling by a factor of 2X for the acquired b=150 s/mm2 image.
Results
Figure 1 demonstrates the modeling accuracy feasible using this spline model on a diffusion MSI image comprised of 12 gaussian spectral bins of width ~1.2 kHz separated by 500Hz. After applying the model characterization on a voxel-by-voxel basis, the spline coefficients are used to interpolate between diffusion-weighted spectral acquisitions regularly undersampled by a factor of 2 ( assuming 6 spectral bins would be acquired, rather than the full 12). The resulting interpolated b>0 (150 s/mm2) spectral profile is plotted in conjunction with its fully sampled counterpart. It is clear that the interpolation approach yields good characterization of the amplitude of the skipped spectral bins within the profile.
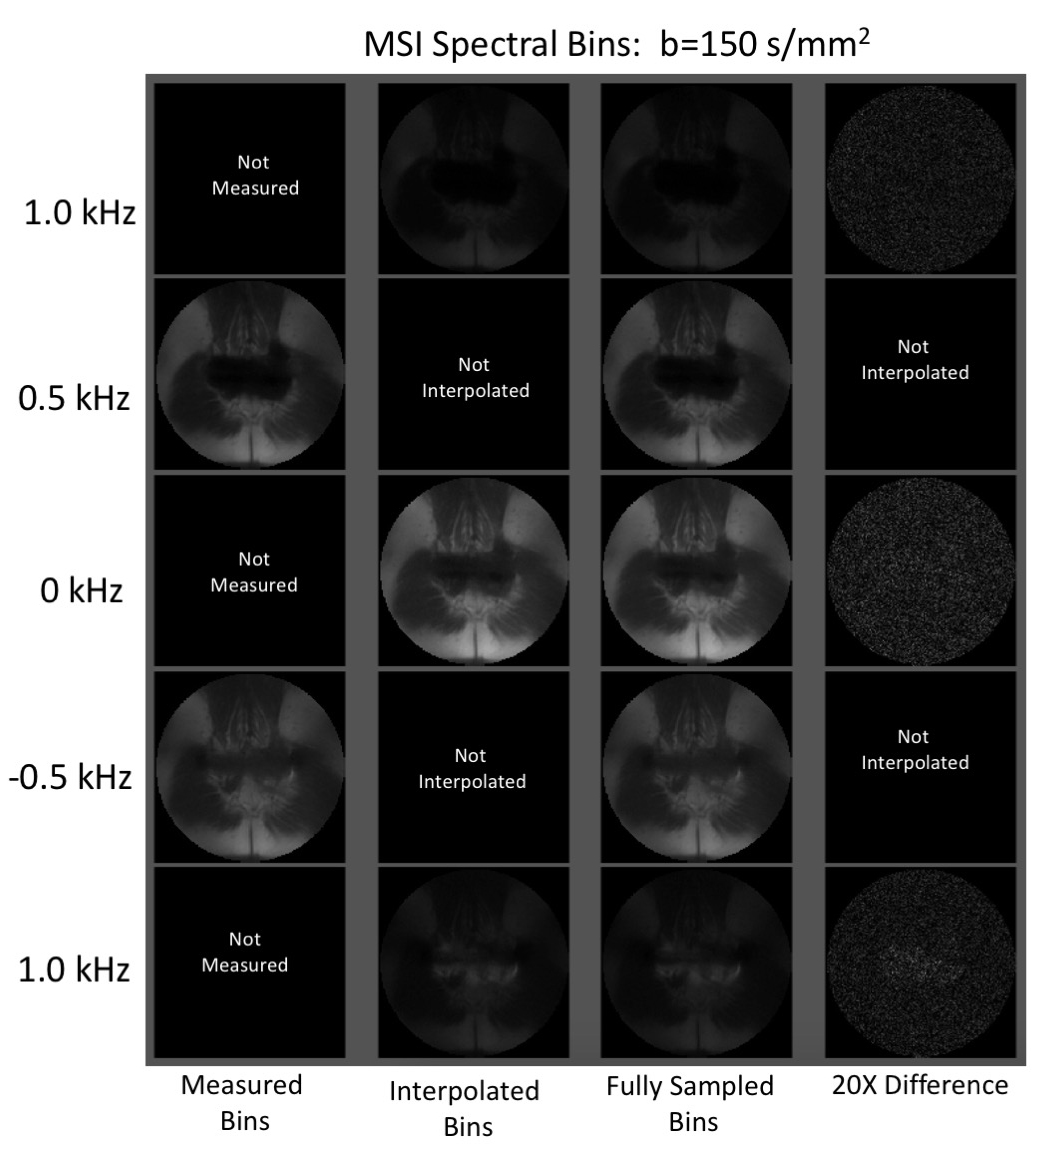
Figure 2 demonstrates the images acquired within the b>0 undersampling strategy on a subject instrumented with a sacral interference screw. The columns of images, from left to right, represent acquired, interpolated, fully sampled, and magnified differences between interpolated and measured spectral bins.
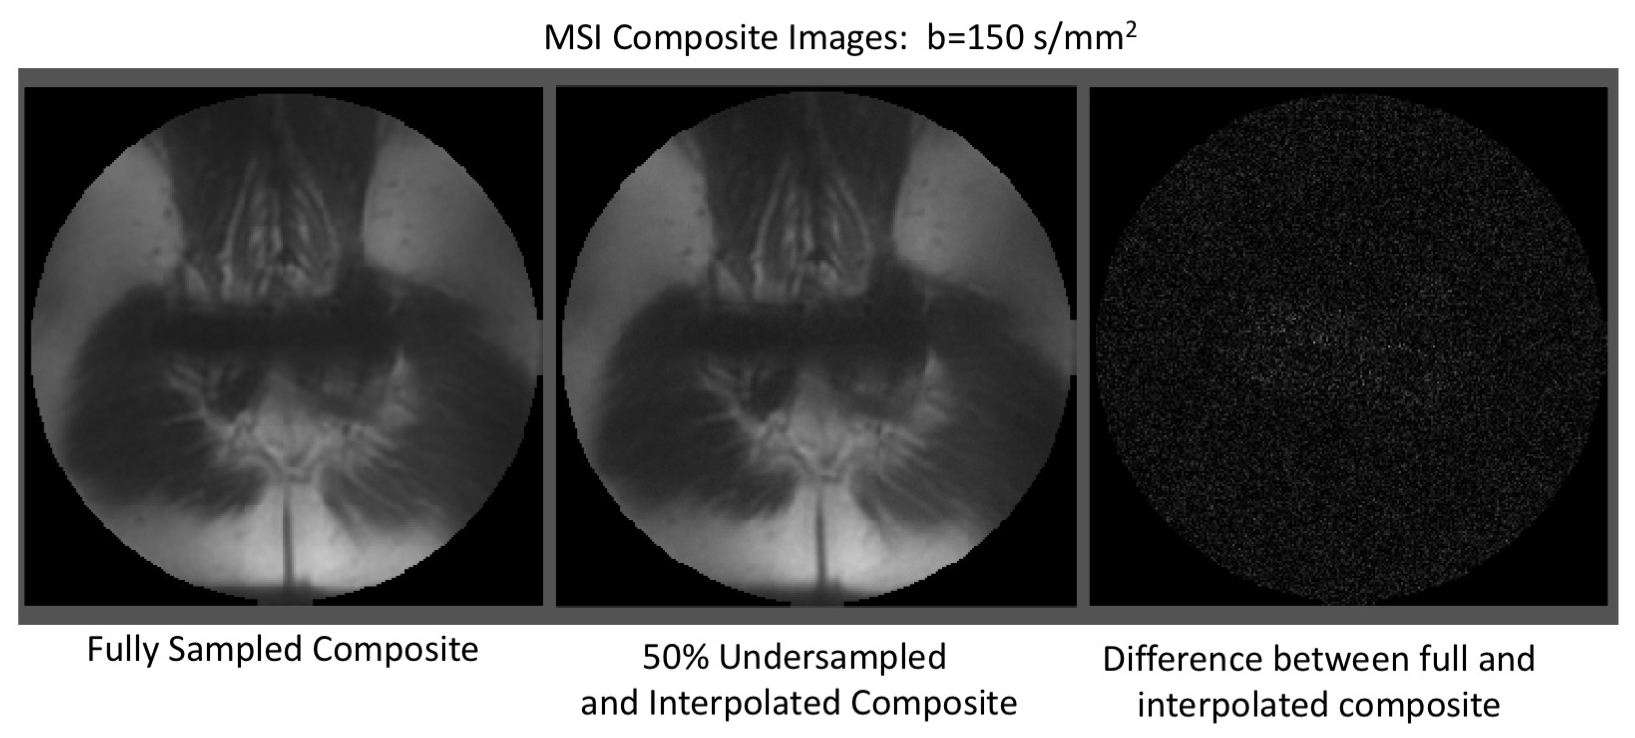
Figure 3 presents the composite MSI diffusion-weighted images, again comparing the fully sampled and interpolated results, along with a magnified difference. Given the extremely subtle errors visualized in the difference image, we see that the slight errors seen in the spectral model comparison (Figure 1) do not substantially propagate into the composite mutli-spectral image formation. As a result, this interpolation approach provides a very fast and accurate mechanism to achieve acceleration of multi-phase MSI acquisitions. In this case, the 2-slice dataset could have been acquired in 4.5 minutes rather than the fully sampled 6 minutes, or alternatively, another b-value image could have been acquired in the same 6 minute fully sampled scan duration.
Discussion
We have identified a relatively straightforward mechanism to reduce multi-phase MSI acquisition times. By leveraging a spectral modeling approach on a baseline image, ensuing 3D images acquired under the same spatial encoding and frequency offset paradigm can be undersampled and very accurately interpolated to regain full spectral sampling. It should be noted that this approach requires modest spectral overlap, such as that applied in the MAVRIC MSI approaches. In general, overlap is recommended in 3D-MSI in order to avoid ripple artifacts in the spectral-spatial composite image formation. Therefore, it is anticipated that this approach will be compatible with most practical applications of MSI technology.
Though we applied the principle to diffusion-weighted techniques in this example, the same approach could be utilized in MSI thermometry, dynamic contrast enhancement (DCE), or relaxometry (T2, T1 mapping) studies. In cases where more volume phases are required (such as thermometry or DSC), the advantages and impact of this approach will be substantially higher in magnitude.
Acknowledgements
This work was funded in part by grants from Advancing a Healthier Wisconsin and GE Healthcare.References
[1] Koch KM, Lorbiecki JE, Hinks RS, King KF. A multispectral three- dimensional acquisition technique for imaging near metal implants. Magn Reson Med 2009;61:381–390.
[2] Lu W, Pauly KB, Gold GE, Pauly JM, Hargreaves BA. SEMAC: slice encoding for metal artifact correction in MRI. Magn Reson Med 2009; 62:66–76.
[3] Hargreaves et al. Fast 2D imaging for distortion correction near metal implants, Proc. ISMRM, 2014. #615.
[4] Koch et al, Non-CPMG Multi-Spectral PROPELLER for Diffusion-Weighted Imaging Near Metal Implants, Proc ISMRM, 2015, #101
[5] Kaushik, ISMRM, Clinically Viable Diffusion-Weighted Imaging Near Metal using 2D-MSI PROPELLER DUO, Proc ISMRM 2016, #370
[6] Weber, H., Taviani, V., Yoon, D., Ghanouni, P., Pauly, K. B., & Hargreaves, B. A., MR thermometry near metallic devices using multispectral imaging. Magnetic Resonance in Medicine (Early View), 2016
[7] Pipe, J. G., Farthing, V. G., & Forbes, K. P. Multishot diffusion-weighted FSE using PROPELLER MRI. Magnetic Resonance in Medicine, 47(1), 2001, 42–52.
Figures