1486
Diffusion-weighted Echo Planar Spectroscopic Imaging in human brain at 3T1Radiological Sciences, UCLA School of Medicine, Los Angeles, CA, United States, 2School of Nursing, UCLA School of Medicine, Los Angeles, CA, United States
Synopsis
There have been only few attempts to obtain maps of the diffusion properties of brain metabolites with diffusion weighted spectroscopic imaging. In this study we developed an echo planar based diffusion weighted spectroscopic imaging (DW-EPSI) method which uses a pairs of bipolar diffusion gradient to measure the apparent diffusion coefficient (ADC) of metabolites across an entire slice. The sequence was tested and validated on phantom and five healthy volunteers. The ADC values from DW-EPSI are in agreement with previous studies. The novel technique will enable a better understanding of the intracellular metabolism and water diffusivity correlates in pathologies.
Introduction
Diffusion-weighted spectroscopy (DWS) is an excellent tool to explore the diffusion properties of intracellular metabolites1,2. Metabolite diffusion can provide compartment specific assessment of tissue microstructure with unique information about cells specific structure and physiology, such as cell size, permeability, and cell swelling3. Metabolite diffusion may help to study pathological changes in the intracellular environment in various diseases in the human brain including multiple sclerosis4, brain tumors5, autism6, cerebral ischemia5 and psychiatric disorders7. Most DW-MRS studies involving human brain metabolite so far used single voxel methods8-11 limiting its application to specific white matter tracts or arbitrarily selected regions of interest. There have been only a few attempts to obtain maps of the diffusion properties of brain metabolites with DW-CSI3,12-14. Ercan et al.15 demonstrated feasibility of mapping metabolite diffusion in a central PRESS-localized brain region. The acquisition of DW-CSI can be greatly shortened by using echo-planar spectroscopic imaging (EPSI)16,17. Posse eta al.18 recently implemented diffusion tensor spectroscopic imaging (DTSI) in a central PRESS-localized brain region. In this study we developed an echo planar based diffusion weighted spectroscopic imaging (DW-EPSI) sequence which uses a pairs of bipolar diffusion gradients to measure the apparent diffusion coefficient (ADC) of N-acetylaspartate (NAA), choline (Cho) and creatine (Cr) across an entire slice.Materials and Methods:
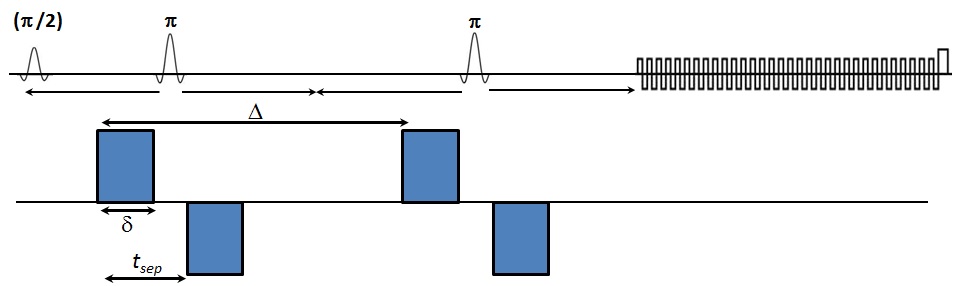
The basic CSI sequence was modified by adding bipolar diffusion-sensitizing gradients19 (DSGs) in the three orthogonal directions simultaneously with 30 ms duration (δ), 58 ms diffusion time (Δ), and 23 ms separation between the first and second gradient (tsep) (Fig. 1). Spatial-spectral encoding is performed using a series of EPI readout modules. The bipolar DSG scheme helps to minimize eddy currents. Outer volume suppression and water suppression via WET were implemented using the standard pulse sequence components available. To examine the performance and reliability, brain phantom data were collected using DW-EPSI. The sequence was tested further in the brain of five healthy volunteers (age=23-58 years). All data were collected on a 3T Prisma MRI scanner equipped with a 16-channel head ‘receive’ coils using: TE=120, TR=2ms, 1x1x2 cm3 voxel for VOI localization, 512 bipolar echo pair, FOV=16x16cm2, 32 averages, spectral width 1190 Hz respectively. A non-water-suppressed scan with 1 average was also recorded for eddy current correction and estimation of coil sensitivity. Both water suppressed and non-suppressed data were acquired at two b-values: 28 and 1610/1030 s/mm2 with a total measurement time of about 35 min. A non-zero b-value for the low b acquisition was used to assist in suppressing unwanted echo pathways. Data were collected with cardiac gating with a trigger delay of 240 ms in order to minimize cardiac pulsation induced fluctuations. The signal processing of DW-EPSI data and spectral quantification based on peak integral was performed using a custom MATLAB (Mathworks, Inc., Natick, MA) script. Metabolite and water apparent diffusion coefficients (ADCs) were estimated from mono exponential fits represnted by the following equation: $$ADC_{i}=-\frac{ln[S_{i}(b_{2})/S_{i}(b_{1})]}{b_{2}-b_{1}}$$ where $$$S_{i}(b_{1})$$$ and $$$S_{i}(b_{2}) $$$ are the peak area value for the metabolite $$$i$$$ at b-values, $$$b_{1}$$$ and $$$b_{2}$$$.Results:
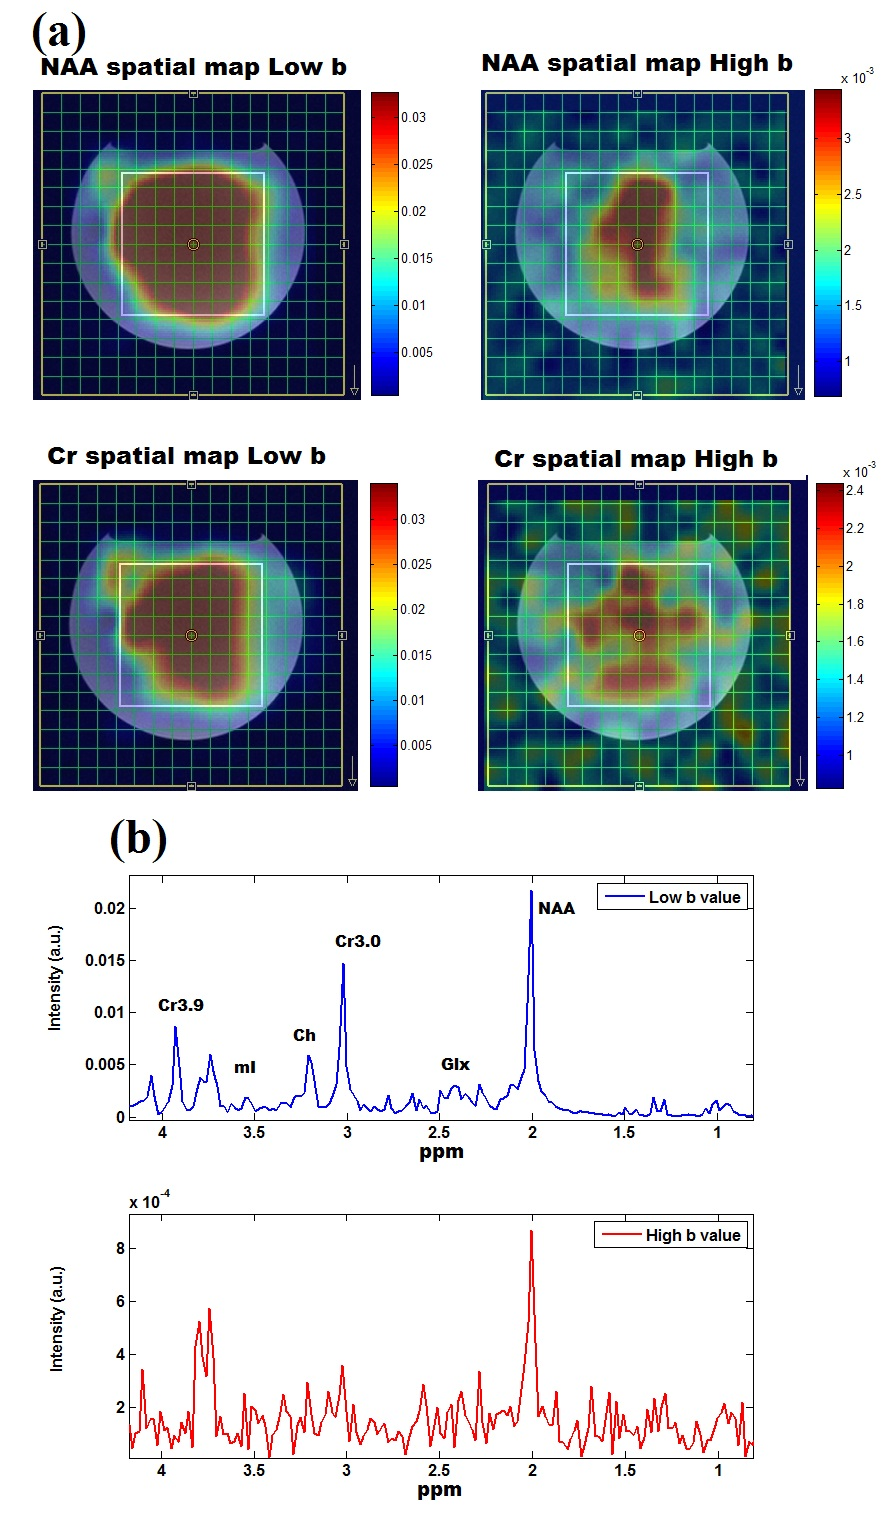
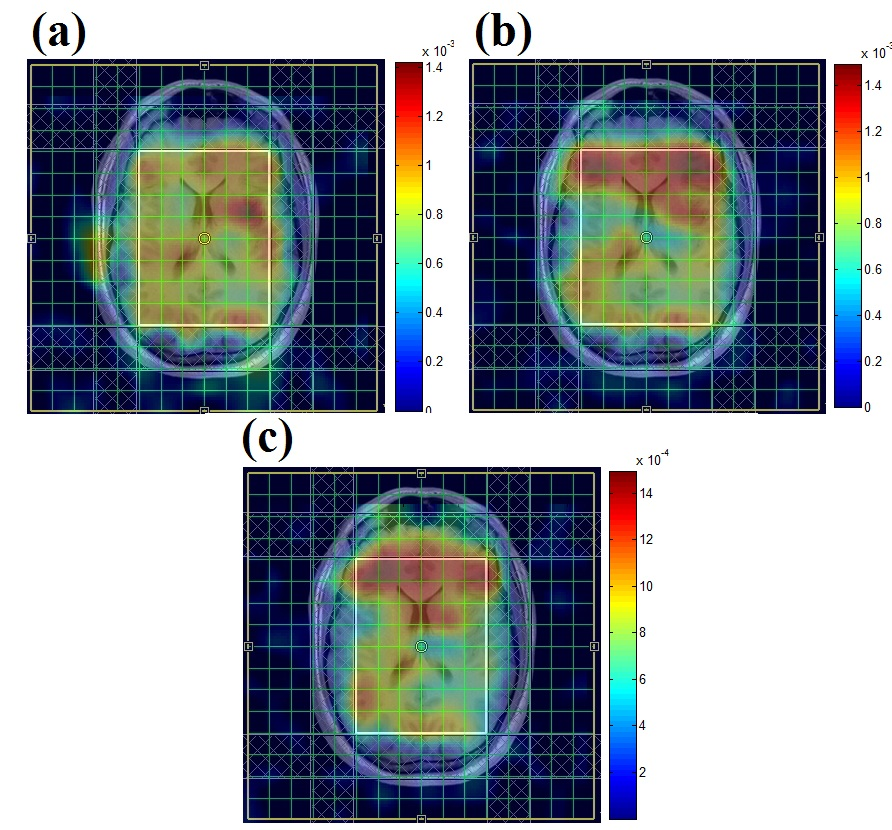
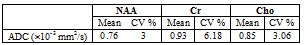
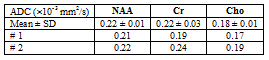
Fig. 2 (a) shows the DW-EPSI map of NAA and Cr acquired at b=28 and 1610 s/mm2 respectively. Figure 2 (b) shows the spectra obtained from the voxel highlighted in Figure 2(a). Even at high b-values, the quality of the MR spectra was sufficient enough to quantify the metabolites. Table 1 shows ADC values for the three metabolites calculated from the DW-EPSI phantom experiments. Typical ADC maps for NAA, Cr, and Cho from an in-vivo measurement are shown in Figure 3. Metabolite ADC values for in-vivo subjects in the basal ganglia region are shown in Table 2. The phantom and in vivo ADC values are in the ranges reported in earlier studies4,11,15.Discussion:
This study demonstrates feasibility of implementing DW-EPSI with bipolar DSG in human brain at 3T and provides spatially resolved diffusion-weighted maps of NAA, Cr, and Cho from multiple brain regions. As DSGs are applied only in a single direction, the present work does not provide rotationally invariant estimates of ADCs. Still the DW-EPSI results are in agreement with previous studies. Implementation of a navigator to estimate phase and amplitude signal fluctuations during acquisition to avoid over/under estimation of metabolite ADC is currently in progress. Another limitation of the current implementation is the long scan time that could limit clinical investigations. This can be overcome using parallel imaging technique such as sensitivity encoding and compressed sensing20,21.Conclusion:
In conclusion, we have implemented and shown the feasibility of DW-EPSI acquisition in the human brain at 3T, and will apply this technique to study different pathologies in the future.Acknowledgements
This research was supported by NINDS 1R21-NS090956.References
1. Ronen I, Valette J. Diffusion-weighted magnetic resonance spectroscopy. eMagRes 2015;4:733–750.
2. van der Toorn A, Dijkhuizen RM, Tulleken CA, Nicolay K. Diffusion of metabolites in normal and ischemic rat brain measured by localized 1H MRS. Magn Reson Med. 1996;36(6):914–922.
3. Bito Y, Hirata S, Nabeshima T, Yamamoto E. Echo-planar diffusion spectroscopic imaging. Magn Reson Med. 1995;33(1):69-73.
4. Wood ET, Ronen I, Techawiboonwong A, et al. Investigating axonal damage in multiple sclerosis by diffusion tensor spectroscopy. J Neurosci. 2012;32(19):6665–6669.
5. Harada M, Uno M, Hong F, et al. Diffusion-weighted in vivo localized proton MR spectroscopy of human cerebral ischemia and tumor. NMR Biomed. 2002;15(1):69–74.
6. Dager SR, Friedman SD, Petropoulos H, Shaw DWW. Imaging evidence for pathological brain development in autism spectrum disorders. In: Autism, Current Clinical Neurology. New York: Humana Press; 2008. p 361–379.
7. Du F, Cooper AJ, Thida T, et al. Myelin and axon abnormalities in schizophrenia measured with magnetic resonance imaging techniques. Biol Psychiatry. 2013;74(6):451–457.
8. Posse S, Cuenod CA, Le Bihan D. Human brain: proton diffusion MR spectroscopy. Radiology. 1993;188:719–725.
9. Ellegood J, Hanstock CC, Beaulieu C. Trace apparent diffusion coefficients of metabolites in human brain using diffusion weighted magnetic resonance spectroscopy. Magn Reson Med. 2005;53:1025–1032.
10. Upadhyay J, Hallock K, Erb K, et al. Diffusion properties of NAA in human corpus callosum as studied with diffusion tensor spectroscopy. Magn Reson Med. 2007;58:1045–1053.
11. Kan HE, Techawiboonwong A, van Osch MJ, et al. Differences in apparent diffusion coefficients of brain metabolites between grey and white matter in the human brain measured at 7 T. Magn Reson Med. 2012;67:1203–1209.
12. Posse S, Ackley E, Zhang JM, Zhang T. Diffusion Tensor Spectroscopic Imaging in Human Brain. In Proceedings of the 21st Annual Meeting of ISMRM, Salt Lake City, Utah, USA, 2013. p. 3956.
13. Bito Y, Kawai Y, Hirata K, et al. Diffusion tensor spectroscopic imaging of multiple metabolites in rat brains. In Proceedings of the 21st Annual Meeting of ISMRM, Salt Lake City, Utah, USA, 2013. p. 3955.
14. Techawiboonwong A, Kan H, Versluis MJ, et al. 2D Diffusion weighted chemical shift imaging of brain metabolites at 7T. In Proceedings of the 21st Annual Meeting of ISMRM, Montreal, Canada, 2011. p. 1444.
15. Ercan AE, Techawiboonwong A, Versluis MJ, et al. Diffusion-weighted chemical shift imaging of human brain metabolites at 7T. Magn Reson Med. 2014;73:2053–2061.
16. Mansfield P. Spatial mapping of the chemical shift in NMR. Magn Reson Med. 1984;1(3):370–786.
17. Posse S, Tedeschi G, Risinger R, et al. High speed 1H spectroscopic imaging in human brain by echo planar spatial-spectral encoding. Magn Reson Med. 1995;33(1):34–40.
18. Fotso K, Dager SR, Landow A, et al. Diffusion tensor spectroscopic imaging of the human brain in children and adults. Magn Reson Med. 2016 [Epub ahead of print].
19. Reese TG, Heid O, Weisskoff RM, Wedeen VJ. Reduction of eddy-current-induced distortion in diffusion MRI using a twice-refocused spin echo. Magn Reson Med. 2003;49(1):177–182.
20. Lin FH, Tsai SY, Otazo R, et al. Sensitivity-encoded (SENSE) proton echo-planar spectroscopic imaging (PEPSI) in the human brain. Magn Reson Med. 2007;57(2):249-257.
21. Furuyama JK, Wilson NW, Burns BL, et al. Application of compressed sensing to multidimensional spectroscopic imaging in human prostate. Magn Reson Med. 2012;67(6):1499–1505.
Figures