1475
Quantification of contrast agent-induced enhancement of brain lesions in multiple sclerosis1Department of Neurology, University of California San Francisco, San Francisco, CA, United States, 2Department of Cell Biology and Anatomy, National Cheng Kung University, Tainan, Taiwan
Synopsis
Contrast agents are routinely used in MRI to detect and evaluate tissue lesions. Conventional clinical protocols use T1-weighted sequences to visualize Gd contrast agent enhancement. Because T1-weighted MRI does not produce quantitative measurements, it is difficult to describe the lesion enhancement in quantitative terms and to infer the degree of the underlining disease activities of the lesions. A fast, whole-brain high-resolution T1 mapping method was developed to address this problem and applied to multiple sclerosis.
PURPOSE
The gadolinium-based contrast agents (CAs) are routinely used in clinical MRI. The CA shortens T1 and T1-weighted MRI pulse sequences are used to visualize the contrast enhancement between normal and damaged tissue, or lesions. Compared with conventional methods for direct T1 mapping, T1-weighted sequences are faster but cannot produce quantitative measurements. Therefore, it is difficult to quantify the degree of tissue alterations from the contrast enhancement for use as a reliable measure of disease status and progression. To solve the problem, a fast T1 mapping method was developed such that a whole-brain high-resolution T1 map could be acquired in a clinically feasible scan time (< 5 min).
MRI is the preferred imaging modality for multiple sclerosis (MS) and is commonly used with a CA in diagnosis and disease monitoring. The T1 mapping technique was applied in MS patients for quantitative documentation of the contrast enhancement and investigation of disease pathology.
METHODS
A T1 mapping method was developed based on the method described in Refs. [1,2], in which a pulse train α–τ –α and a train π–α–τ–α are executed and images are acquired after each pulse of flip angle (FA) α. The images of the two trains are subtracted, normalized for the cosine of the FA (55°), and then fit to a two-point exponential decay curve to obtain the T1 value. An important feature of the method is that full magnetization recovery is not required between repetitions, which significantly reduces the scan time. Slice acquisitions are interleaved between the pulse spacing τ (750 ms) for multi-slice imaging. The effect of the slice profile of selective excitation, which is commonly ignored but in fact can affect significantly the accuracy of the measurement of the FA and T1, is corrected by numerically solving the Bloch equation as described in Ref. [3]. Because only a limited number of slices can be interleaved in time τ, the volume was divided into multiple slice groups to expand the capacity of the total number of slices. Adjacent slices were scheduled into different groups to reduce the slice crosstalk. The scan with the spiral trajectory produced 66 axial slices of whole-brain T1 maps of 1.5-mm isotropic resolution in 1 min and 50 s, or 92 slices in 3 min 50 s, depending on the time that can be allocated to the T1 scan during a patient visit. The scan times included the FA measurement. The scans followed a protocol approved by the Committee of Human Research of the University including subject informed consent.RESULTS AND DISCUSSION
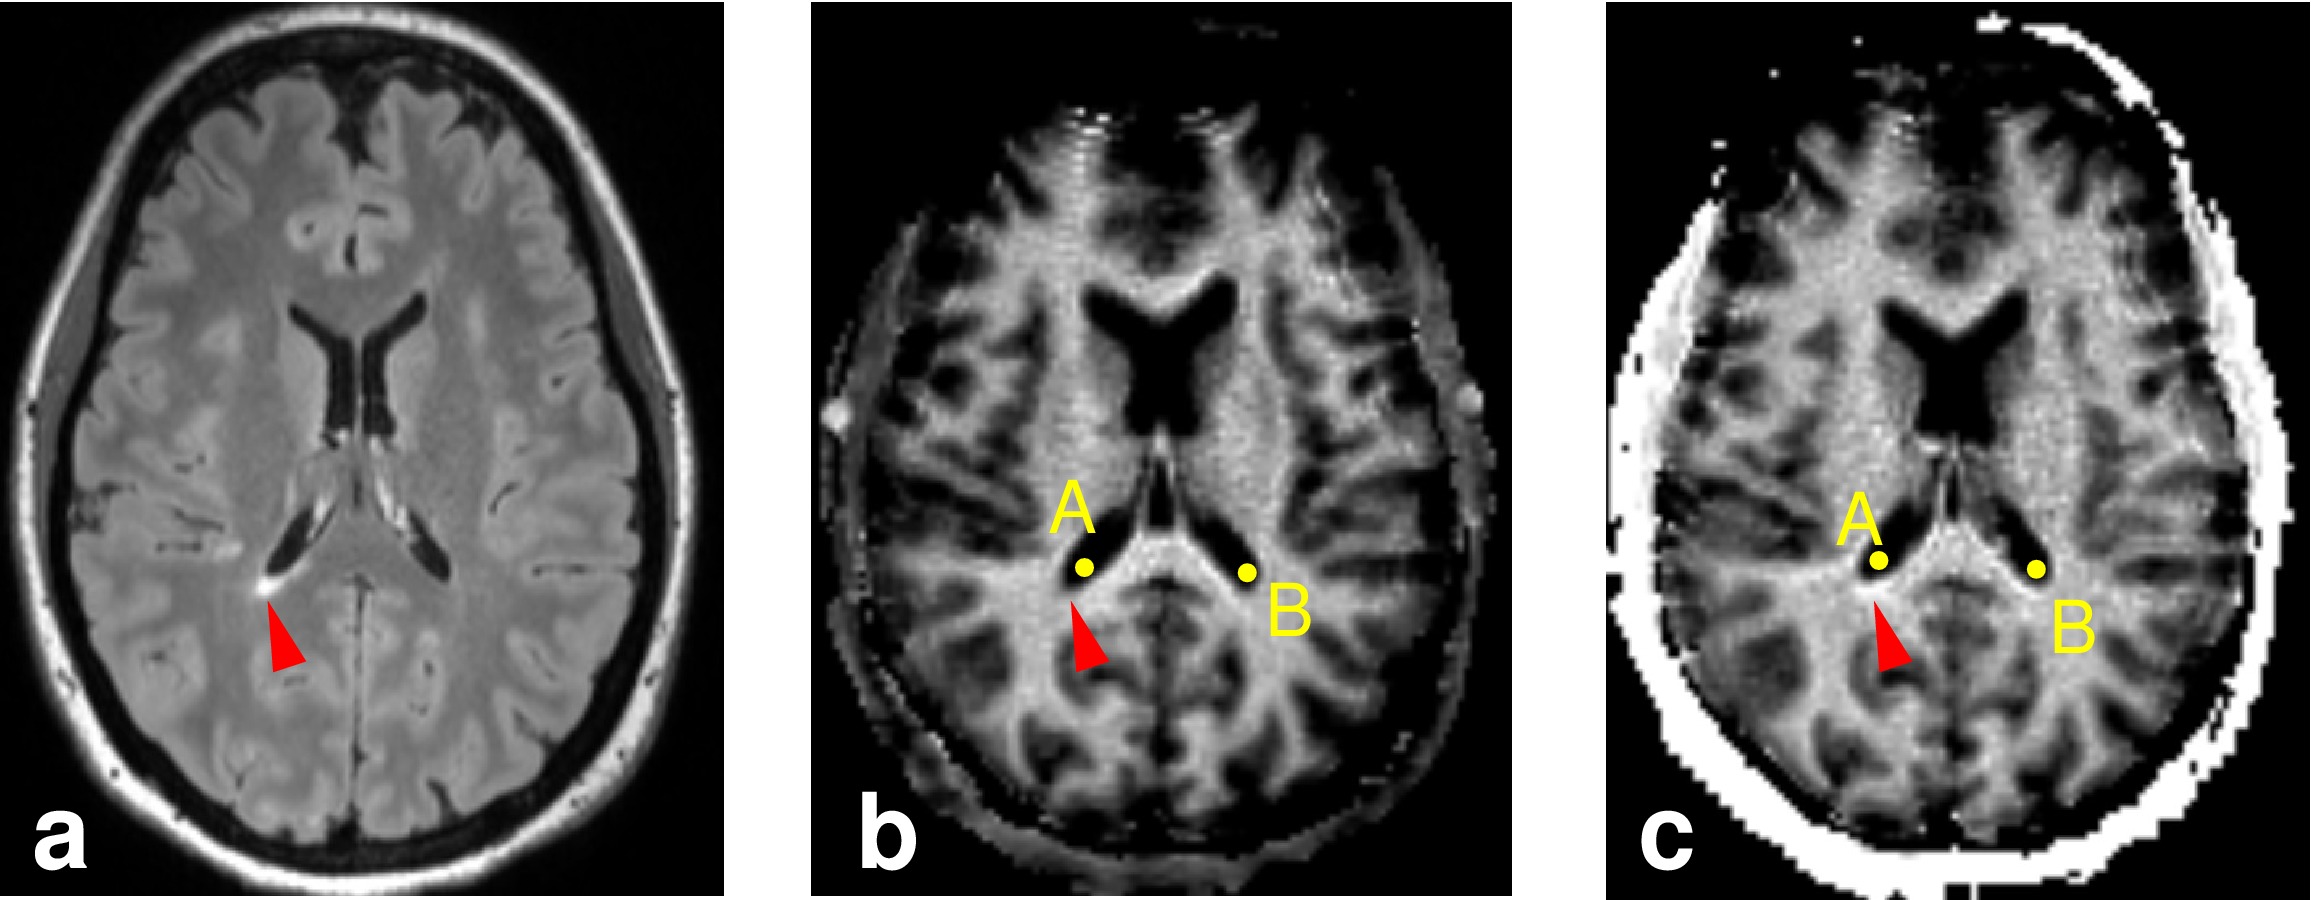
The T1 mapping method was applied to the MS participants enrolled in longitudinal studies at our MS imaging laboratory. The technique not only allowed documenting the lesion contrast enhancement quantitatively, but also provided novel opportunities to investigate the MS disease pathology from the pharmacokinetics and biodistribution of the CA. For example, Fig. 1 shows images of a sample slice of a MS patient. Figure 1a is the post-CA-injection FLAIR image; an enhancing periventricular lesion was detected (arrow). Figures 1b and 1c show the R1 maps pre- and 12-min post-contrast injection, respectively. The R1 value (and the standard deviation) of the lesion, averaged over 4 adjacent pixels, increased from 854(68)×10−3/s to 1674(104)×10−3/s, indicating CA extravasation in the lesion. The R1 values of CSF, averaged from 4 adjacent pixels, in the ventricles at point A and B pre-contrast injection are approximately the same: 301(15)×10−3/s and 307(34)×10−3/s, respectively. However, after the injection, the CSF R1 value at point A near the enhancing lesion increased to 390(34)×10−3/s, whereas the CSF R1 value at the contralateral location B remains the same at 305(25)×10−3/s. That is, the injection has altered the CSF R1 value near the contrast-enhanced periventricular lesion. The integrity of the boundary of the CSF and tissue has been disrupted. Although the number of such cases is not sufficient at this time for statistical significance testing, the example suggests that it is feasible to detect small amount of CA by using T1 mapping.CONCLUSION
The innovation in this work has been the combination of recently developed novel techniques to address the speed and accuracy problems for the T1 measurement, including a fast pulse sequence and treatment of spatial variation of the FA, the slice profile, and slice crosstalk. The potential and utility of contrast enhancement quantification by T1 mapping is demonstrated. T1 mapping is now part of our on-going longitudinal studies to document and investigate changes in the normal appearing tissue, lesions, and CSF in MS patients and we will continue to report interesting cases related to the disease pathology.Acknowledgements
No acknowledgement found.References
1. Hsu, J.-J. & Lowe, I. J. Spin-lattice relaxation and a fast T1-map acquisition method in MRI with transient-state magnetization. J. Magn. Reson. 169, 270–278 (2004).
2. Hsu, J.-J. & Glover, G. H. Rapid MRI method for mapping the longitudinal relaxation time. J. Magn. Reson. 181, 98–106 (2006).
3. Hsu, J.-J. Flip-angle profile of slice-selective excitation and the measurement of the MR longitudinal relaxation time with steady-state magnetization. Phys. Med. Biol. 60, 5785 (2015).
Figures