1474
The effect of MR noise and resolution on textural features in simulated and real textures: implications for clinical practice.1The Royal Marsden NHS Foundation Trust, London, United Kingdom, 2Institute of Cancer Research, United Kingdom
Synopsis
Sensitivity of textural features to acquisition parameters has important clinical implications. The aim of this study is to investigate the effect of noise and resolution on textural features.
We compared textural features from a uniform and simulated texture, varied with noise, with experiment in a uniform phantom and organic texture.
Our data demonstrate that a uniform texture behaves as if it has inherent texture, due to presence of artefact, and this in turn will influence textural features as noise and acquisition parameters are varied.
We note that certain textural features used in clinical practice vary widely with image noise, whereas others appear to be robust.
Introduction
Texture analysis is increasingly performed as part of radiomics analysis. Although more widely used with CT, it is also being applied to MRI and PET data. However, MRI data may be acquired with different image signal-to-noise and partition thickness, and it is unclear to what degree different textural features may be sensitive to these perturbations1-5. The purpose of this study is to investigate the effect of noise and resolution on textural features.
Firstly a simulation is performed of a uniform and textured image, varied with noise. Secondly an experiment is performed on a uniform phantom and an organic texture with variation in image noise and resolution. Robustness of textural features and implications for clinical practice are discussed.
Methods
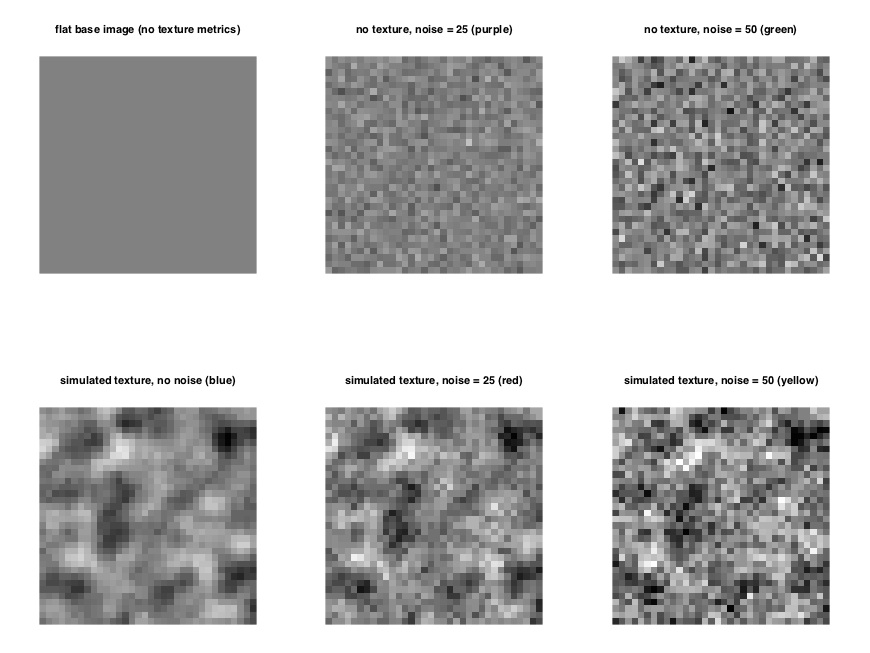
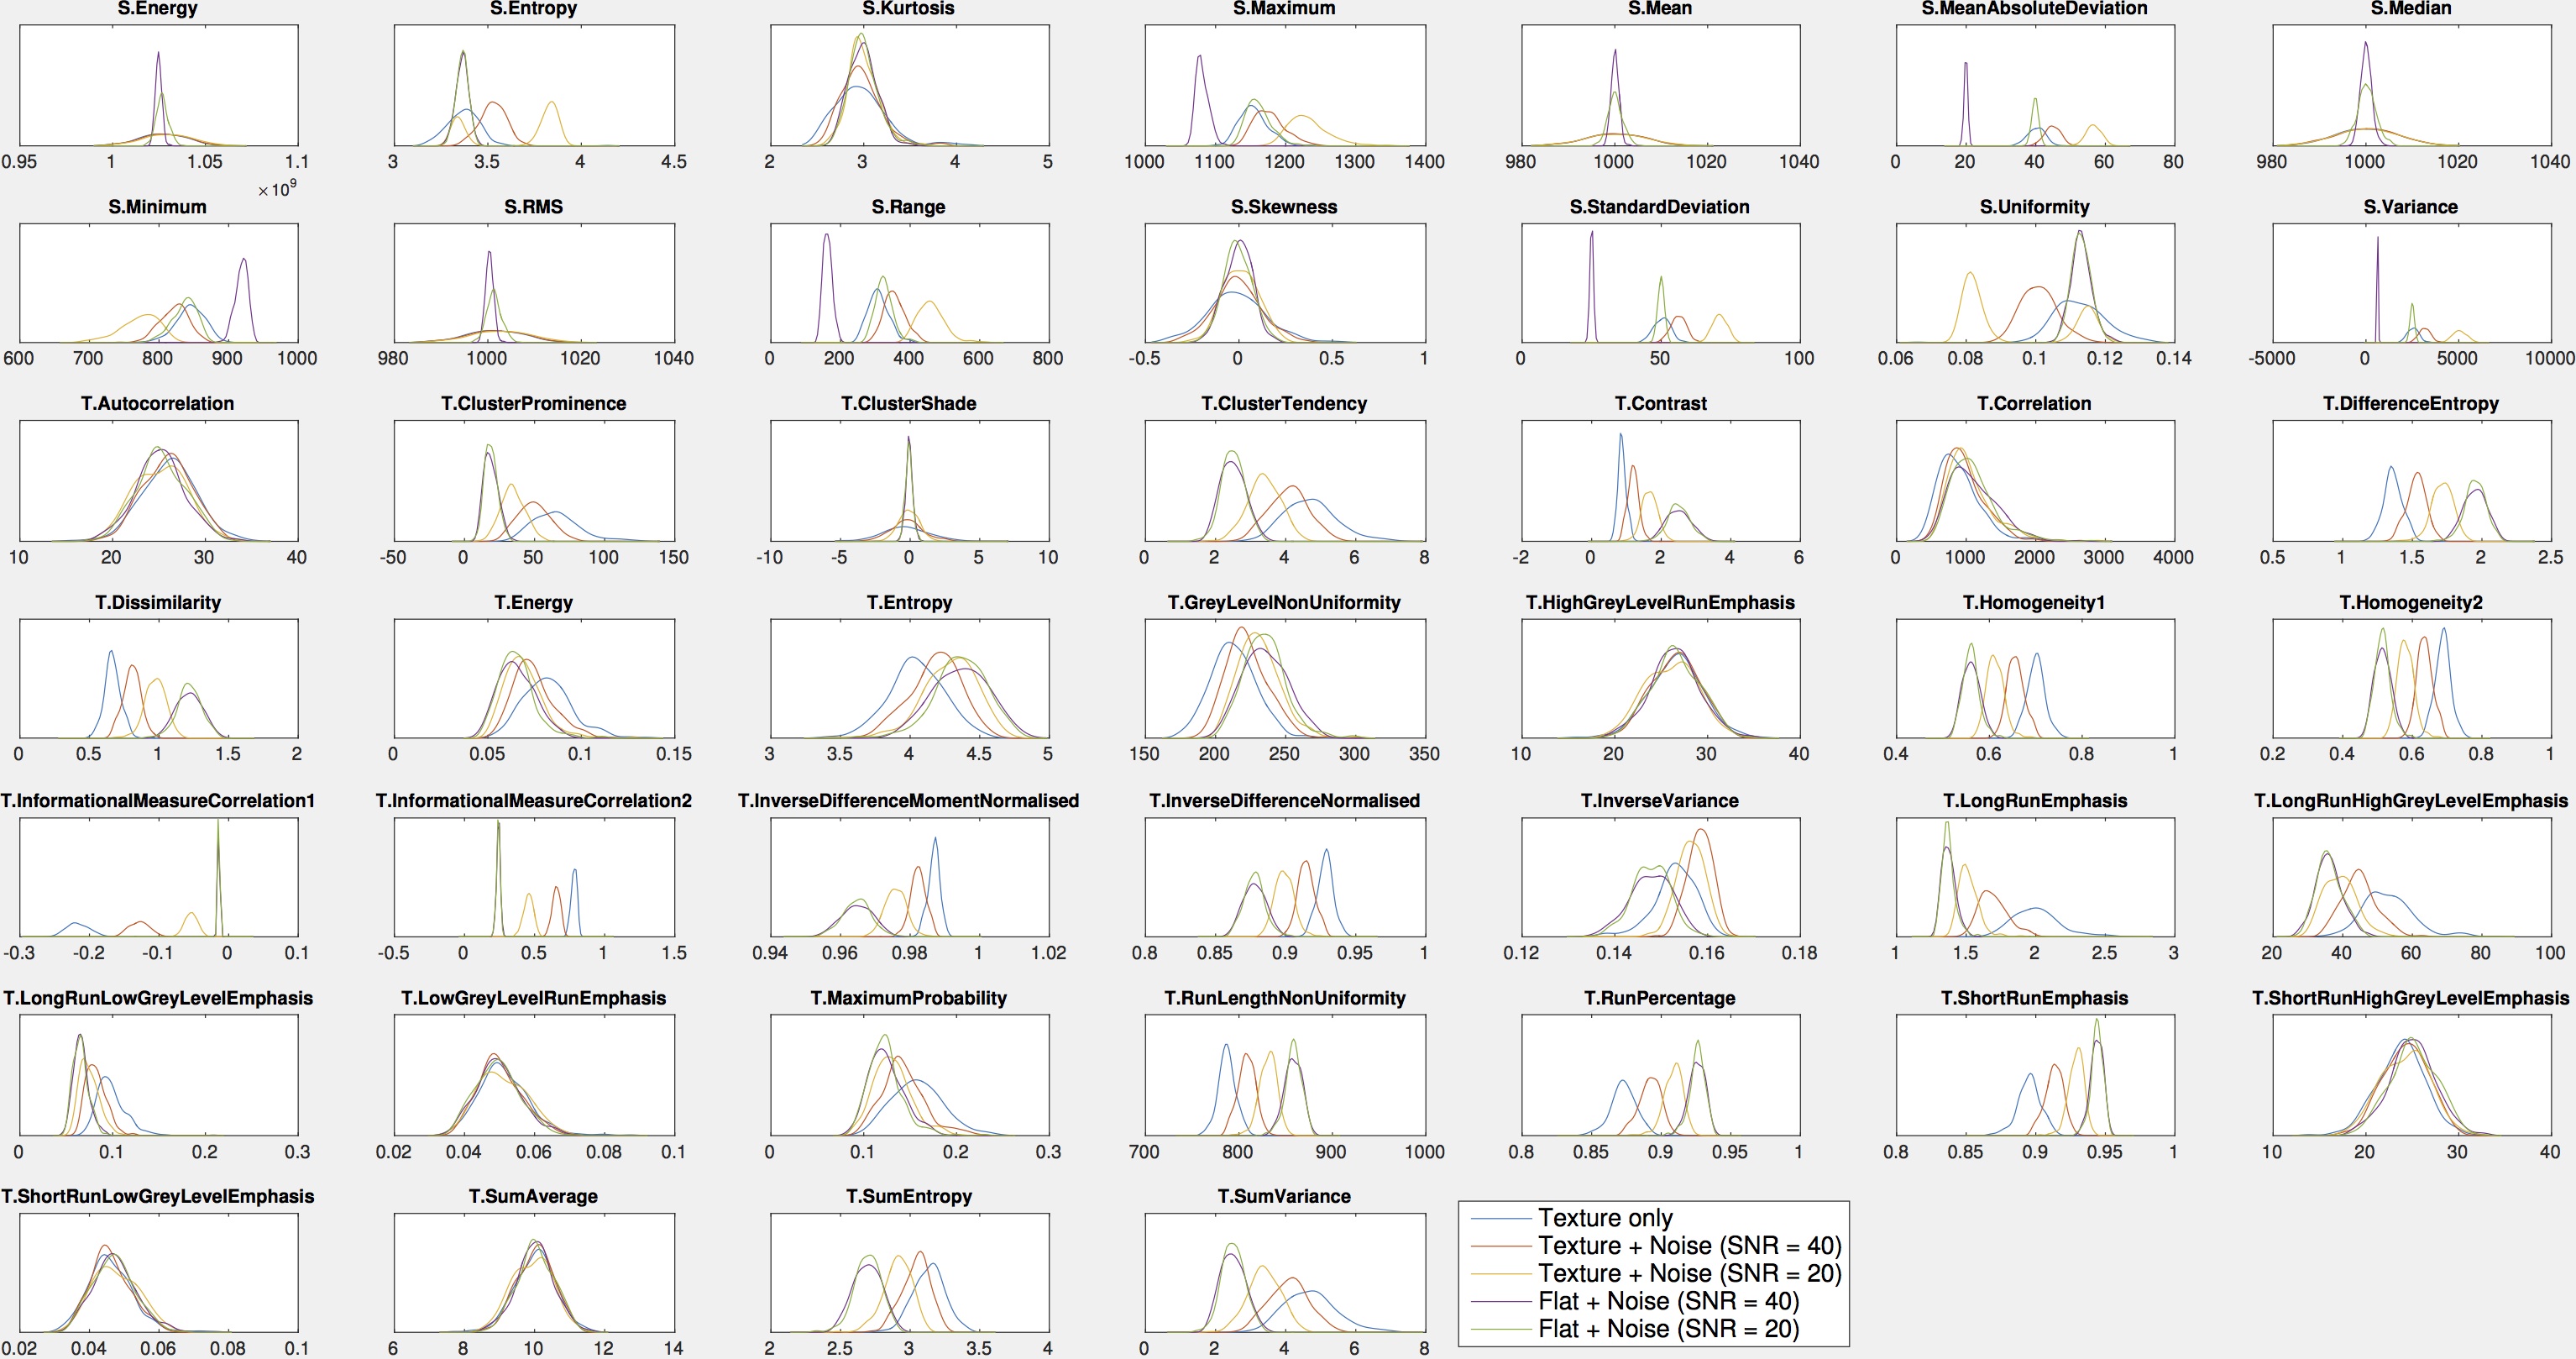
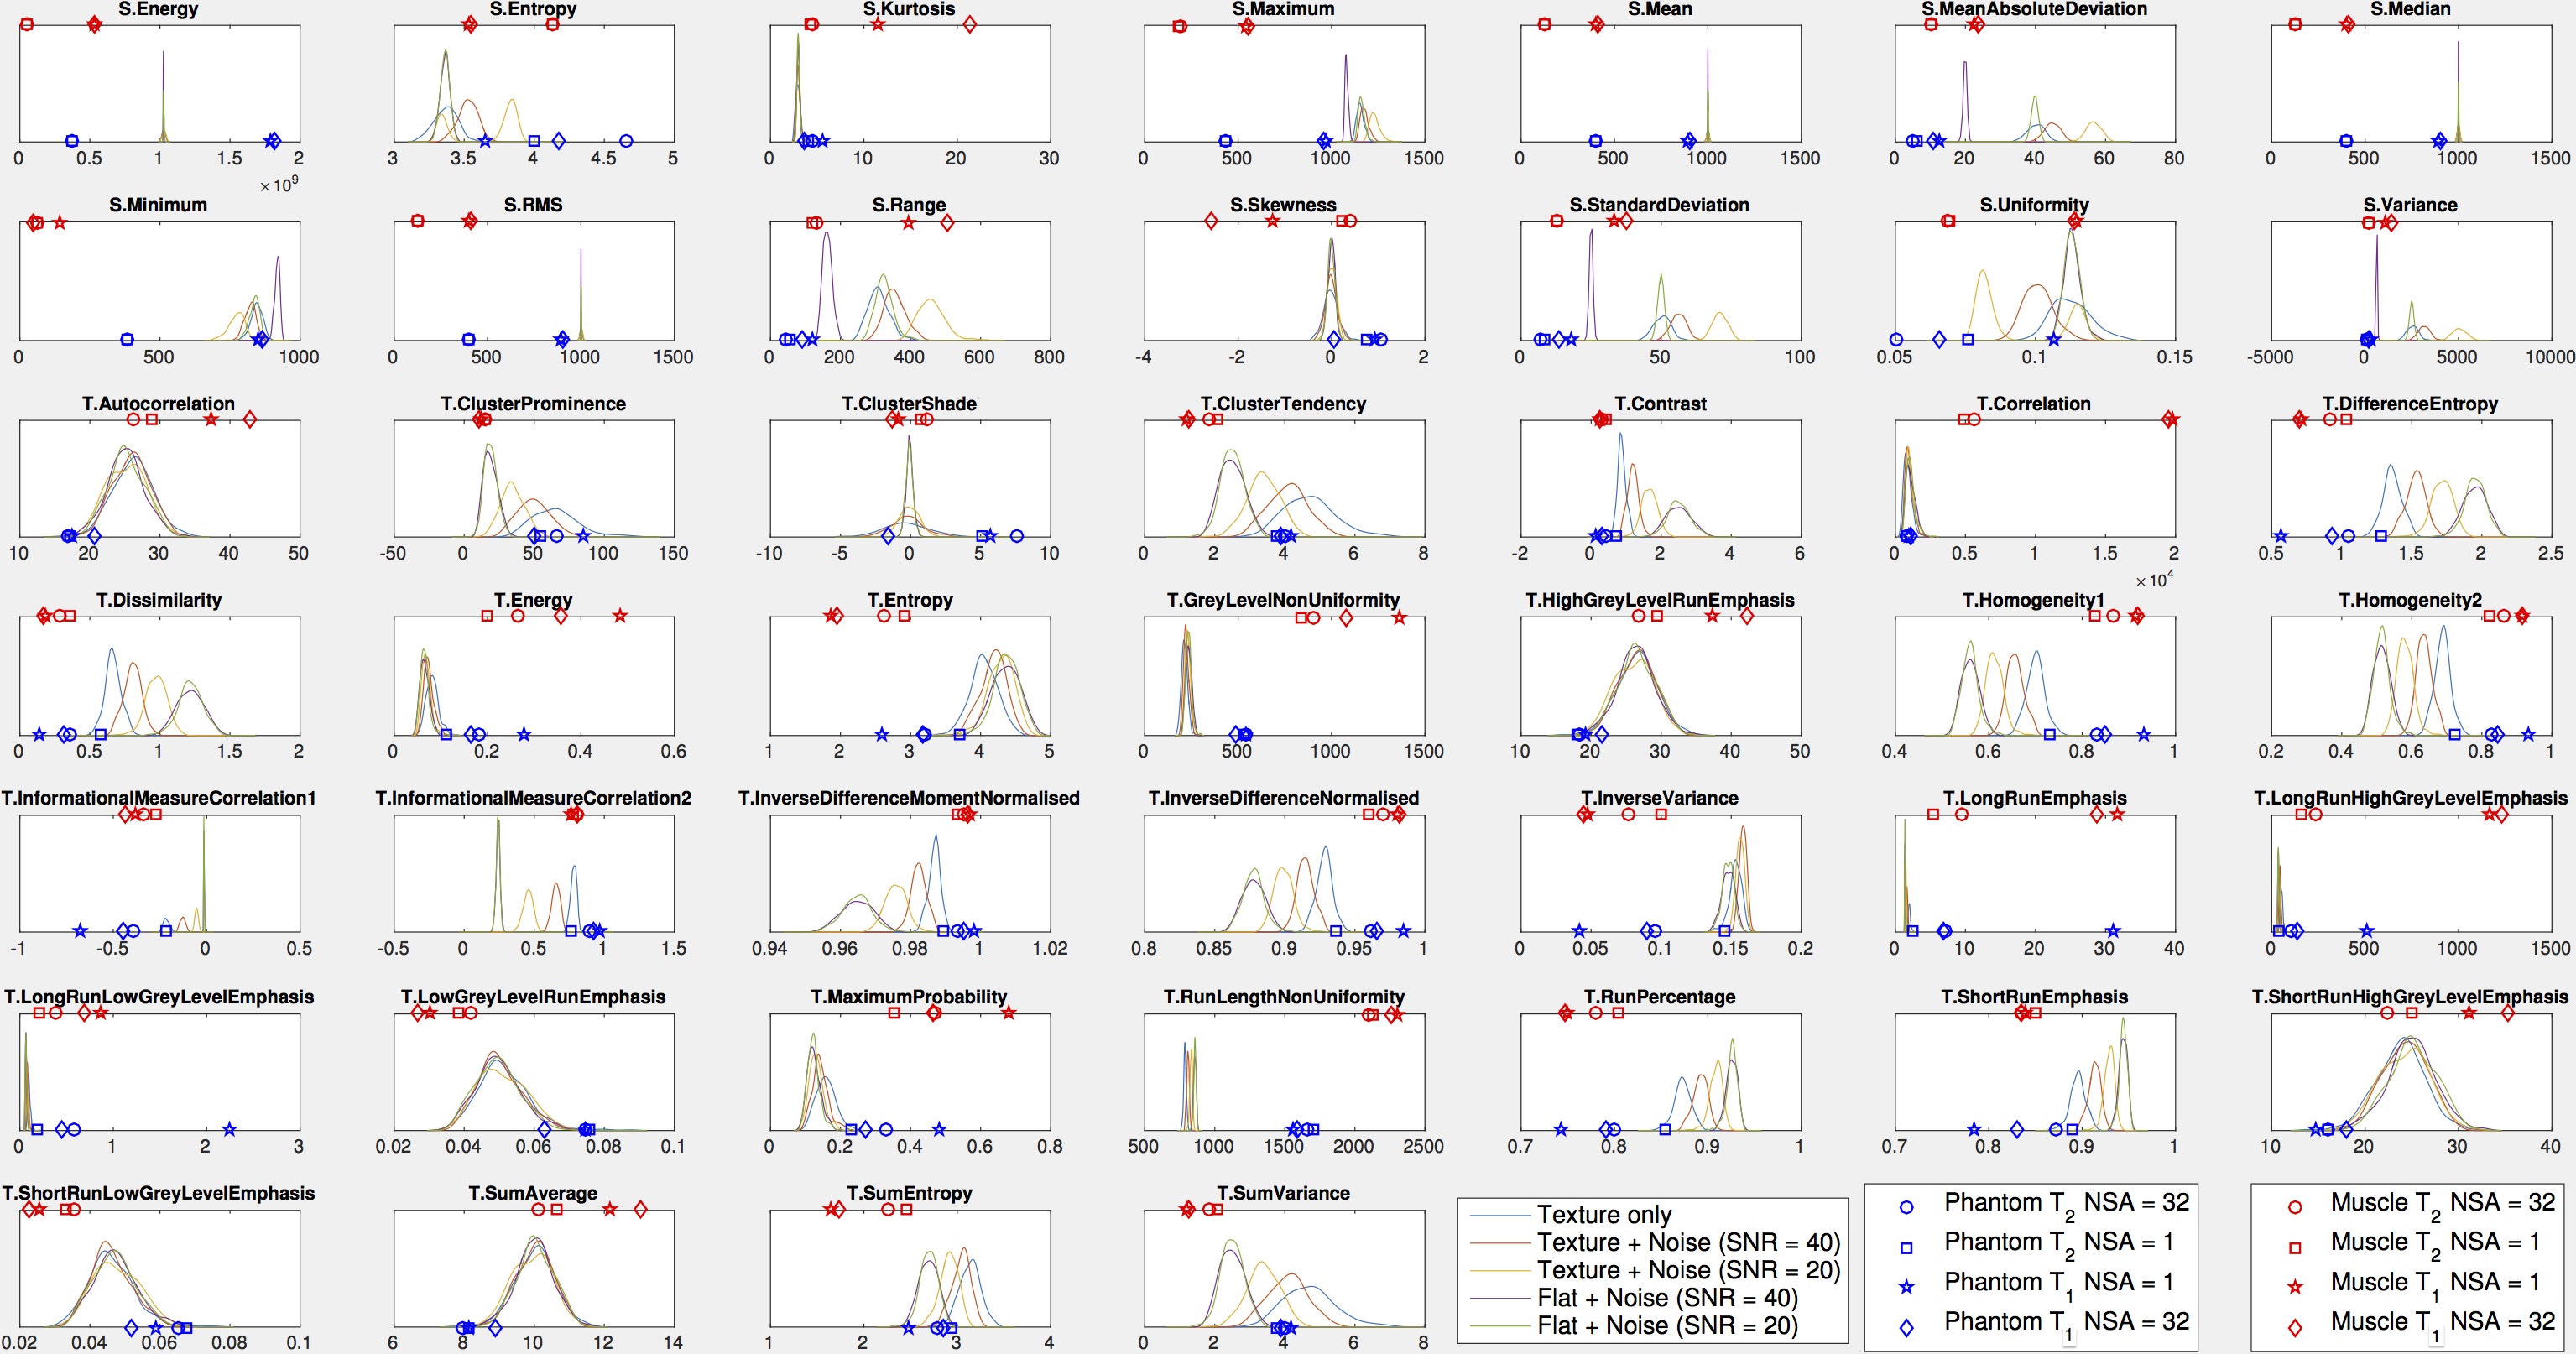
Firstly a Monte Carlo simulation of a uniform and simulated texture was developed using MATLAB (2015b, The MathWorks Inc., Natick, MA). Uniform textures were simulated with 32x32 images of Gaussian noise with mean value 1000 and noise standard deviations (std) of 25 and 50 (giving SNRs of 40 and 20). Simulated textures were generated by filtering a 32x32 noise image (mean 1000, std 200) with a pill-box kernel (2 pixel radius, 5x5 matrix) and three levels of additional noise were added to the same simulated texture (none, std=25 and std=50), see figure 1 for example images. The radiomics features proposed by Aerts et al6 were computed for all five images and the whole process repeated 1000 times, from which kernel smoothed histograms were generated for each feature, see figure 4.
Secondly a Siemens (Siemens Healthcare 5300ml nickel sulfate serial number 2147, Erlangen, Germany) MR Phantom and an organic texture (leg of lamb, New Zealand) were imaged using a clinical 1.5T Siemens MAGNETOM Aera (Siemens Healthcare, Erlangen, Germany) scanner.
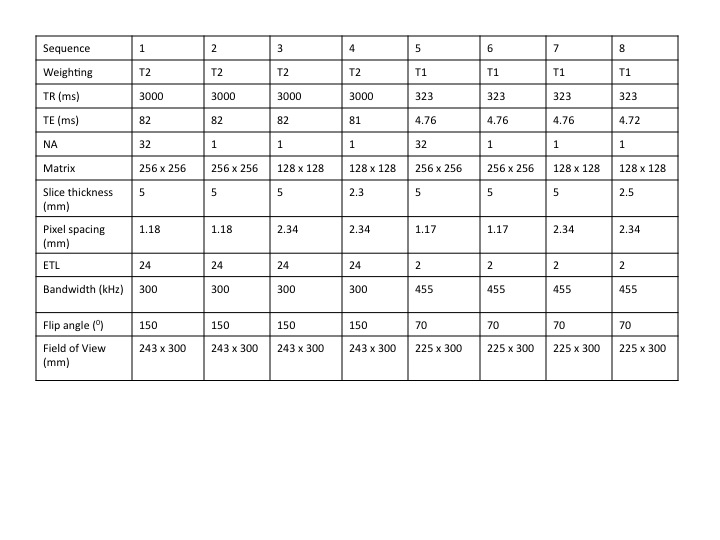
Clinical T1 and T2 weighted sequences were adapted to favour signal to noise ratio (SNR) and resolution by varying the number of averages (NA) and voxel size. Four T2 weighted and four T1 weighted sequences were acquired (sequences 1-8, figure 2). Sequences 1 and 5 had highest SNR and sequences 4 and 8 had highest spatial resolution with the smallest pixel spacing and voxel isotropy, or near-isotropy. Where possible remaining acquisition parameters were maintained constant with variation of NA and slice thickness to achieve optimal SNR and voxel isotropy. In some cases this was not possible, and the parameters were maintained as close as achievable to the other sequences.
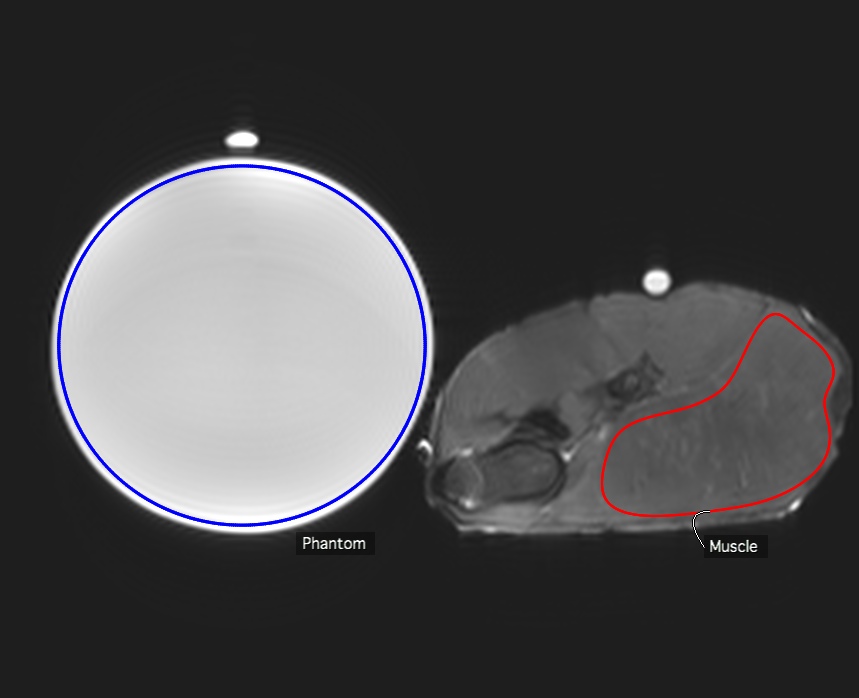
A circular region of interest (ROI) was drawn using a web-based quantitative imaging platform (ePAD v2.3.1, Stanford, CA, USA) in the phantom, and a ROI was drawn around a discreet muscle group in the leg of lamb (see figure 3). A MATLAB (2016b, The MathWorks Inc., Natick, MA) program extracted textural features using the method proposed by Aerts et al6.
Results
Results from the simulation data are presented as histograms in figure 4. Increasing sensitivity of textural features to noise is demonstrated by wider spacing of curve peaks on the x-axis.
Results from the experimental data for the phantom and organic texture variation with noise are presented in figure 5, in addition to the simulation data.
Discussion and conclusion
Existing literature has primarily used entropy and uniformity as imaging biomarkers in CT, with combinations of first order and second order textural features including contrast, complexity and entropy used in MRI5.
The simulation demonstrates that although many textural features are robust to image noise when applied to a uniform texture (the purple and green curves), they can vary strongly when noise is applied to a simulated texture (blue, red and yellow curves), for example homogeneity and dissimilarity. Other statistical features such as variance and range do not appear to exhibit this effect. This suggests that in many textural features, interaction between image noise (or other artefact) and inherent texture is important.
In the experimental uniform phantom and organic texture, changes in entropy and homogeneity are demonstrated with variations in image noise. Even in the uniform phantom, the presence of image artefact can result in wide variations in textural features with noise, and are less likely to be useful in clinical practice.
Textural features such as informational measure correlation2 and inverse difference moment normalised are robust and invariant to image noise. The ideal texture measure would be both robust to noise and image artefact, but sensitive to underlying texture.
These data confirm that the interaction of MR noise with an underlying texture influences textural features. Furthermore in clinical practice the presence of artefact alone is sufficient to cause texture variation with acquisition parameters.
Acknowledgements
CRUK and EPSRC support to the Cancer Imaging Centre at ICR and RMH in association with MRC & Dept of Health C1060/A10334, C1060/A16464 and NHS funding to the NIHR Biomedical Research Centre and the Clinical Research Facility in Imaging.References
1. Al-Kadi OS. Assessment of texture measures susceptibility to noise in conventional and contrast enhanced computed tomography lung tumour images. Comput Med Imaging Graph. 2010;34(6):494–503.
2. Mayerhoefer ME, Szomolanyi P, Jirak D, Materka A, Trattnig S.Effects of MRI acquisition parameter variations and protocol heterogeneity on the results of texture analysis and pattern discrimination: an application-oriented study. Med Phys. 2009;36(4):1236–1243.
3. Waugh SA, Lerski RA, Bidaut L, Thompson AM. The influence of field strength and different clinical breast MRI protocols on the outcome of texture analysis using foam phantoms. Med Phys. 2011;38(9):5058–5066.
4. Collewet G, Strzelecki M, Mariette F. Influence of MRI acquisition protocols and image intensity normalization methods on texture classification. Magn Reson Imaging. 2004;22(1):81–91.
5. Davnall F et al. Assessment of tumor heterogeneity: an emerging imaging tool for clinical practice? Insights Imaging. 2012;(3):573–589.
6. Aerts H et al. Decoding tumour phenotype by noninvasive imaging using a quantitative radiomics approach. Nat commun. 2014;3(5):4006.
Figures