1473
Simulation of Sound Pressure Level of MRI Scan Considering Eddy Currents1Medical Systems Research Department, Research & Development Group, Hitachi, Ltd., Tokyo, Japan
Synopsis
Since optimal waveforms should be chosen for each gradient pulse in order to reduce sound pressure levels (SPLs) in MRI scans, the simulation accuracy of the SPL must be improved. Assuming that the eddy current component is a cause of the disagreement between the measured and the simulated SPLs, we compared the simulation results with and without the eddy current component in this study. By including the eddy current component in the simulation, the magnitude of the SPL decreased, which reflects the decrease in the peak amplitude of the frequency component of the gradient waveform. However, the eddy current component did not affect the change trends of the SPLs depending on the change of waveforms. On the other hand, a slight change in the peak position of the frequency response functions appears to cause a significant change in the SPL, and the error of the FRF was also thought to cause disagreement between the measured and simulated SPLs.
Purpose
Optimizing the waveform of the gradients has been reported to reduce acoustic noise [1, 2], and this technique is already in clinical use. However, the optimal gradient waveform should be machine dependent because of the difference in frequency response functions (FRF) [3] due to scanner structure. Therefore, the optimal waveforms for silent MRI scans should be estimated by using acoustic noise simulations on the basis of the FRF. In this study, the validity of the simulations for determining the optimal gradient waveforms was assessed, and when the agreement between the simulation and experiment was poor, the cause of the disagreement was considered.Methods
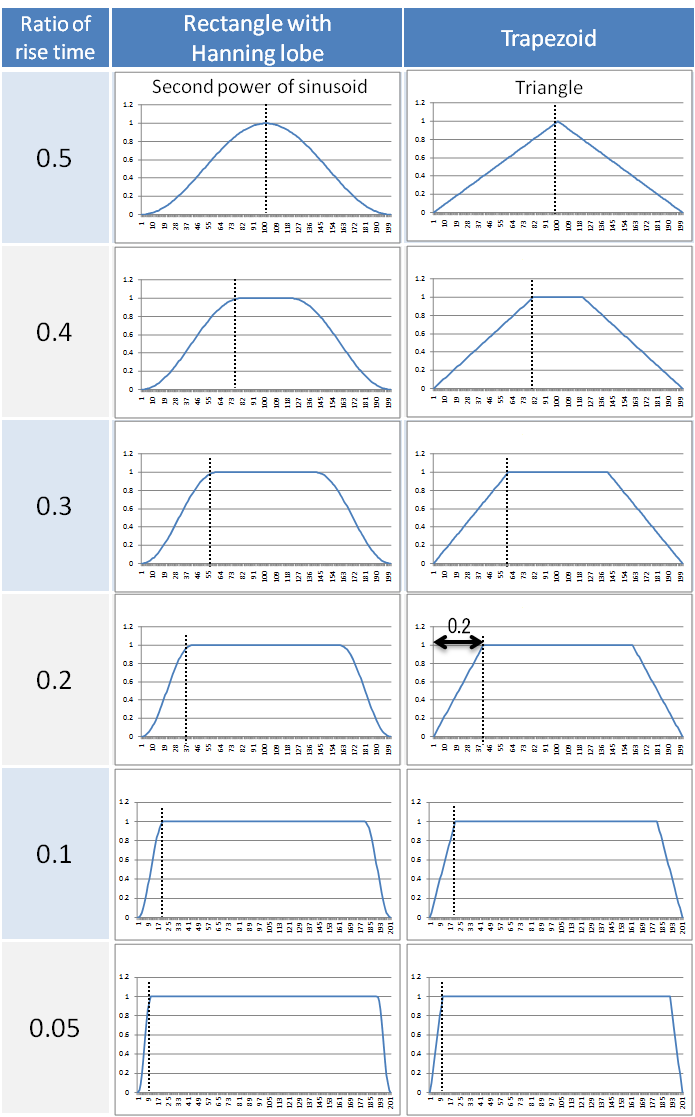
The pulse sequences used for the noise source are single-pulse and spin-echo (SE) sequences. The waveform for each gradient pulse was selected from previously provided waveforms (a rectangle with Hanning lobe at both ends, a sinusoid, and a triangle, see Fig. 1), and both the measured and the simulated acoustic noise levels were compared among the different waveforms. The acoustic noise levels were simulated with in-house software on the basis of the predetermined FRF without and with the effect of eddy current on gradient waveforms because the waveform distortion by the eddy current is a possible cause of the disagreement between the simulation and measurement. The component of the eddy current was estimated by using the transfer function of a first-order model, which agreed with the actual measurement. To replicate the sensitivity of the human ear, A-weighting was used in both the simulations and actual measurements.Results
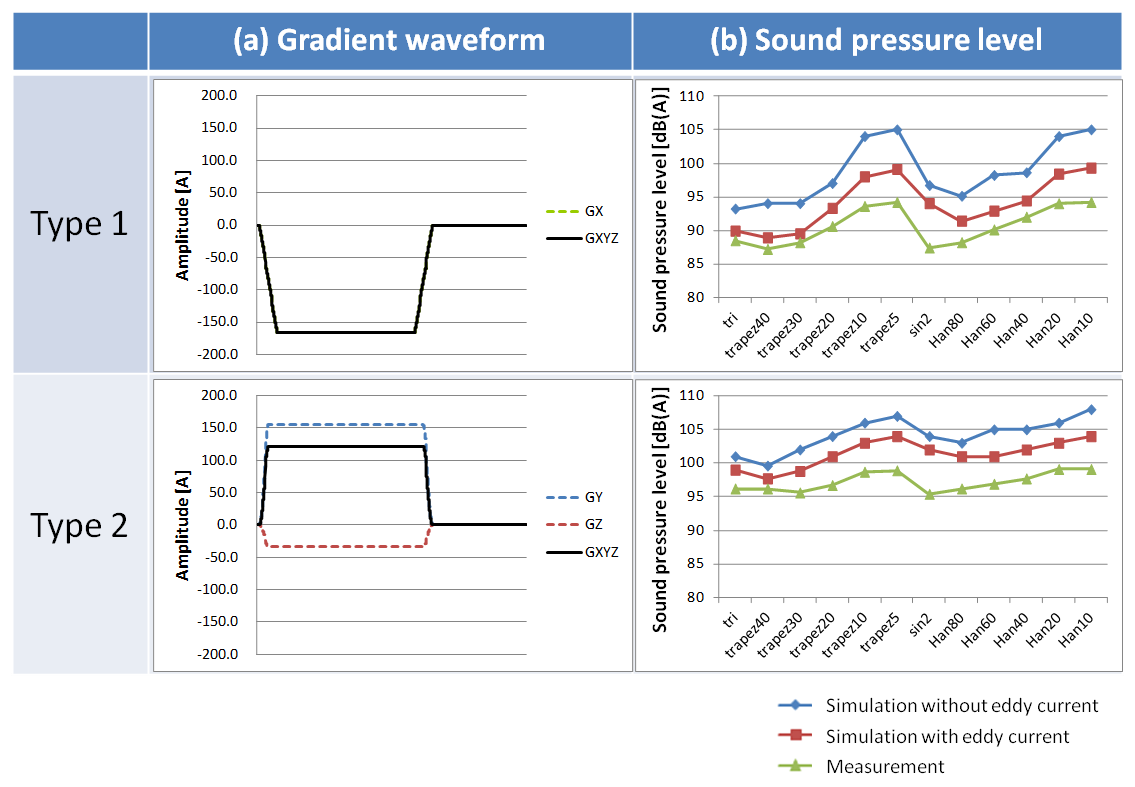
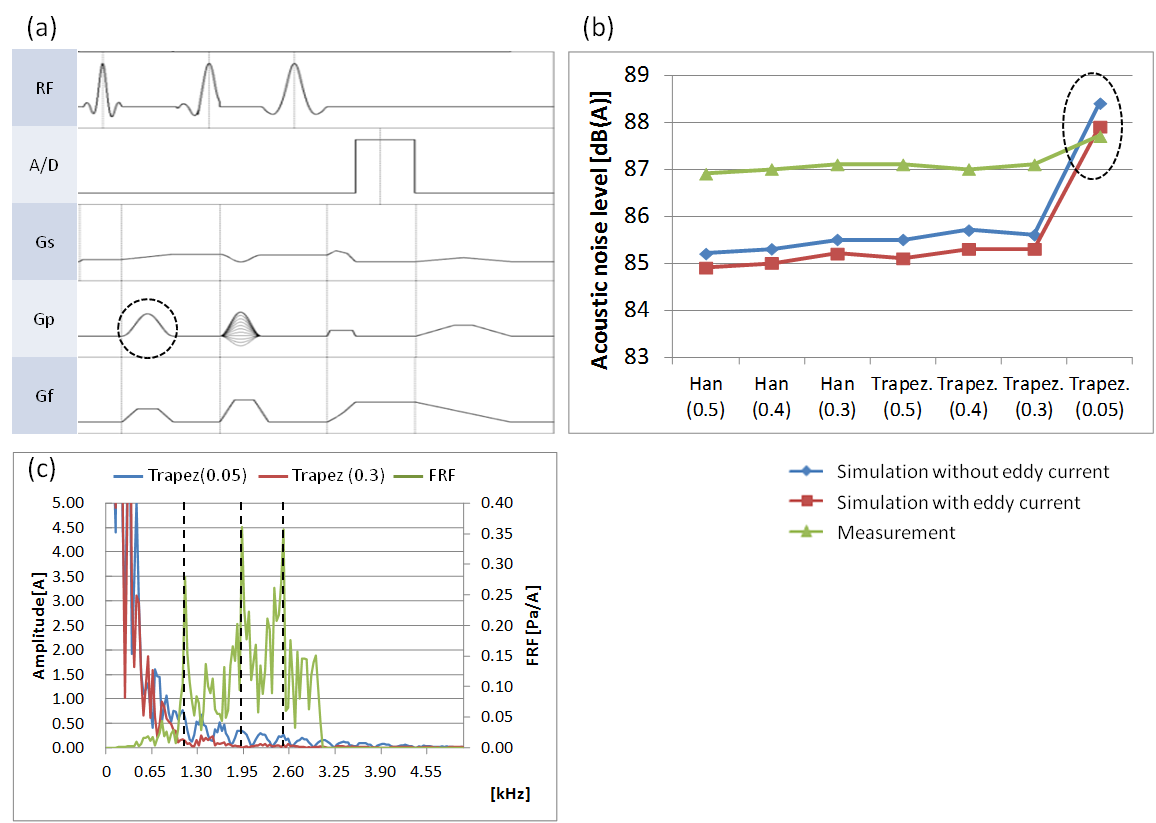
The sound pressure levels (SPLs) induced by the two single-pulse sequences shown in Fig. 2(a) were compared. The gradient pulse in the type 2 sequence is an oblique pulse consisting of Gy and Gz. There are two differences between the measured and the simulated SPLs: (a) magnitude, and (b) change trend of the SPLs depending on the change of waveforms. The magnitudes of the simulated SPLs were decreased when the eddy current components were considered, which reflects the decrease in the peak amplitude of the frequency component of the gradient waveform. As a result, the differences between measurement and simulation were reduced at a maximum of 5 dB(A). The change trends of the SPLs depending on the change of waveforms were barely affected by the eddy current components. The SPLs induced by SE with pre-saturation shown in Fig. 3(a) were also compared. The gradient pulses were transformed from simple trapezoids into various waveforms to evaluate the effects of the waveforms on the SPLs. Figure 3(b) compares the SPLs depending on the change of the waveform of a gradient pulse. When the eddy current components were considered, the magnitudes of the simulated SPLs decreased similarly as above, though the change was negligible (0.3 - 0.4 dB(A)). On the other hand, the simulated SPL of Trapez. (0.05) was significantly higher than those of the other waveforms. Moreover, it was not lowered when the eddy current components were considered.Discussion & Conclusion
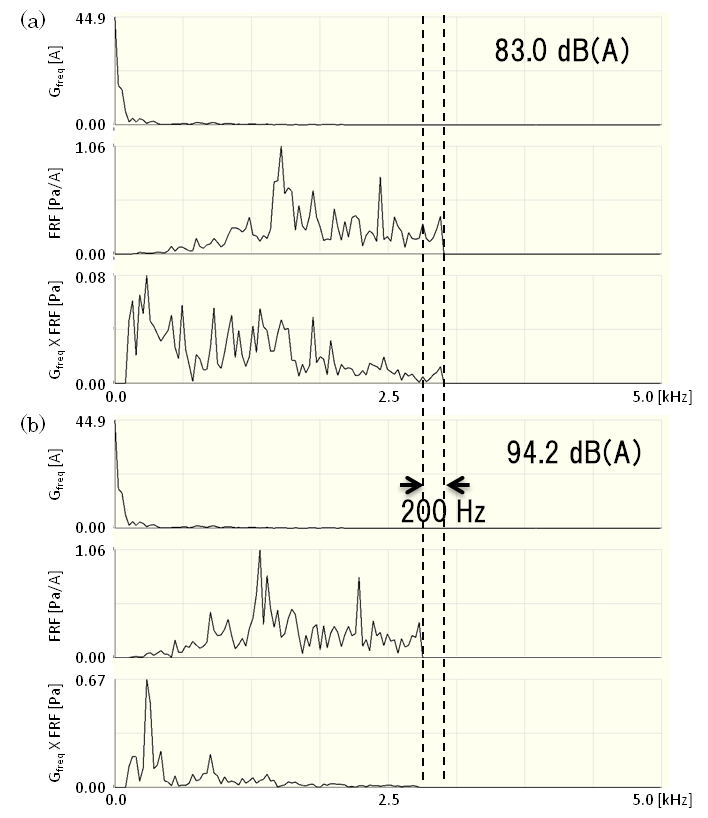
The eddy current components barely affected trend of the SPL depending on the change of the gradient waveform. Thus, it would appear that the eddy current is not the only factor of the difference between the measurement and simulation. In the SE results, Trapez. (0.05) significantly differed from the other waveforms. Figure 3(c) shows the relationship between the FRF and the frequency components of Trapez. (0.05) and Trapez. (0.3). Trapez. (0.05) has large side lobes at the peak positions of the FRF, and this coincidence of the side lobes and the peak positions was thought to be the cause of the SPL difference described above. On the other hand, a slight change in the peak position of the FRF appears to cause a significant change in the SPL, as shown in Fig. 4. Thus, the difference in the trend of the SPL depending on the waveform changes was thought to be caused by the error of the FRF. This error is possibly caused by, for example, the difference between the measurement system in the FRF measurement and that of the SPL measurement, or the variation of the acoustic characteristic of a MRI scanner due to the effect of the external environment. Therefore, the FRF peak may possibly shift due to the various causes described above and consequently affect the SPLs.Acknowledgements
References
1. Hennel F, Girard F, Loenneker T. “Silent” MRI with Soft Gradient Pulses. Magn Reson Med 1999; 42:6-10.
2. Heismann B, Ott M, Grodzki D. Sequence-Based Acoustic Noise Reduction of Clinical MRI Scans. Magn Reson Med 2014; 0:1-6.
3. Hedeen RA, Edelstein WA. Characterization and Prediction of Gradient Acoustic Noise in MR Images. Magn Reson Med 1997; 37:7-10
Figures