1468
Diffusion effects on T2 relaxometry with triple echo steady-state free precession sequence1Shenzhen Institutes of Advanced Technology, Chinese Academy of Sciences, Shenzhen, People's Republic of China
Synopsis
In this study, the underestimation of T2 by TESS was revealed through simulation and phantom study. The bias becomes significant in high resolution TESS imaging with larger unbalanced gradient moment, as the diffusion effect can not be neglected. A possible correction scheme was also proposed, the results validated the diffusion effect on T2 estimation. However, the correction method relies on T1/T2/D as priori to calculate the signal change ratio through EPG algorithm. A possible solution might be simultaneous estimation on apparent diffusion coefficient and T2.
Purpose
Rapid and accurate T2 relaxometry with triple echo steady-state free precession (TESS) has been previously reported [1, 2]. Compared to conventional T2 mapping techniques, TESS is fast and robust against B1 inhomogeneity, making it an attractive option for T2 quantification at high to ultra-high filed. However, when the spatial resolution is increased in high/ultra-high field system, the diffusion effect due to the large unbalanced gradient has not been investigated for T2 relaxometry. The purpose of this work is to verify the diffusion effect on T2 quantification by TESS with high resolution imaging. A correction scheme was also proposed and validated through phantom experiments.Materials and methods
Theory: In TESS T2 relaxometry, T2 is estimated by minimizing the signals to their analytical solution:
$$ T2 = arg min{[S+-M0F+]2 + [S0-M0F0]2 + [S--M0F-]2} (1) $$
where M0 is the normalized signal intensity, S+/S0/S- are the acquired signals, while F+/F0/F- are the corresponding analytical solutions reported previously [3].
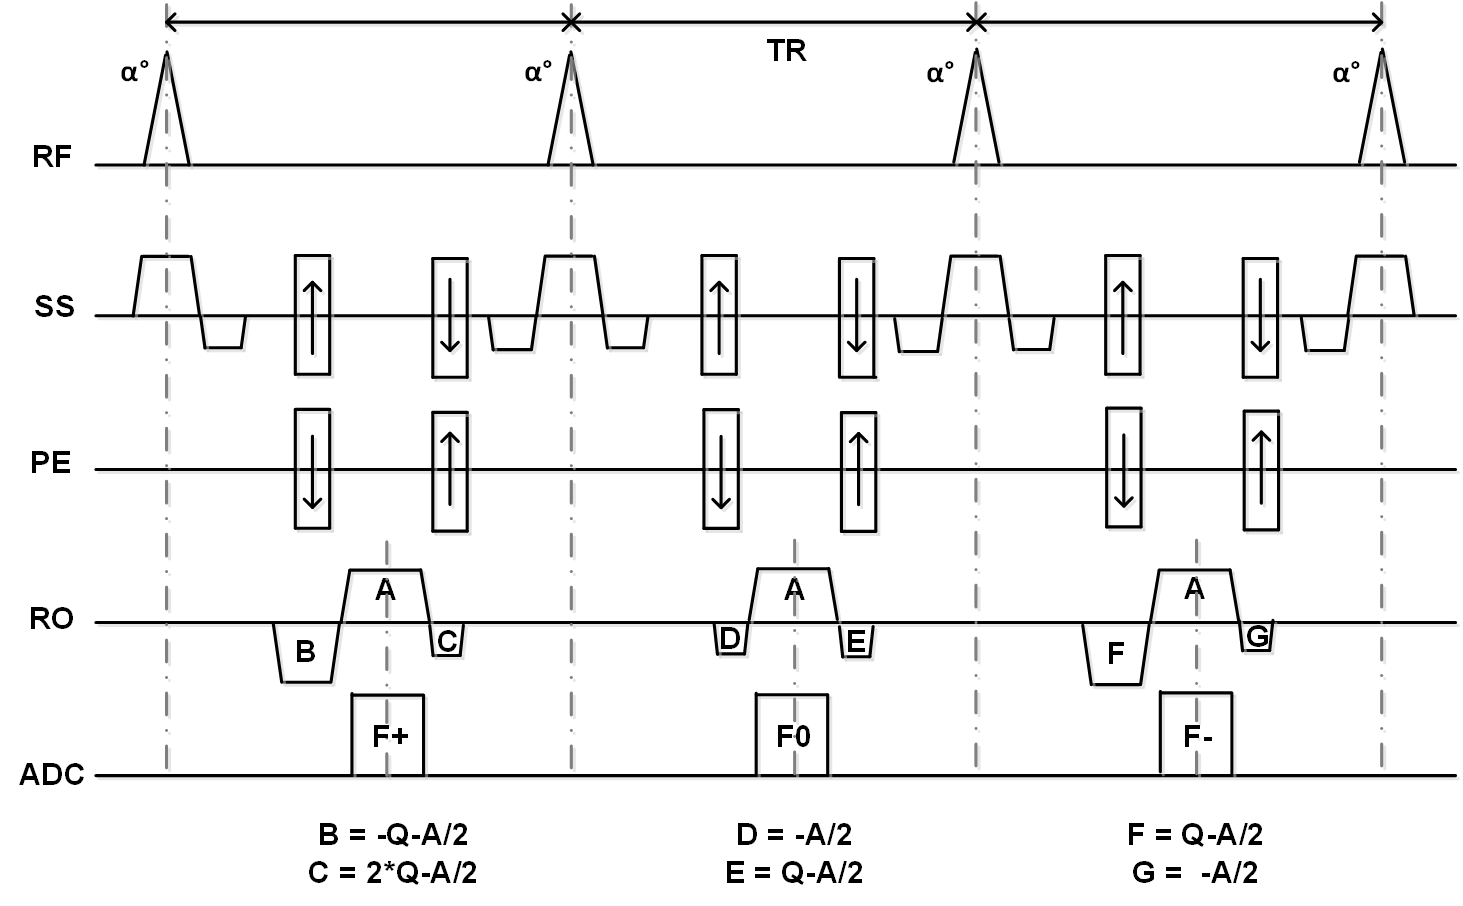
Interleaved triple echo steady-state (iTESS) sequence was used in the study (Figure 1). The unbalanced gradient moment Q was related to the phase dispersion (φ) across the voxel spatial extent through:
$$ Q = φ/(2πγΔx) (2) $$
where γ is the gyro-magnetic ratio. As Q becomes large for high resolution imaging, the diffusion effect could not be ignorable for the TESS signals, especially for F-, which may result in underestimation of T2.
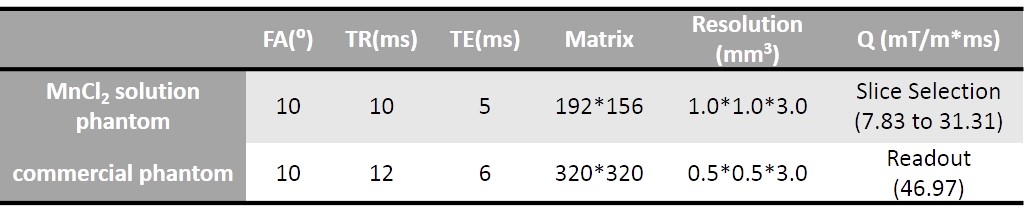
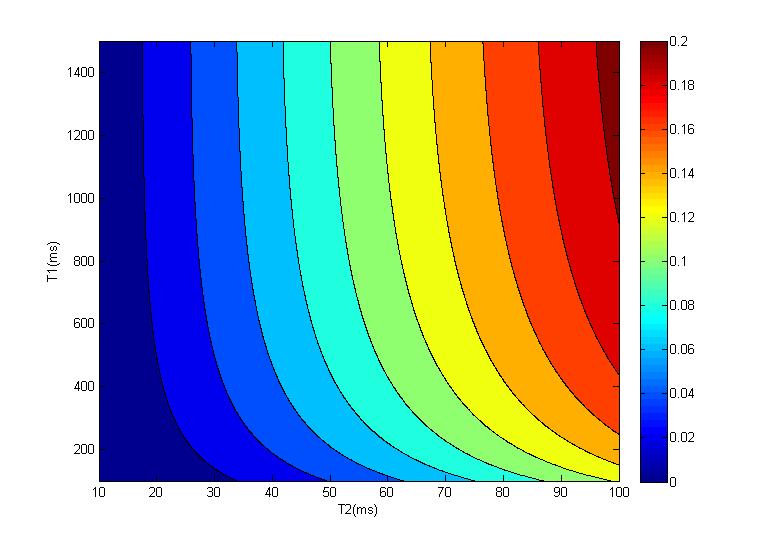
Simulation: To illustrate the diffusion effect on T2 relaxometry, a simulation was performed with varying T1 (100-1000 ms) and T2 (10-100 ms), flip angle α = 10⁰, TR/TE = 10/5 ms. Considering diffusion effect, the apparent diffusion coefficient D was 1.87*10-9 m2/s, Q = 31.31 mT/m*ms with gradient strength = 22.4 mT/m. The F+/F0/F- with diffusion effect were calculated using EPG algorithm described in [4]. T2 was then estimated by solving Eq. [1]. As the diffusion effect was neglected in the traditional TESS method, the T2 was biased, and the relative error |T2f – T2t| / T2t, in which T2f is the fitted value, T2t is the true value, was analyzed.
Experiment: All the experiments were conducted on a 3T MRI scanner (TIM TRIO, Erlangen, Germany). The protocols in detail are listed in Table 1. An MnCl2 water phantom (T1/T2 = 109/77 ms, D = 1.87*10-9 m2/s at room temperature) was scanned with Q varied in the range by changing the gradient duration time while keeping the gradient amplitude identical (22.4 mT/m). Another commercial phantom with 9 tubes containing samples with known T1/T2 was scanned with higher resolution. Q = 46.97 mT/m*ms corresponded to 2π phase dispersion across the 0.5 mm voxel size in RO direction.
Results
Figure 2 shows the relative T2 bias due to the diffusion effect with different T1/T2.
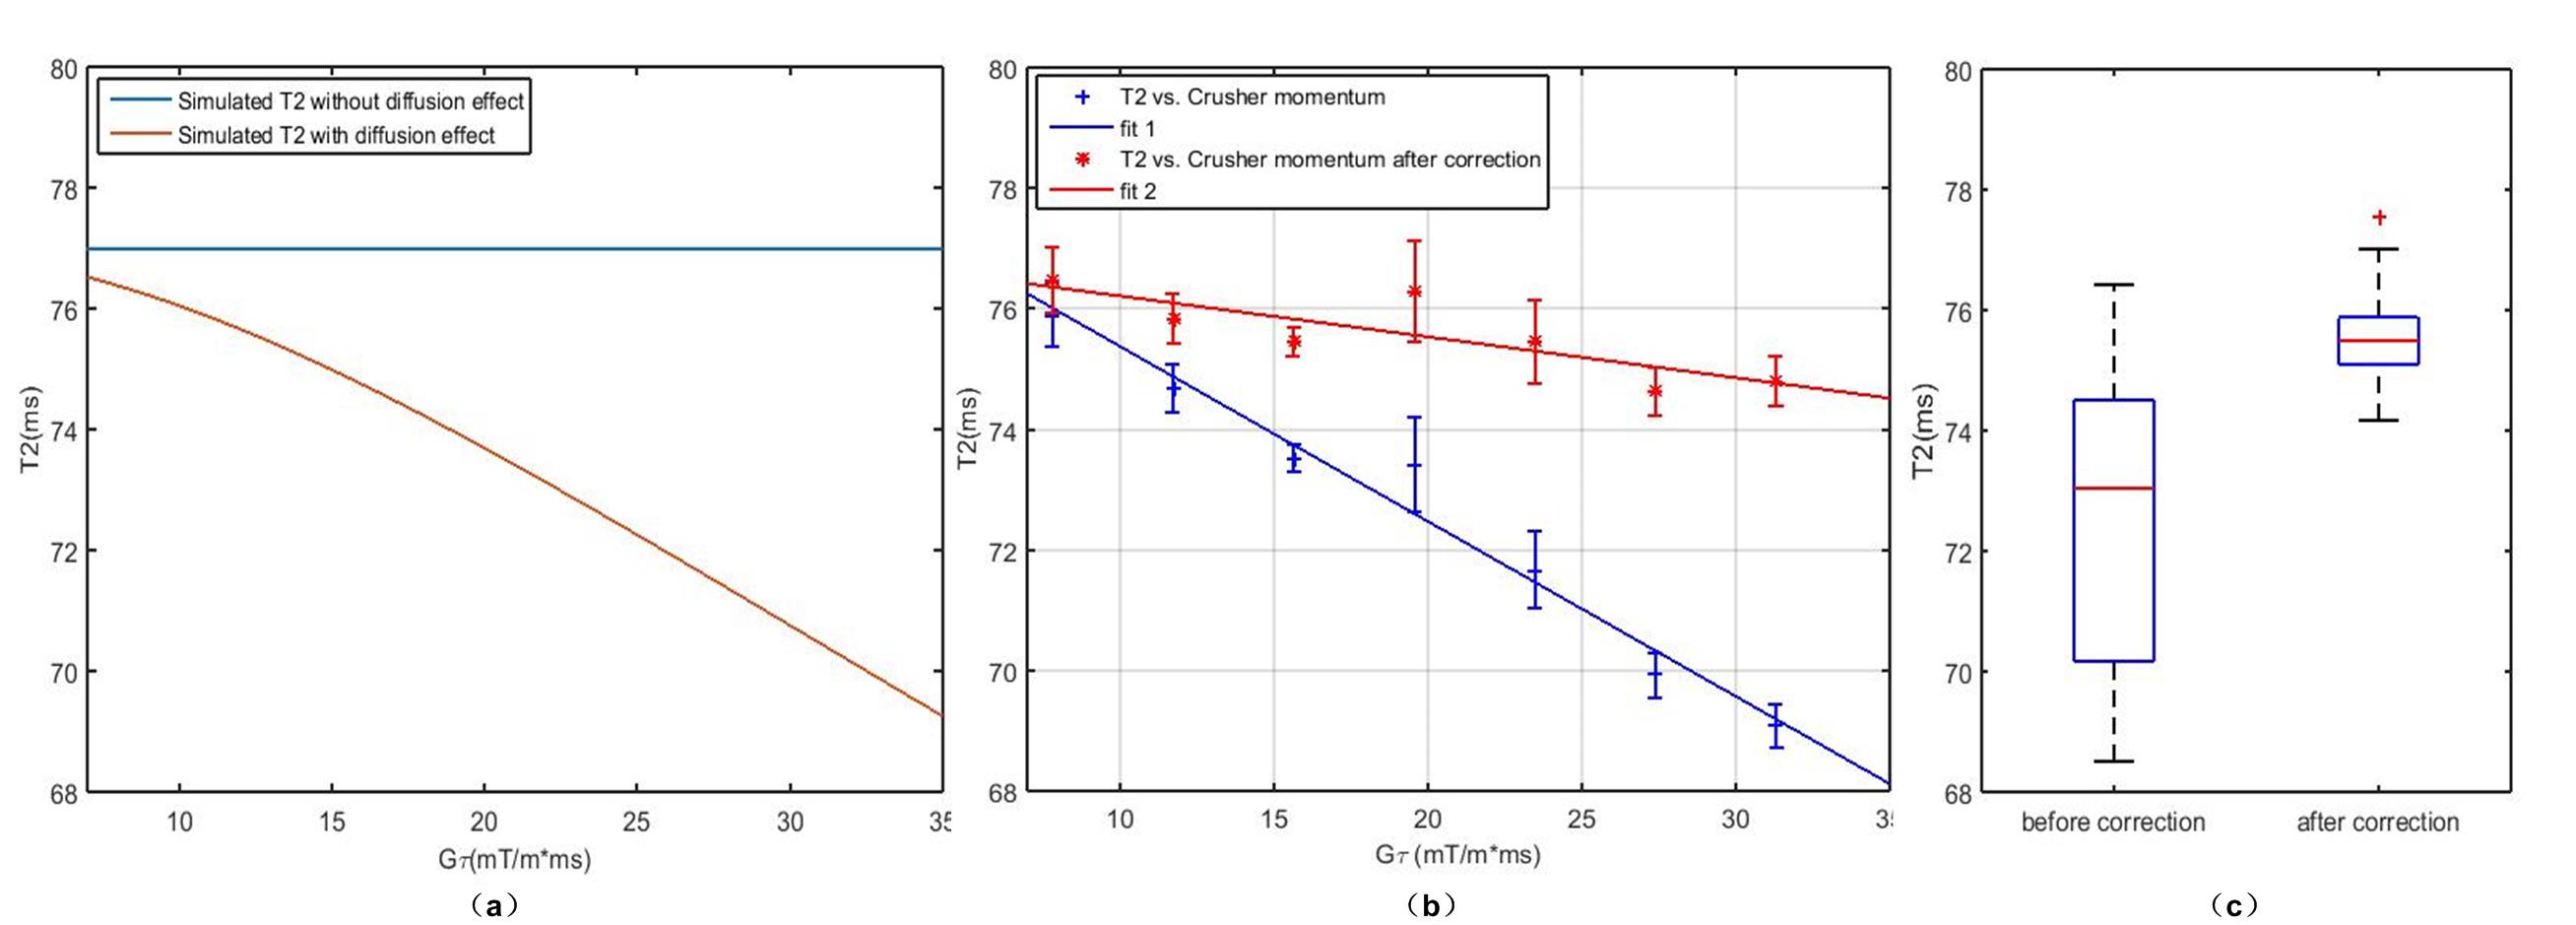
Figure 3(a-b) show the simulated and experimental diffusion effect of MnCl2 phantom with varying unbalanced gradient moment Q. The error of the estimated T2 without considering diffusion increased with larger Q. The corrected T2 values are shown in Figure 3(b) in red stars, and the statistical analysis showed that the corrected T2 were closer to the true value.
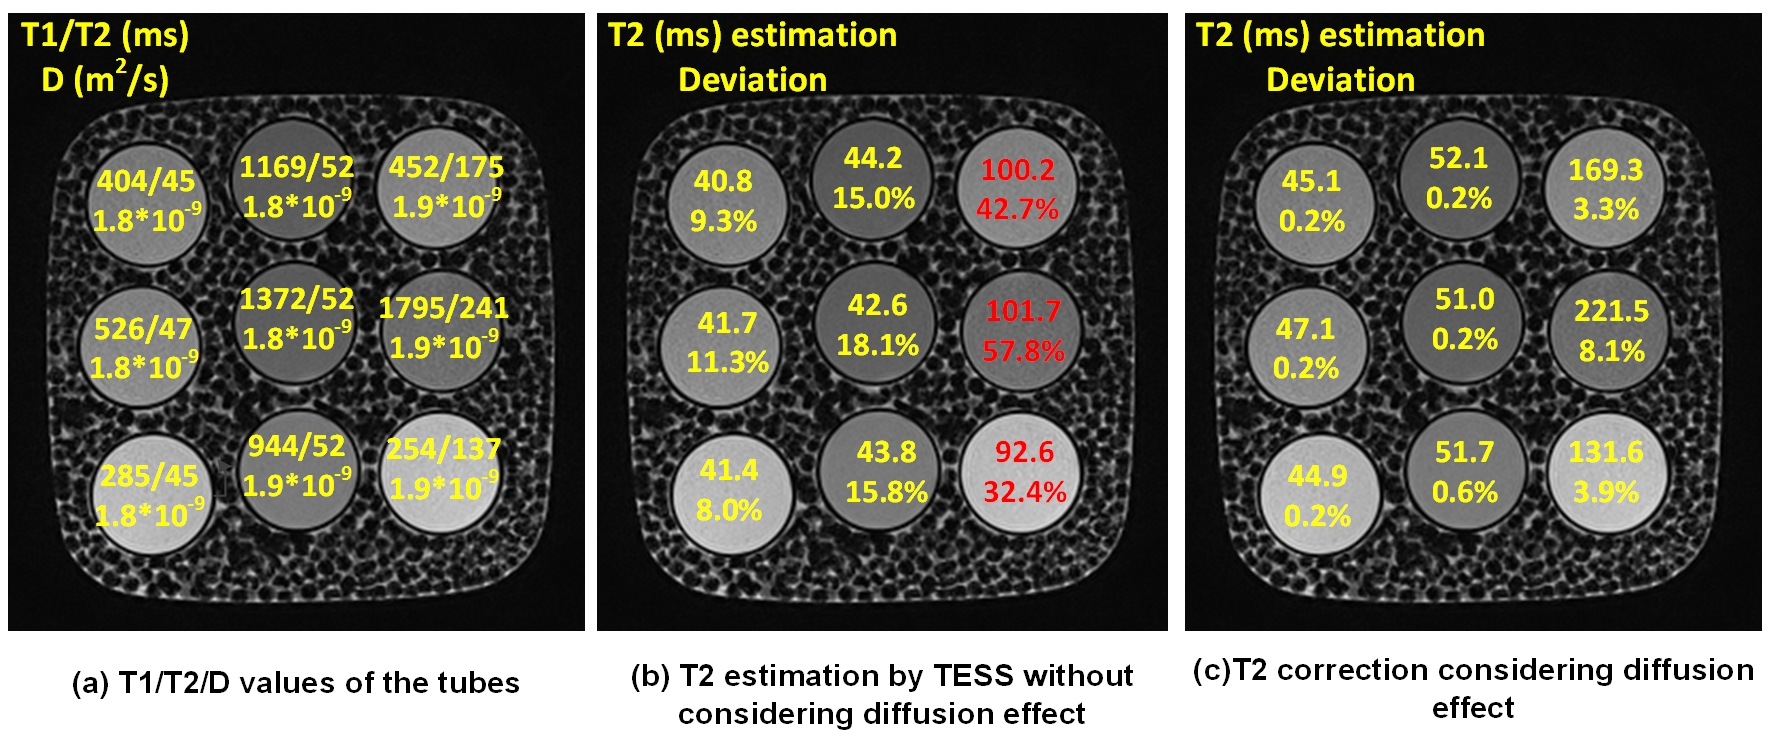
T2 estimation of the commercial phantom with higher resolution is shown in Figure 4. Figure 4(a) shows the T1/T2/D values in each tube respectively. Figure 4(b) showed that the T2 is underestimated, especially in tubes with large T2. The relative error was as large as 57.8% in the tube with T2 = 241 ms. The results also verified the T2 underestimation is dependent of the T2 value, as indicated in Figure 2. Figure 5(c) shows the T2 map after correction, and the T2 values were very close to its actual value.
Discussion and Conclusions
In this study, the underestimation of T2 by TESS was revealed through simulation and phantom study. The bias becomes significant in high resolution TESS imaging with larger unbalanced gradient moment, as the diffusion effect can not be neglected. A possible correction scheme was also proposed, the results validated the diffusion effect on T2 estimation. However, the correction method relies on T1/T2/D as priori to calculate the signal change ratio through EPG algorithm. A possible solution might be simultaneous estimation on apparent diffusion coefficient and T2.Acknowledgements
This research was supported by the National Natural Science Foundation of China No. 81327801, 61302040, 11504401, 81527901, 81301242, U1301258, National Key R&D Program No. 2016YFC0100100, Shenzhen Science and Technology Research Program No. JCYJ20150630114942317 and JCYJ20150521094519487References
[1] Heule R, Ganter C, Bieri O. Triple echo steady-state (TESS) relaxometry. Magnetic Resonance in Medicine. 2014;71:230-7.
[2] Heule R, Bär P, Mirkes C, Scheffler K, Trattnig S, Bieri O. Triple-echo steady-state T2 relaxometry of the human brain at high to ultra-high fields. NMR in biomedicine. 2014;27:1037-45.
[3] Hanicke W, Vogel HU. An analytical solution for the SSFP signal in MRI. Magnetic resonance in medicine. 2003;49:771-5.
[4] Weigel M. Extended phase graphs: dephasing, RF pulses, and echoes - pure and simple. Journal of magnetic resonance imaging : Journal of Magnetic Resonance Imaging. 2015;41:266-95.
Figures